Atatus had been primarily a JavaScript Error Monitoring service. We want to be the service which will give the complete status of your application (Atatus means Application Status). This is our first step in that direction.
We are excited to announce the that, we’re offering Real User Monitoring (RUM) feature along with our Advanced JavaScript Error Monitoring service.
We want to give an overview of what Real User Monitoring is, and how Atatus can help in making use of this data.
What is Real User Monitoring
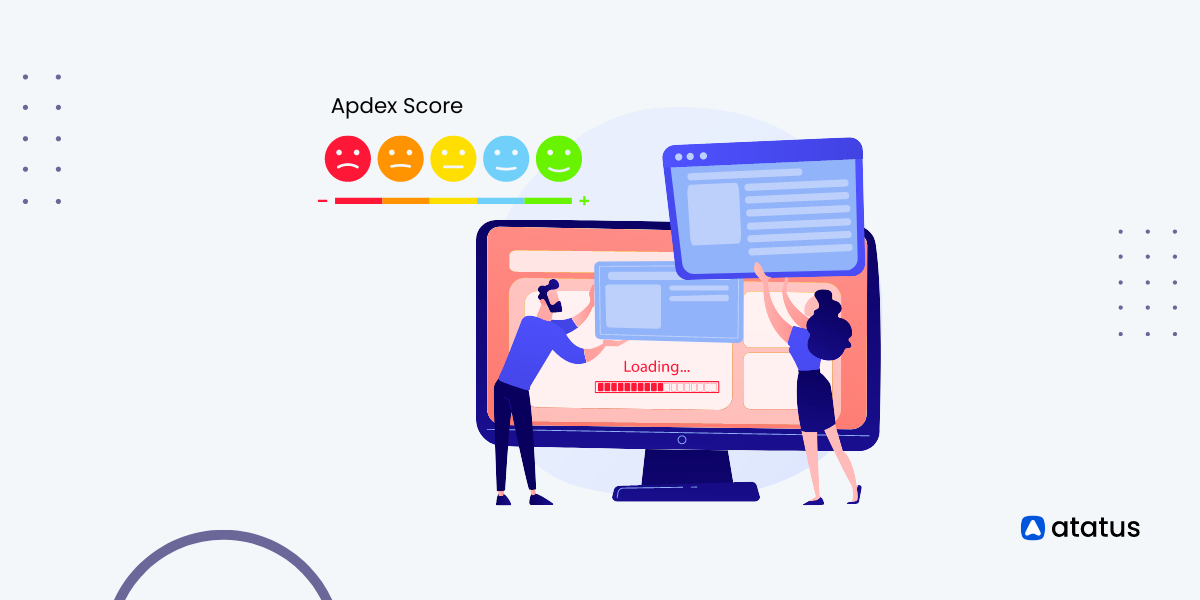
Real User Monitoring helps you determine if users are being served quickly and without errors and, if not, which part of a business process is failing.
Real User Monitoring with respect to Web Apps

These are the most critical points for a page performance:
- navigationStart - When the user keys in the URL in the address bar
- domainLookupStart/End - When the domain is looked up in the DNS
- connectStart/End - When the connection with your server is done
- requestStart - When the first request from the browser goes to your server
- responseStart - When the server’s first response byte reaches your browser
- responseEnd - When all the data from your server has reached
- domLoading - When the browser is about to start parsing the first received bytes.
- domComplete - When all of the processing is complete and all of the resources on the page (images, etc.) have finished downloading - i.e. the loading spinner has stopped spinning.
- loadEventStart/End - the browser fires an “onload” event which can trigger additional application logic.
Atatus with JavaScript Page Load Performance
We capture the page load time of every page and group them into three main sections. These three sections would you give you an overview of what exactly happens and where you have to work on to speed up your web app. They are:
- Network Time
- DOM Processing Time
- Page Rendering Time

Network Time
From the navigation start till the response is received from the backend server is the complete network time. This would give you an overview of how much time your web app needs for communication from the browser to your server. This is what we categorically call as “backend call”.
DOM Processing
DOM processing is the time it takes to parse the HTML into a DOM and retrieve or execute synchronous scripts. If you have any script tags in the body of your document, their execution is part of DOM processing. If the browser starts to download images in this phase, page load timing will capture the image load time. When you see a delay here, then you would know that your third party resources could affect your overall page load time.
Page Rendering
It’s the time spent by browser-side processing of the page content, and often includes time for scripts and static assets to load. Render time measure the time it takes to actually process CSS & JavaScript and show their end-result to the visitor.
Get Started with Atatus
Ready to start Real User Monitoring (RUM) and speed up your web app with Atatus. It is just a one minute process. Sign up and install the two line script in all your pages and you are good to go. In no time you’ll be able to see how your pages are performing for all your users.
You can see which browsers run the slowest and for which countries the throughput is the lowest. Tweak your web app accordingly. Lastly, don’t forget that performance matters to your users
Ready to optimize your site for real users? Sign up and deploy Atatus today.