Real User Monitoring (RUM)

Monitor web performance with Real User Monitoring

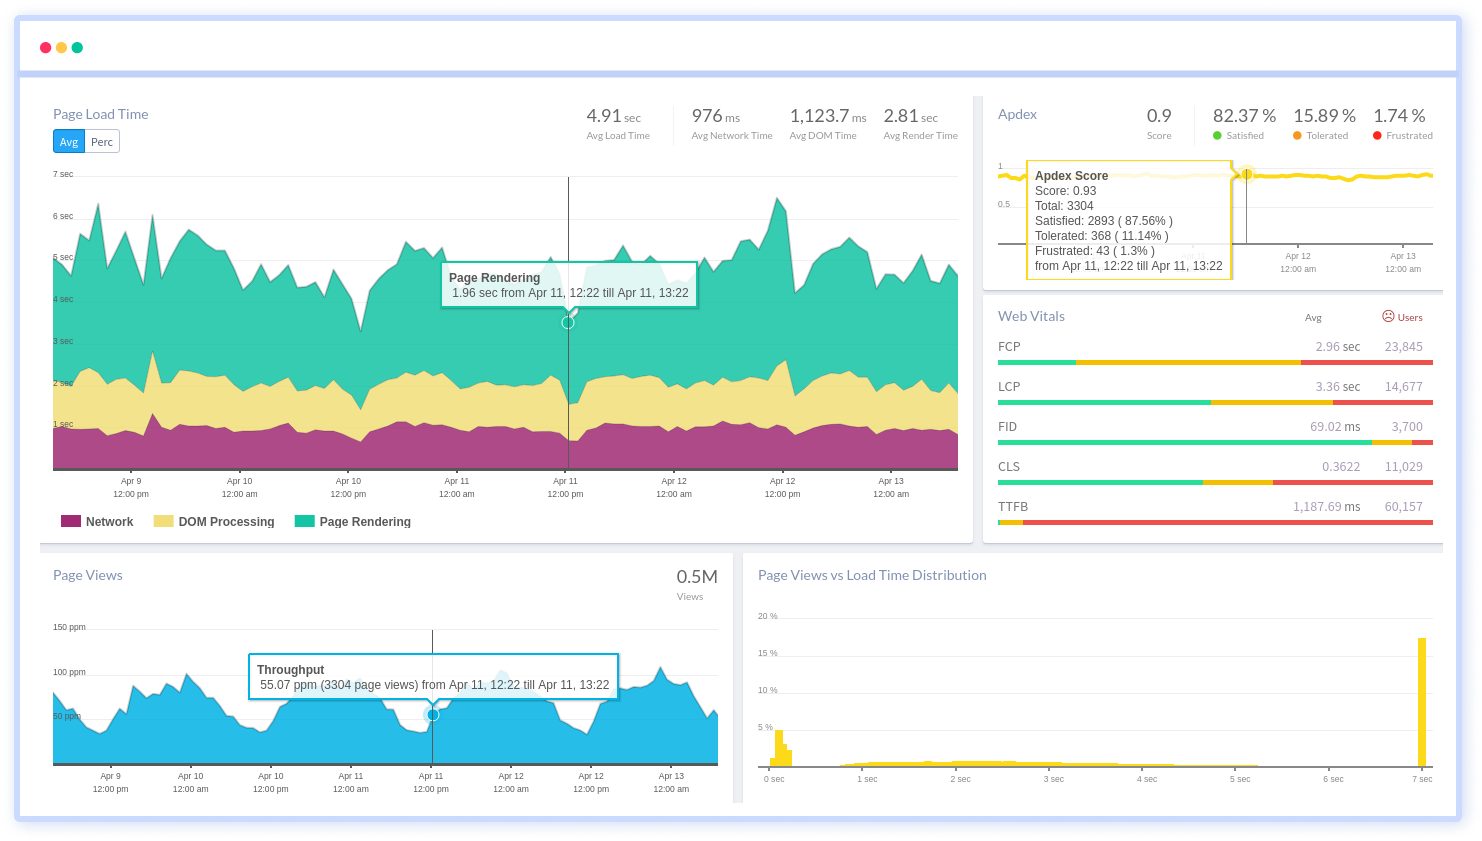
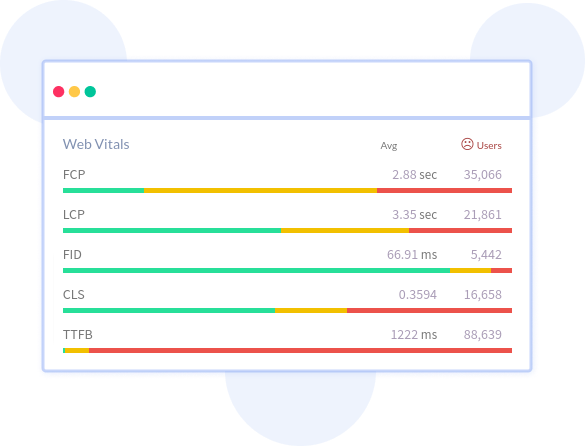
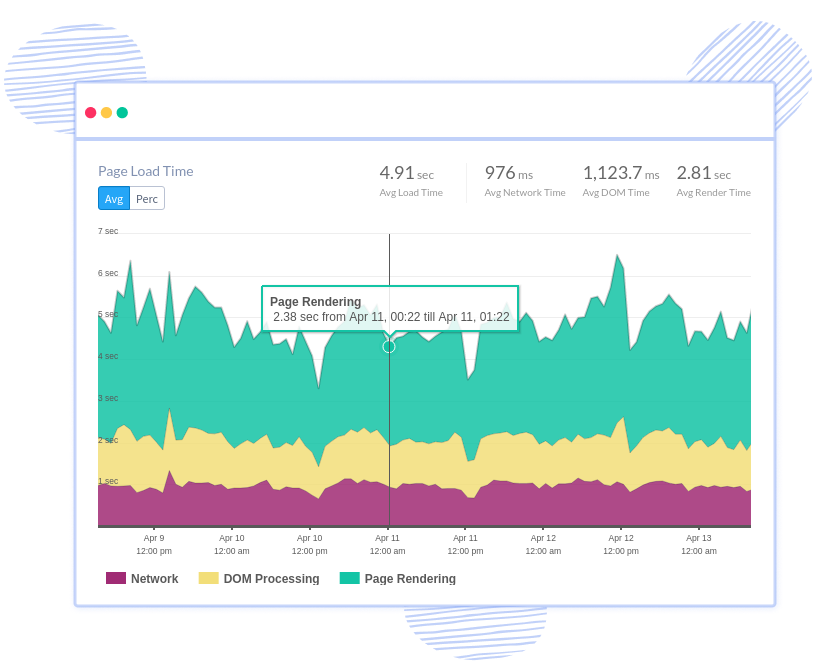
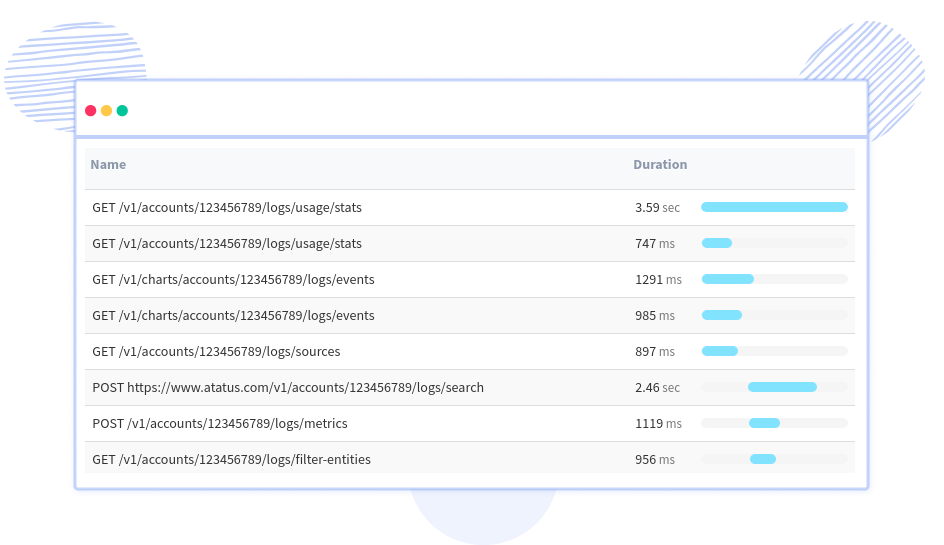
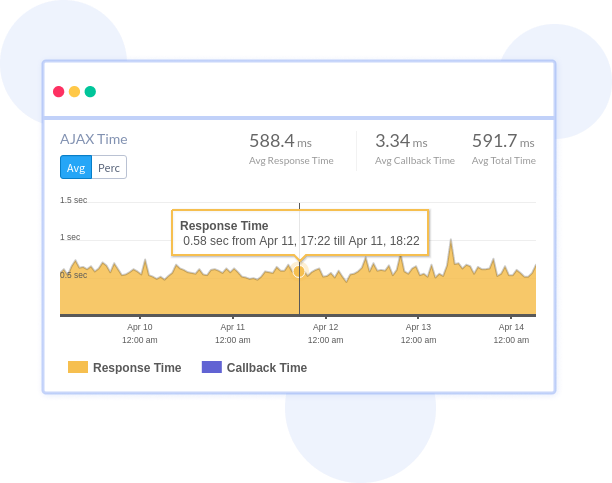
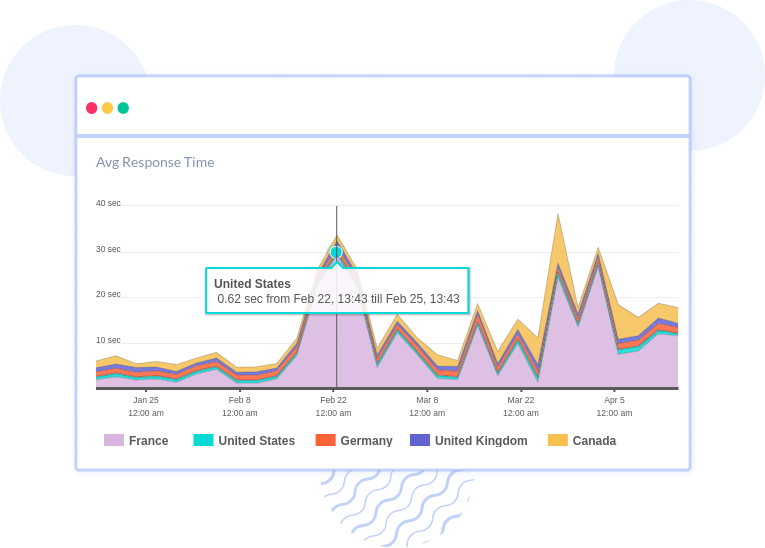
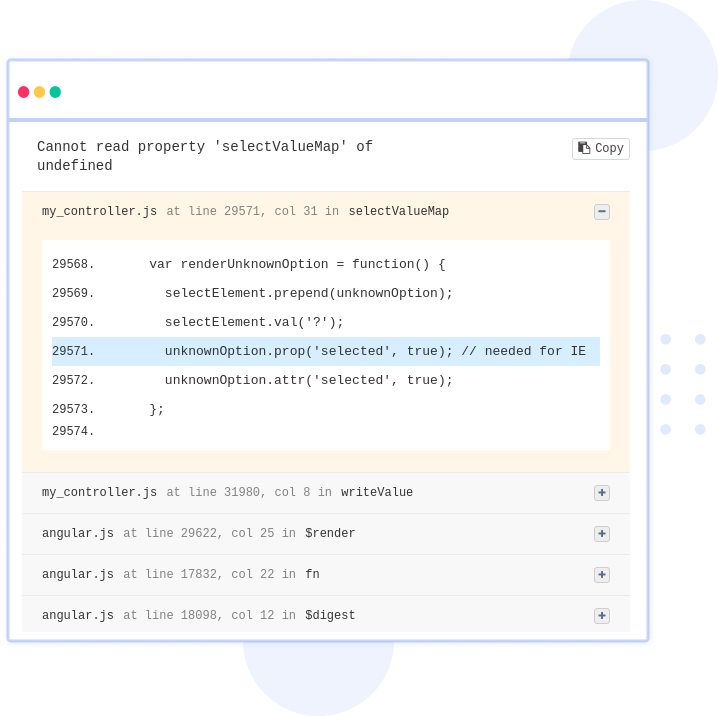
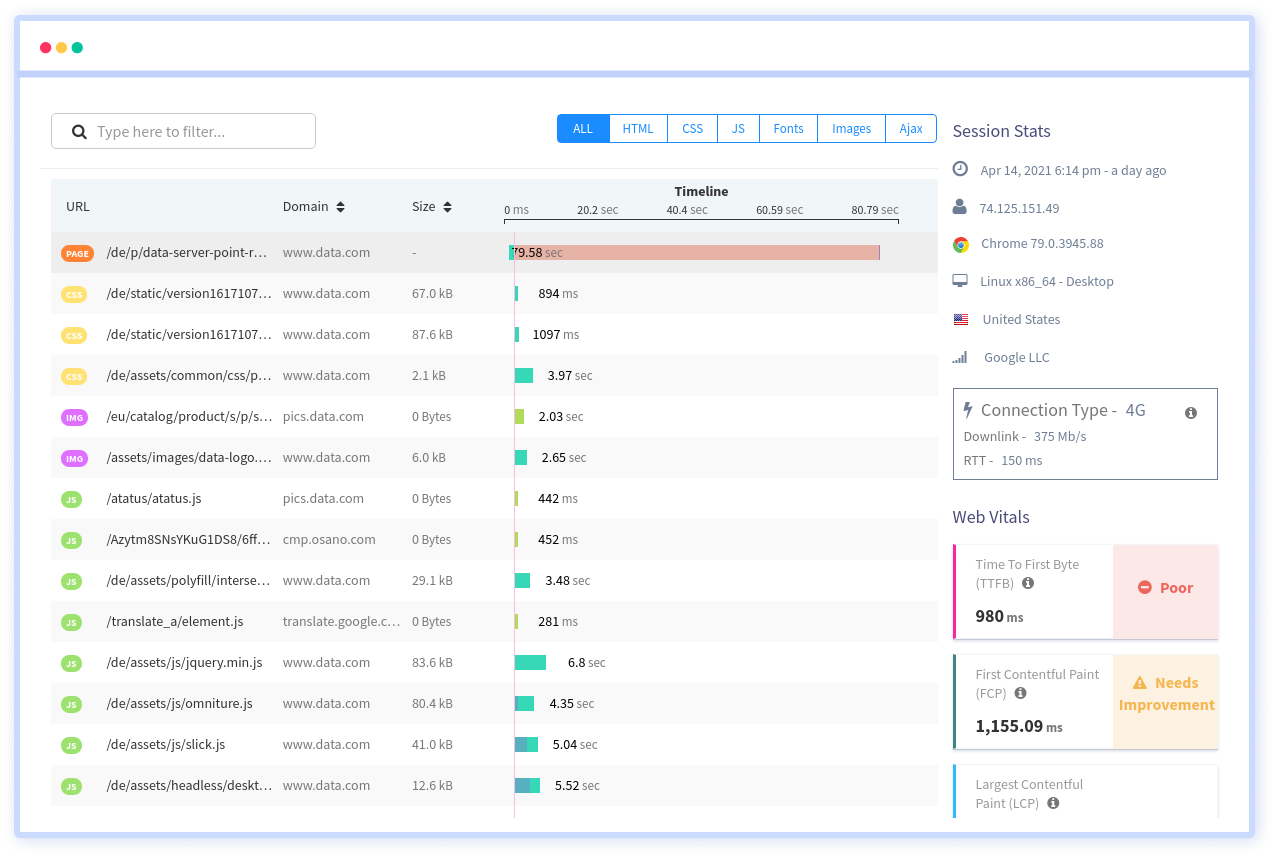
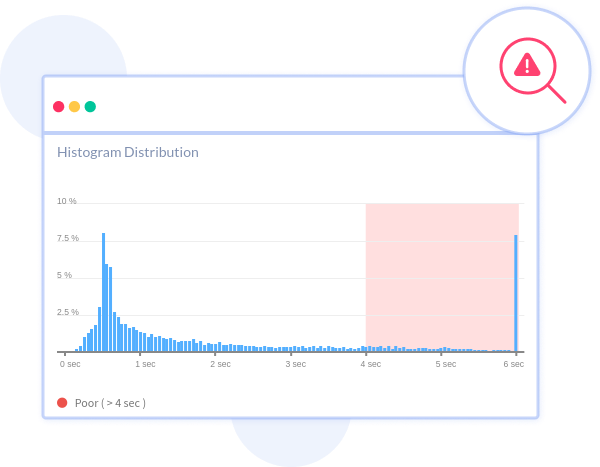
Our solution provides a scalable, end user experience monitoring solution that helps you gain visibility on poor performing parts of your website that are impacting your end users. Understand your front-end performance errors and know how you can improve your user experience.

Start your 14-day free trial. No credit card required.
Real User Monitoring
Web VitalsWeb Vitals

Optimize your user experience quality

We gather critical performance data for Google's Core Web Vitals and Other Web Vitals that helps you understand what’s the cause of the slow performance at the user level if they are having troubling interacting with the page, seeing sudden changes or having slow loading times.

Core metrics

  • First Input Delay (FID)
  • Largest Contentful Paint (LCP)
  • First Contentful Paint (FCP)
  • Interaction to Next Paint (INP)
  • Time to First Byte (TTFB)
  • Cumulative Layout Shift (CLS)
Google Core Web Vitals
Site SpeedSlow Pages

Identify and fix slow frontend performance

Get a complete picture of each page-load event to quickly identify and resolve front-end performance issues impacting real users. Analyze detailed full resource waterfall view to determine which assets are slowing down your pages with filterable data by URL, connection type (2G, 3G, 4G), device, country, and more.

Slow Pages
SPA TimeSPA Route Changes

Get full insight of performance impact in your Single Page App

Have visibility into performance and user actions without page loads. View Single Page Application route changes performance independent of the JavaScript framework, which shows how user interactions are impacting their experience after the page loads.

SPA Route Monitoring
Ajax TimeXHR Performance

See how your app is behaving after user starts loading the page

Find which page views are calling the server side controller with in depth details of response time, callback time, throughput, HTTP failures, data transfer size and more. Understand how these poor performing AJAX calls have an impact on the page load and the user’s digital experience.

XHR Performance

Start resolving frontend performance issues

Try it free. No credit card required. Instant set-up.

Awesome Support

Great product for tracking issues on Production

"We were struggling with site speed on the Production side and it wasn't clear what was causing it. With Atatus we were able to pinpoint exactly what wrong, and after a fix, we saw the speed improvements right away on the performance charts And the installation was so easy. I definitely recommend trying it."

— Ivan S, Engineering Manager, iSavta

Site ExperienceEnd User Experience

See how customers are interacting with your application

Get full insight into the user journey across every user. See what actions the user has done, how JS errors have an impact, visualizing key user journeys and the correlation between performance and traffic.

End User Experience
JavaScript ExceptionsComplete visibility into errors

Quickly identify JavaScript errors that are detrimental to your end-user experience

JavaScript errors can render the entire site unresponsive and impact your complete user journey. It is most crucial that you find JavaScript errors quickly, identify those having the biggest impact on your users and fix them before they have a negative impact on the end user performance.

Error Monitoring
Session TimeReplay Sessions

See how each asset affects your users’ experience

Visually see the completed digital experience for every user including long load times, specific errors, asset performance, web vitals, DNS, SSL connection and more. Session Traces provides the insights that your organization requires to understand user experiences, aligning business and development.

User Sessions
DeploymentMeasure deployments

Quickly see if deployment improves or impacts your users

Add deployment markers to measure how your customers are experiencing the recent code pushed into production. See how your website was performing before and after deployment with the list of page performance, new errors and much more.

Release Tracking

Start fixing issues impacting your users right now

Try it free. No credit card required. Instant set-up.

Awesome Support

Essential tool to monitor your apps and websites

"The user interface is clean, intuitive and easy to use. This is the second project where I used Atatus and it's becoming an essential tool that I recommend to my clients."

— Eduardo D, Founder & CEO, Ace Exhibits

Monitor and improve your website performance

Setup

Two Line Setup

Adding two lines of code gets you started with tracking your frontend performance and errors. Start seeing immediately what are the pain points your users are facing.

Source Maps

Source Maps

Make readable stack traces in your errors by providing source maps. Un-minifying JavaScript lets you view source code in their original form, which helps in debugging minified code from production.

Block Bots & Malicious IPs

Block Bots & Malicious IPs

You can filter Bots, Domains, IPs, User Agents and many other configurations in making sure that you get actionable insights from the real data that affects your customers.

Smart notifications

Smart notifications

Setup alerts to automatically monitor your applications for increase in response time, API failures, or error rate and much more. Get notified through various channels, including Slack, Teams, Email, PagerDuty and more.

Collaborate

Collaborate

Invite your team members and work together to resolve issues. Add comments to the errors, so that your team members who view the errors, get to know what and how the fix was made.

Search data

Slice and Dice data

Get your questions answered. Use custom queries to slice and dice the data by transaction, URL, error, user, browser, host OS and more.

Unlimited websites

Unlimited websites

Track all your websites in one place. Add your production, dev, staging, QA to monitor your websites through the complete software development cycle.

Email digests

Email digests

Don't miss out on your application performance and error stats. Atatus can send you weekly and monthly summaries directly to your inbox.

Ticketing Inetgration

Ticketing Integration

Maintain your workflow with Atatus issues in various Project Management integrations. We support Jira, Asana, BugHerd, GitHub, GitLab, and more.

FAQs about Real User Monitoring

What is Real User Monitoring (RUM)?

Real User Monitoring also known as front-end performance monitoring, end user performance monitoring, browser monitoring and website user experience monitoring. RUM helps you in analyzing the front-end performance issues in your application by keeping track of every interaction by real time users.

Monitor front-end performance to ensure your app is performing up to the contemporary speed standards. Real User Monitoring lets you monitor the user interaction and journey on your website and provides you with in-depth actionable RUM metrics with a detailed report.

What does RUM collect?

Atatus collects RUM metrics such as response time, connection time, server time, first-byte time, page rendering time, network time, page views, user-agent of the browser, geographical location, Google core web vitals and user-session information.

What are Core Web Vitals in front-end monitoring?

The Core Web Vitals are standardized metrics provided by Google that offer developers a better understanding of how web pages are being experienced by users.

User experience issues are identified through Core Web Vitals using metrics for three primary areas:

  1. Performance of page loading
  2. User-friendliness
  3. An individual's perception of visual stability on a page

Why are Core Web Vitals important?

Core Web Vitals helps developers to provide a better user experience to your customers. They provide particular measurable page speed insights to improve the overall user experience on your website. Also, Google ranks your website based on better Core Web Vital scores, so it becomes key to make sure that real users have a better Web Vitals for ranking higher up in SERP.

What are the three new metrics that Google core web vitals offer?

Google added three new metrics to the page experience signal:

  1. Largest Contentful Paint (LCP)
  2. First Input Delay (FID)
  3. Cumulative Layout Shift (CLS)
How do I improve my LCP/CLS/FID score?

You can learn how to improve your Core Web Vitals metrics on our blog Core Web Vitals - New Metrics for User Experience.

How do I set up RUM with Atatus?

By incorporating a simple 2 line JavaScript snippet into your application, you can identify all performance bottlenecks within minutes. With RUM, you get a comprehensive view of not just the performance, but also JS Errors, Custom Time Measurements, User, Geo Performance etc.

How much does Atatus charge for real-time monitoring?

The pricing plans offered by Atatus are quite reasonable. To find out more about the pricing plans for Real User Monitoring, please visit our pricing page.

You're in good company.

You don't have to trust our word. Hear what our customers say!

Atatus is a great product with great support. Super easy to integrate, it automatically hooks into everything. The support team and dev team were also very helpful in fixing a bug and updating the docs.
Tobias
Tobias L
Full Stack Engineer, ClearVoyage
Atatus is powerful, flexible, scalable, and has assisted countless times to identify issues in record time. With user identification, insight into XHR requests to name a few it is the monitoring tool we choose for our SPAs.
Jan Paul
Jan-Paul B
Chief Executive Officer, iSavta
Atatus continues to deliver useful features based on customer feedback. Atatus support team has been responsive and gave visibility into their timeline of requested features.
Daniel
Daniel G
Software Engineer, MYND Management

Ready to see actionable data?

Avail Atatus features for 14 days free-trial. No credit card required. Instant set-up.