May 2024
Distributed Tracing Support - Java
A distributed trace for a Java application tracks the flow of requests across multiple services and components, providing end-to-end visibility into how a request is processed. It captures detailed timing information, errors, and resource usage at each step, helping to identify performance bottlenecks, dependencies, and failures. Distributed tracing is crucial for debugging, optimizing, and understanding the behavior of complex, microservices-based Java applications.

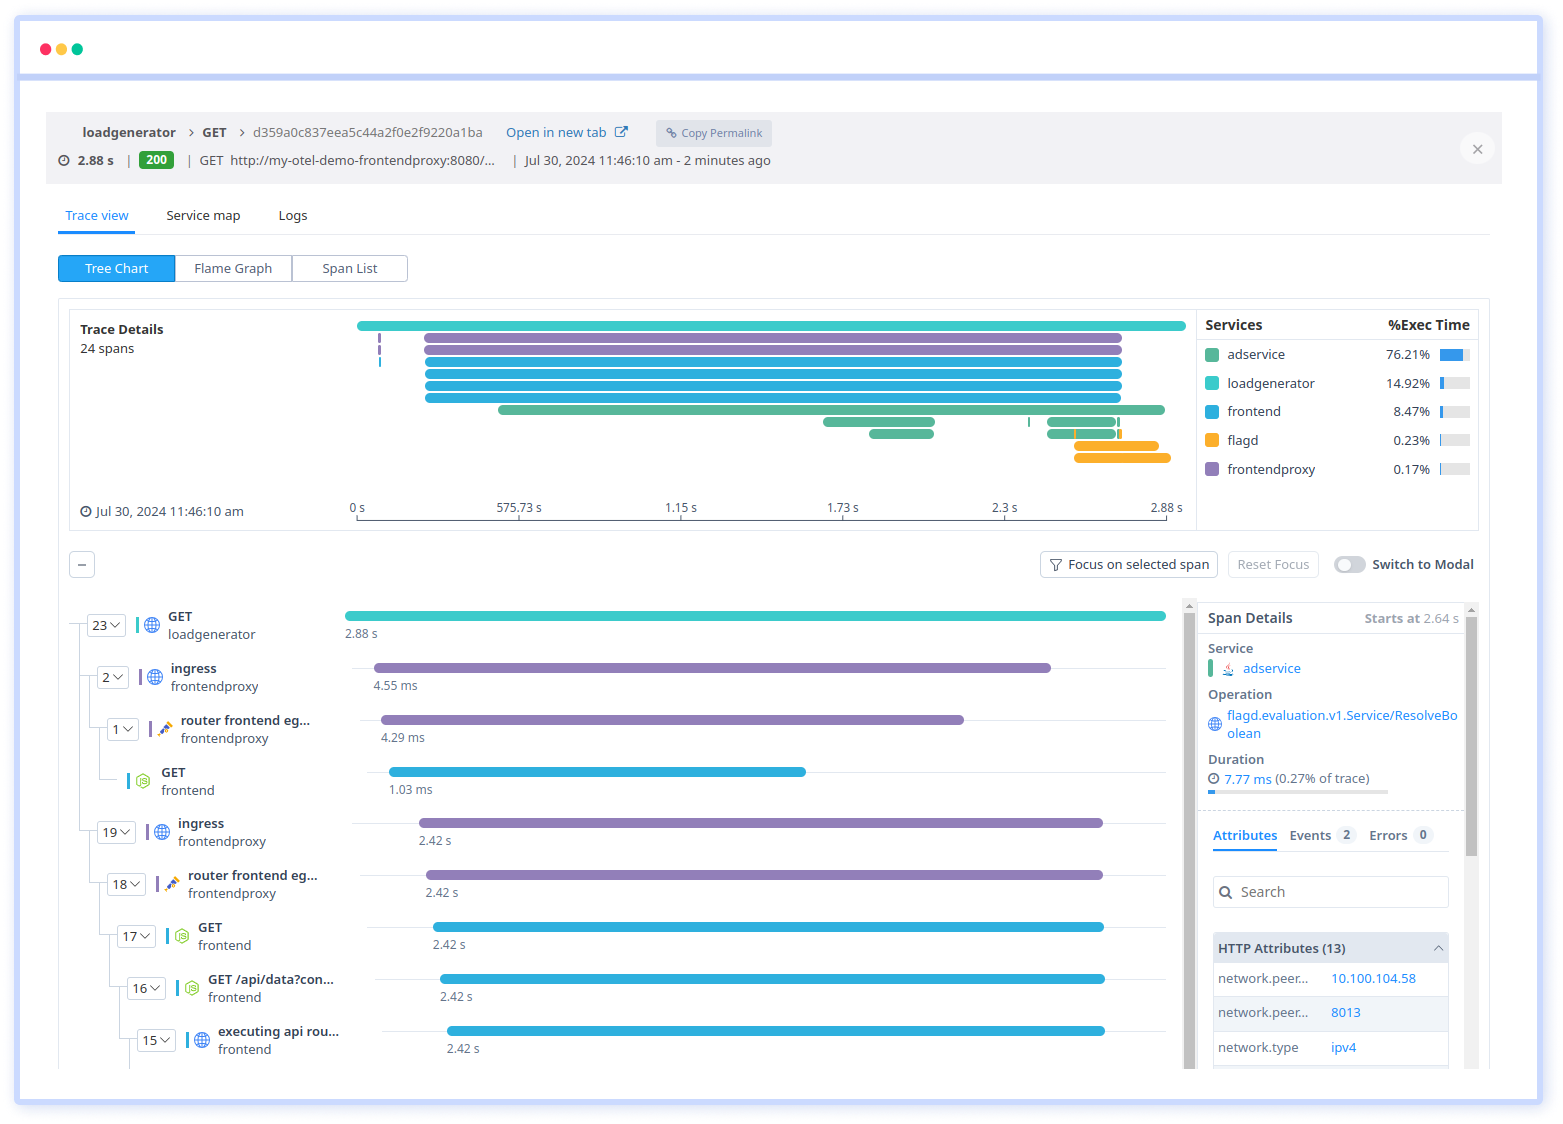
Atatus provides distributed tracing for Java applications by capturing and visualizing traces across services. It integrates with popular Java frameworks and libraries, automatically collecting trace data, including span duration, errors, and tags. This data helps in identifying performance bottlenecks and tracing the flow of requests through the system, providing valuable insights for troubleshooting and optimization.
Key Features:
- Distributed Tracing: Ability to trace requests across microservices and components, providing end-to-end visibility of transactions.
- Metrics Collection: Provides a Collection of key metrics such as response times, error rates, and throughput.
- Trace Visualization: Analyze trace data with different types of charts, such as tree charts, frame graphs, and span lists.
- Sampling and Rate Limiting: Configurable sampling strategies and rate limiting to manage data volume and focus on critical transactions.
- Error and Exception Tracking: Detailed tracking of errors and exceptions within traces, with stack traces and contextual information.
- Support for Distributed Systems: Compatibility with cloud-native environments, containerized applications, and service meshes.
- Filteration: Add custom tags and annotations to traces for better filtering and analysis.

 +1-415-800-4104


