K8s Observability

Kubernetes Monitoring

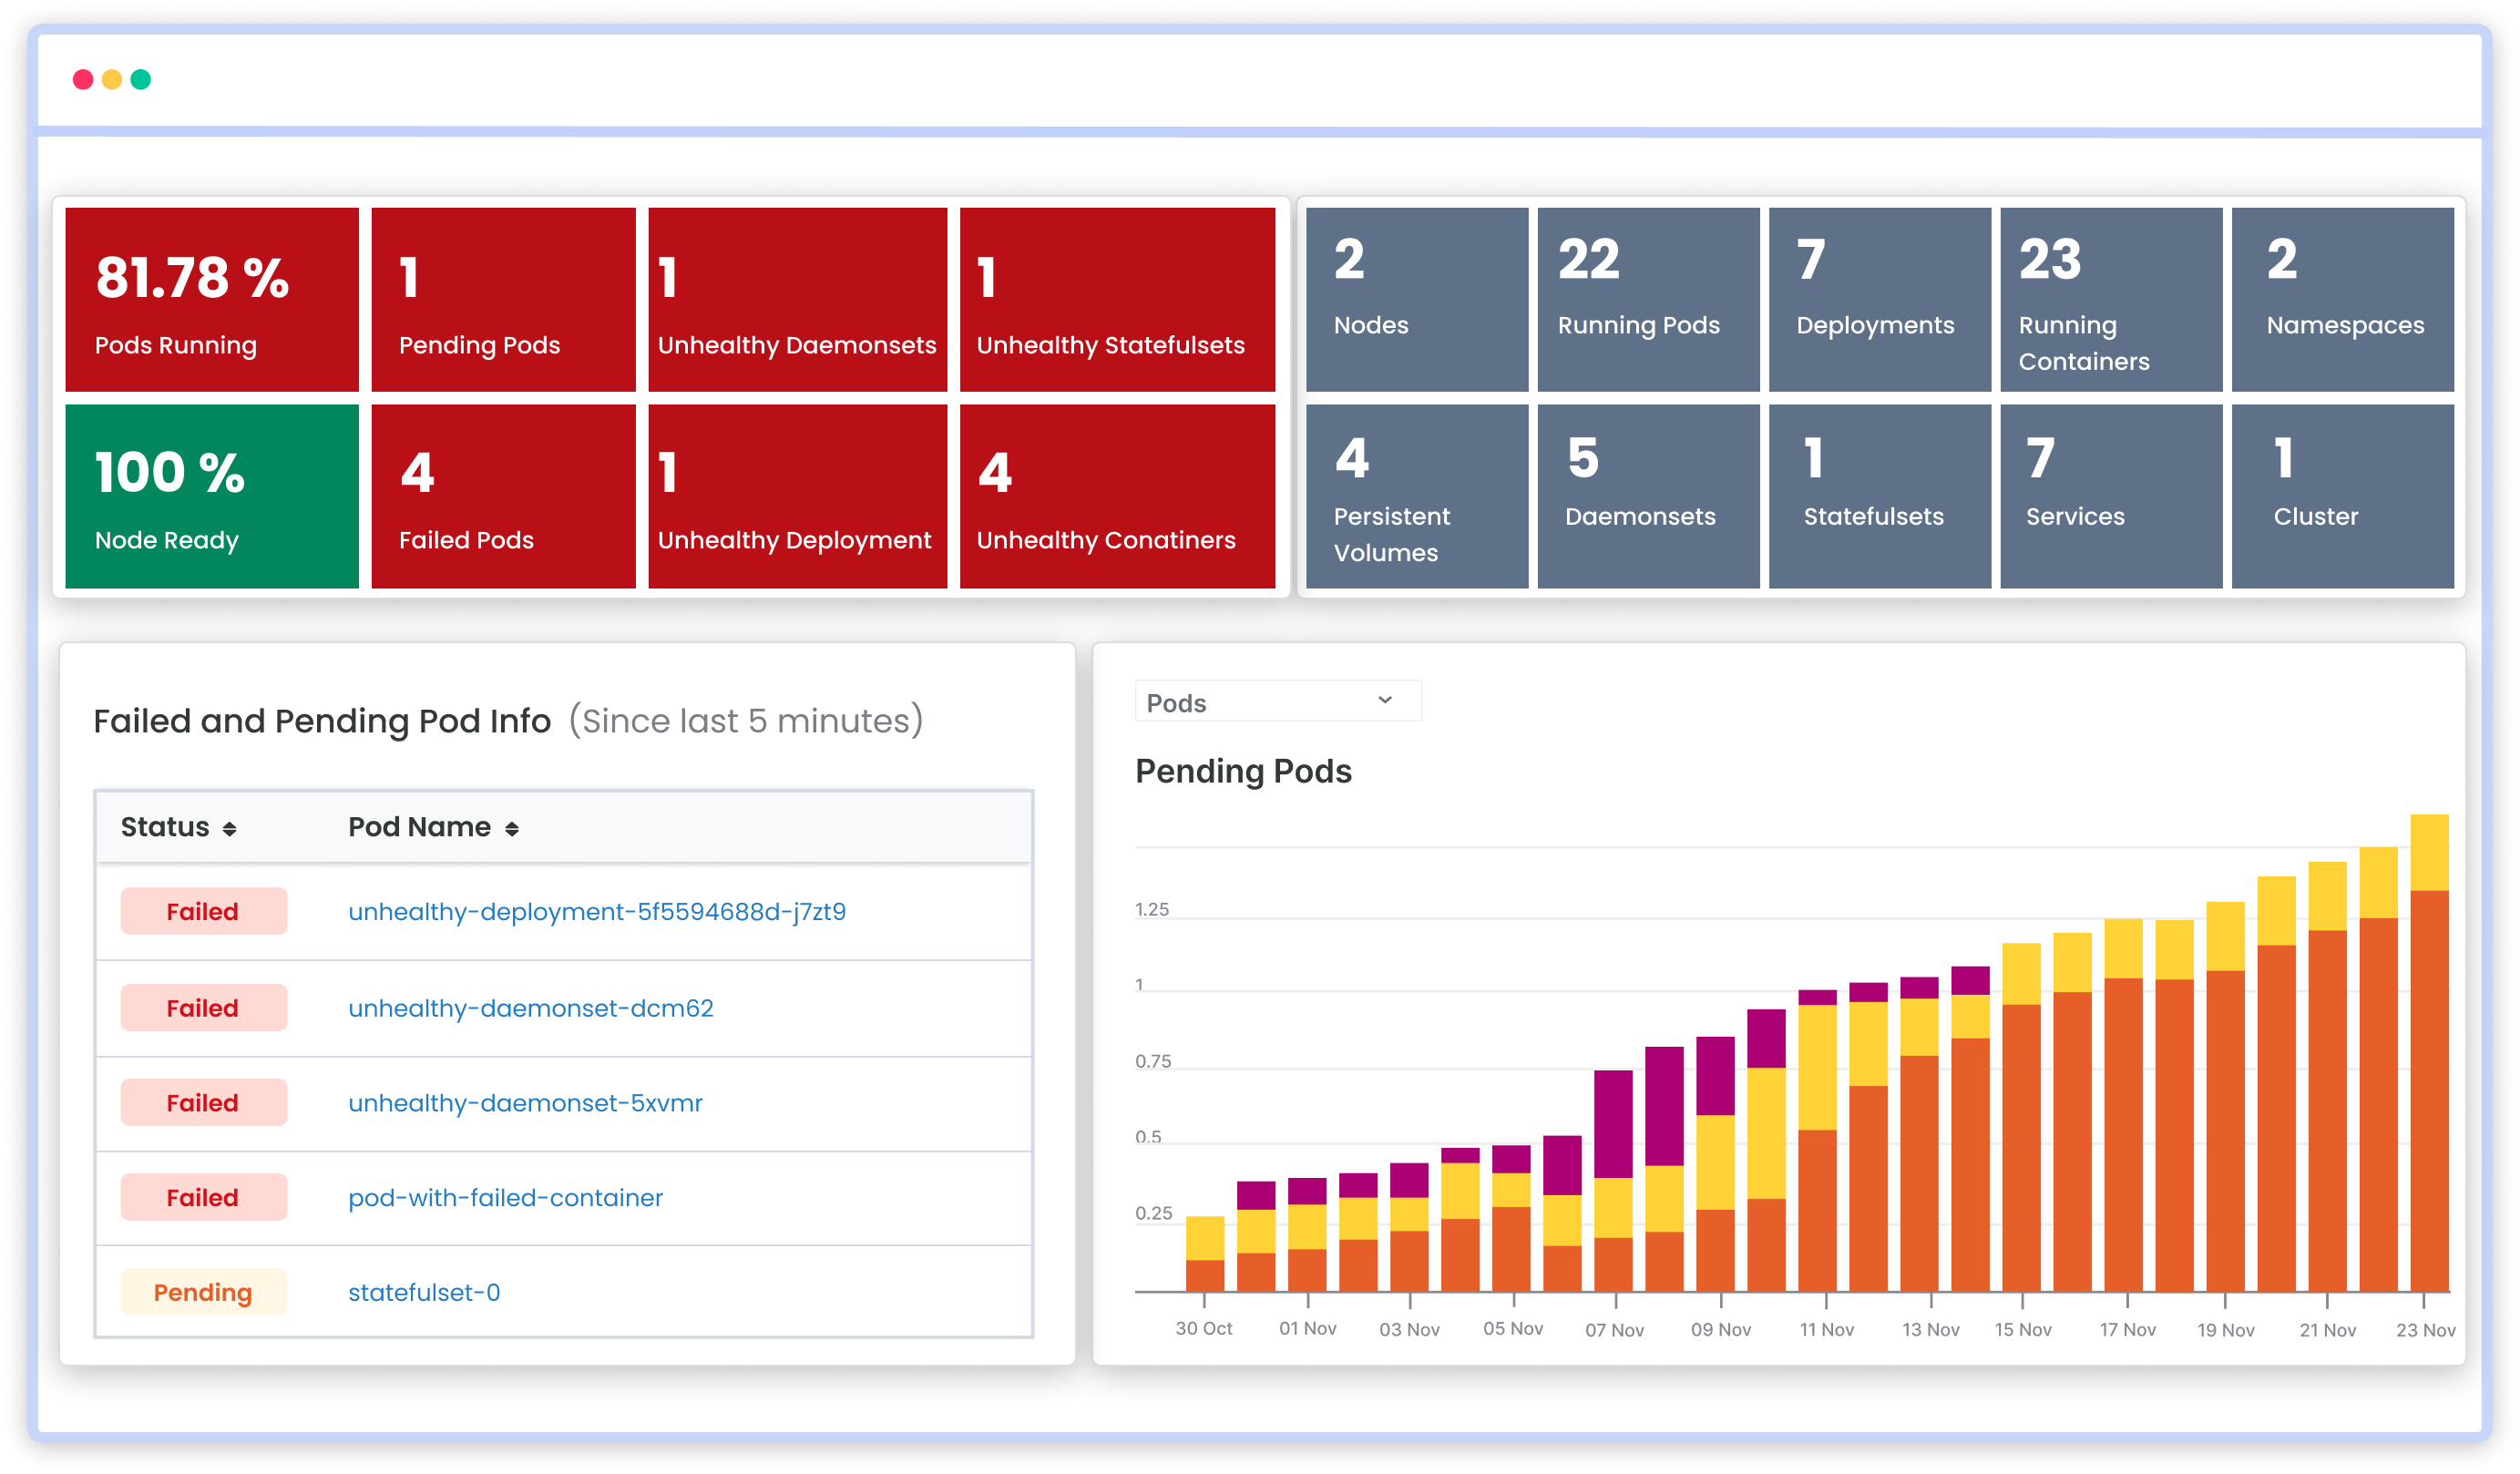
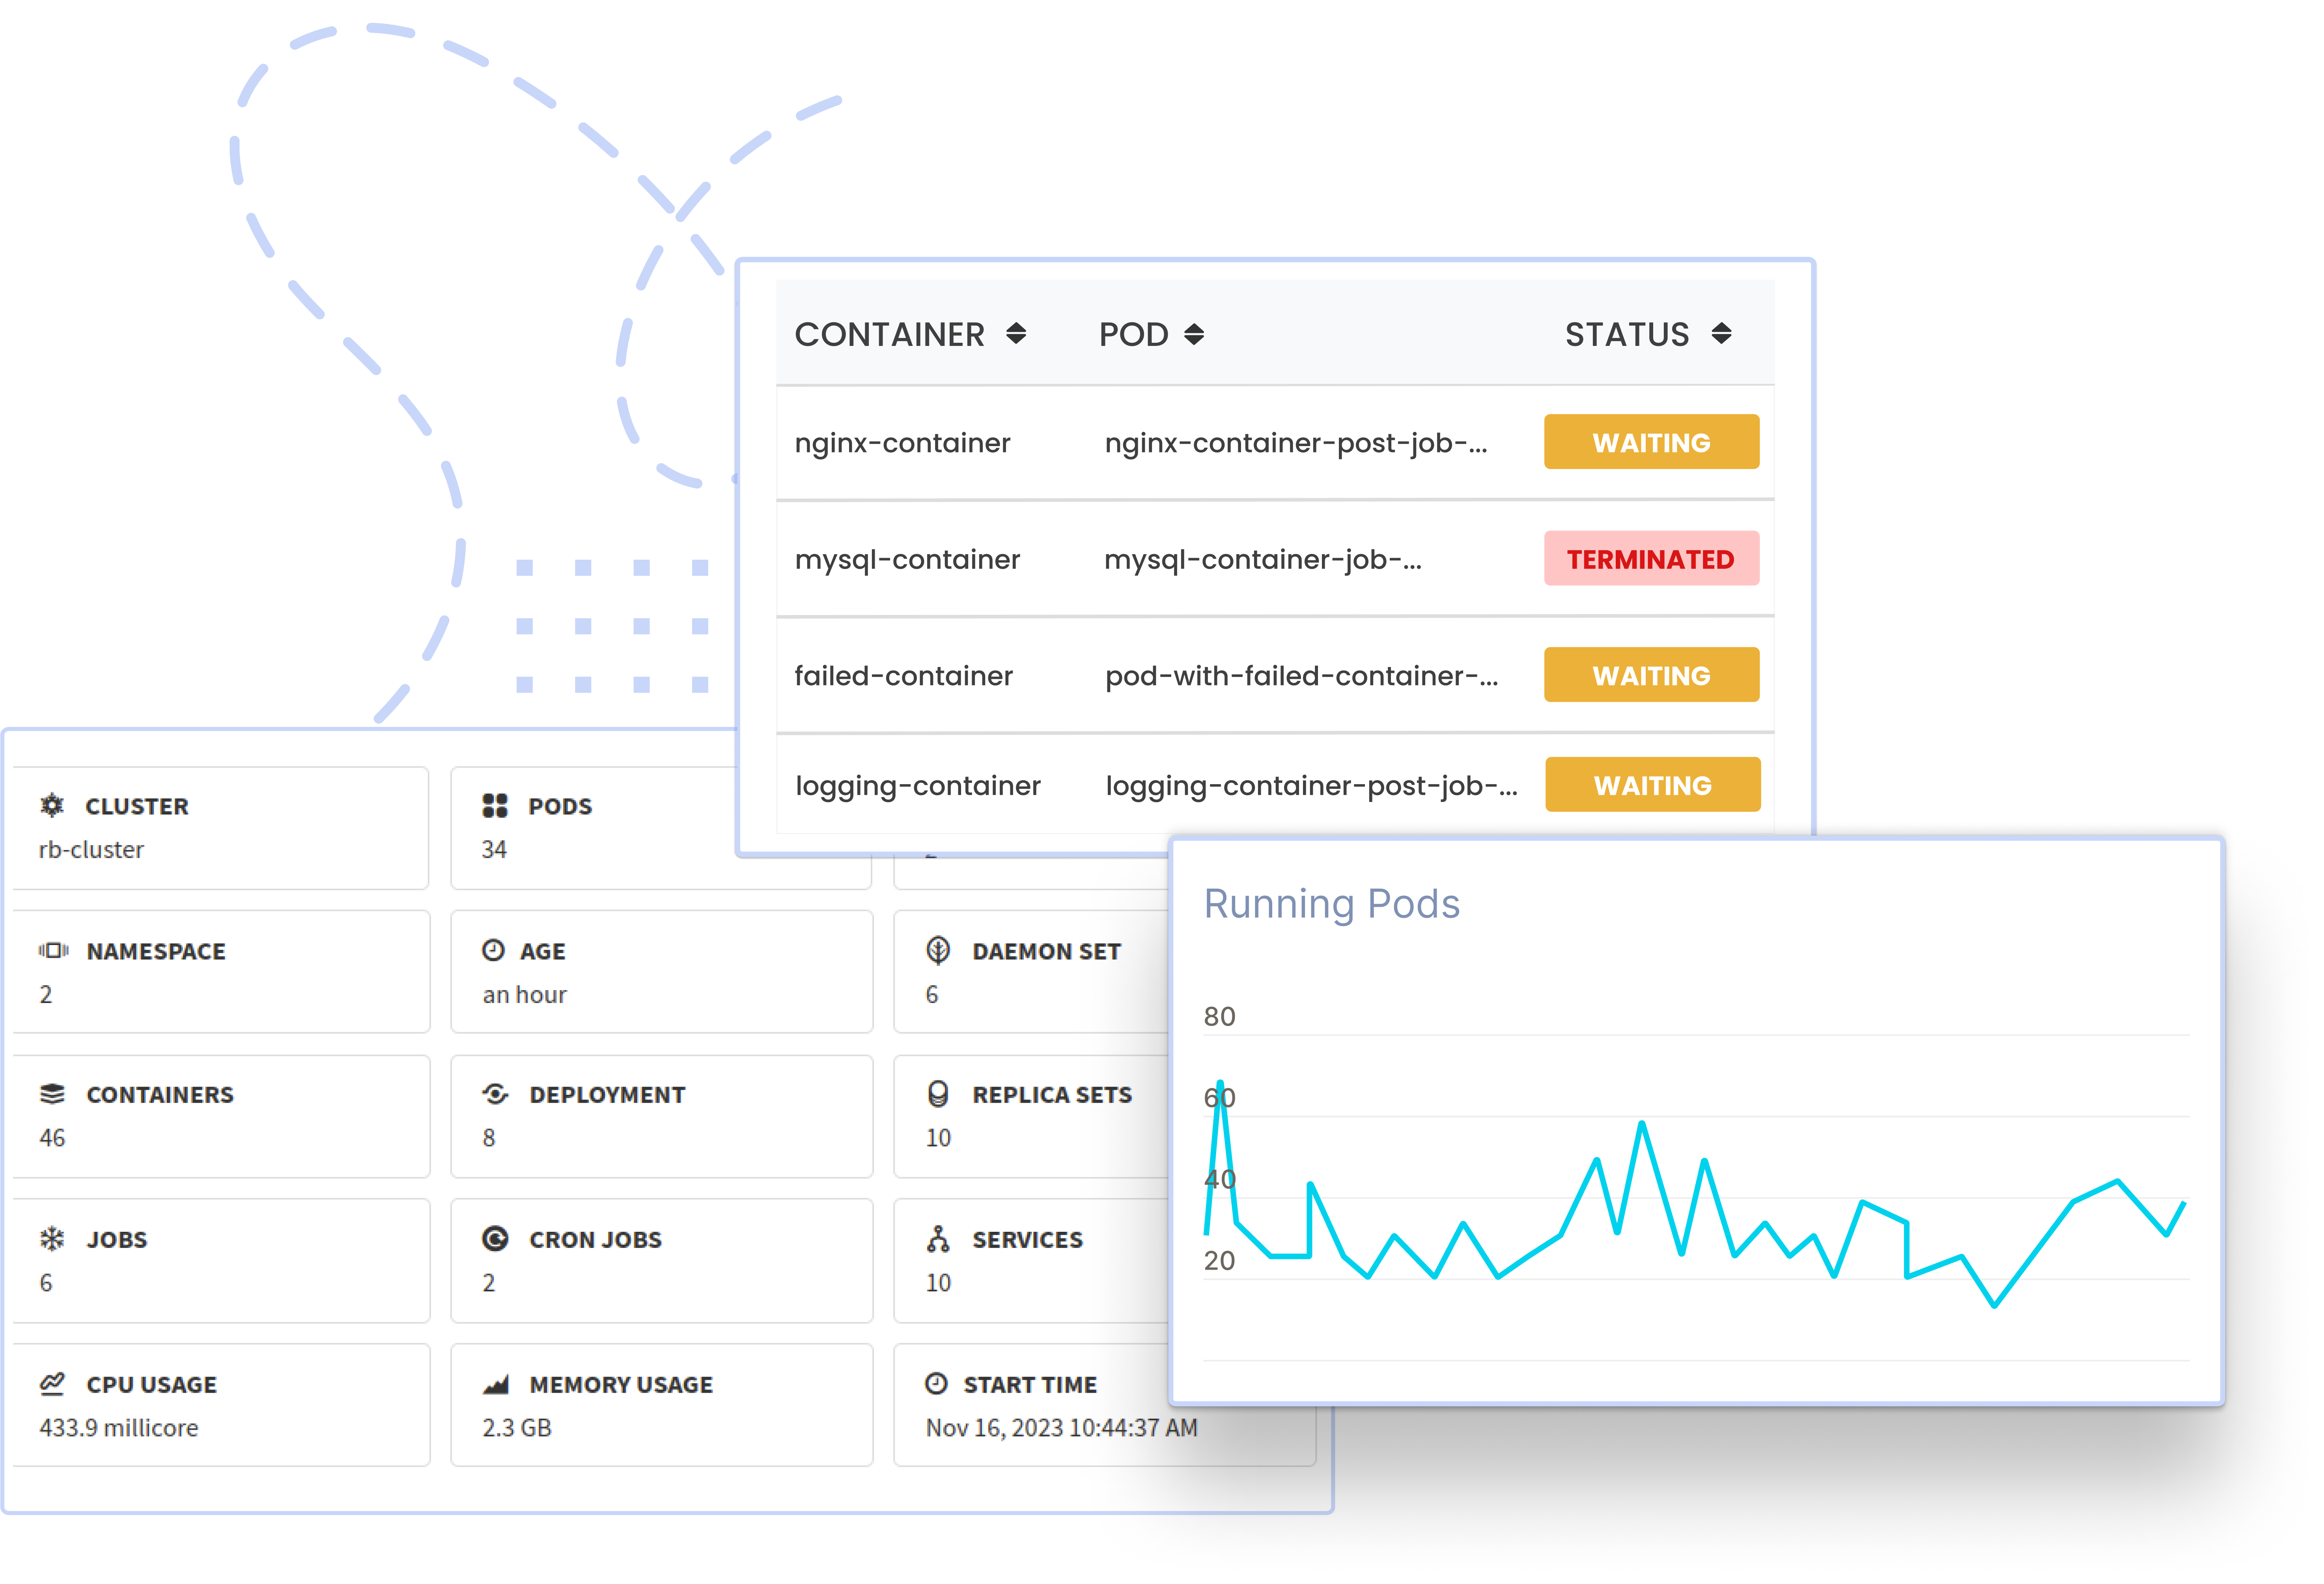
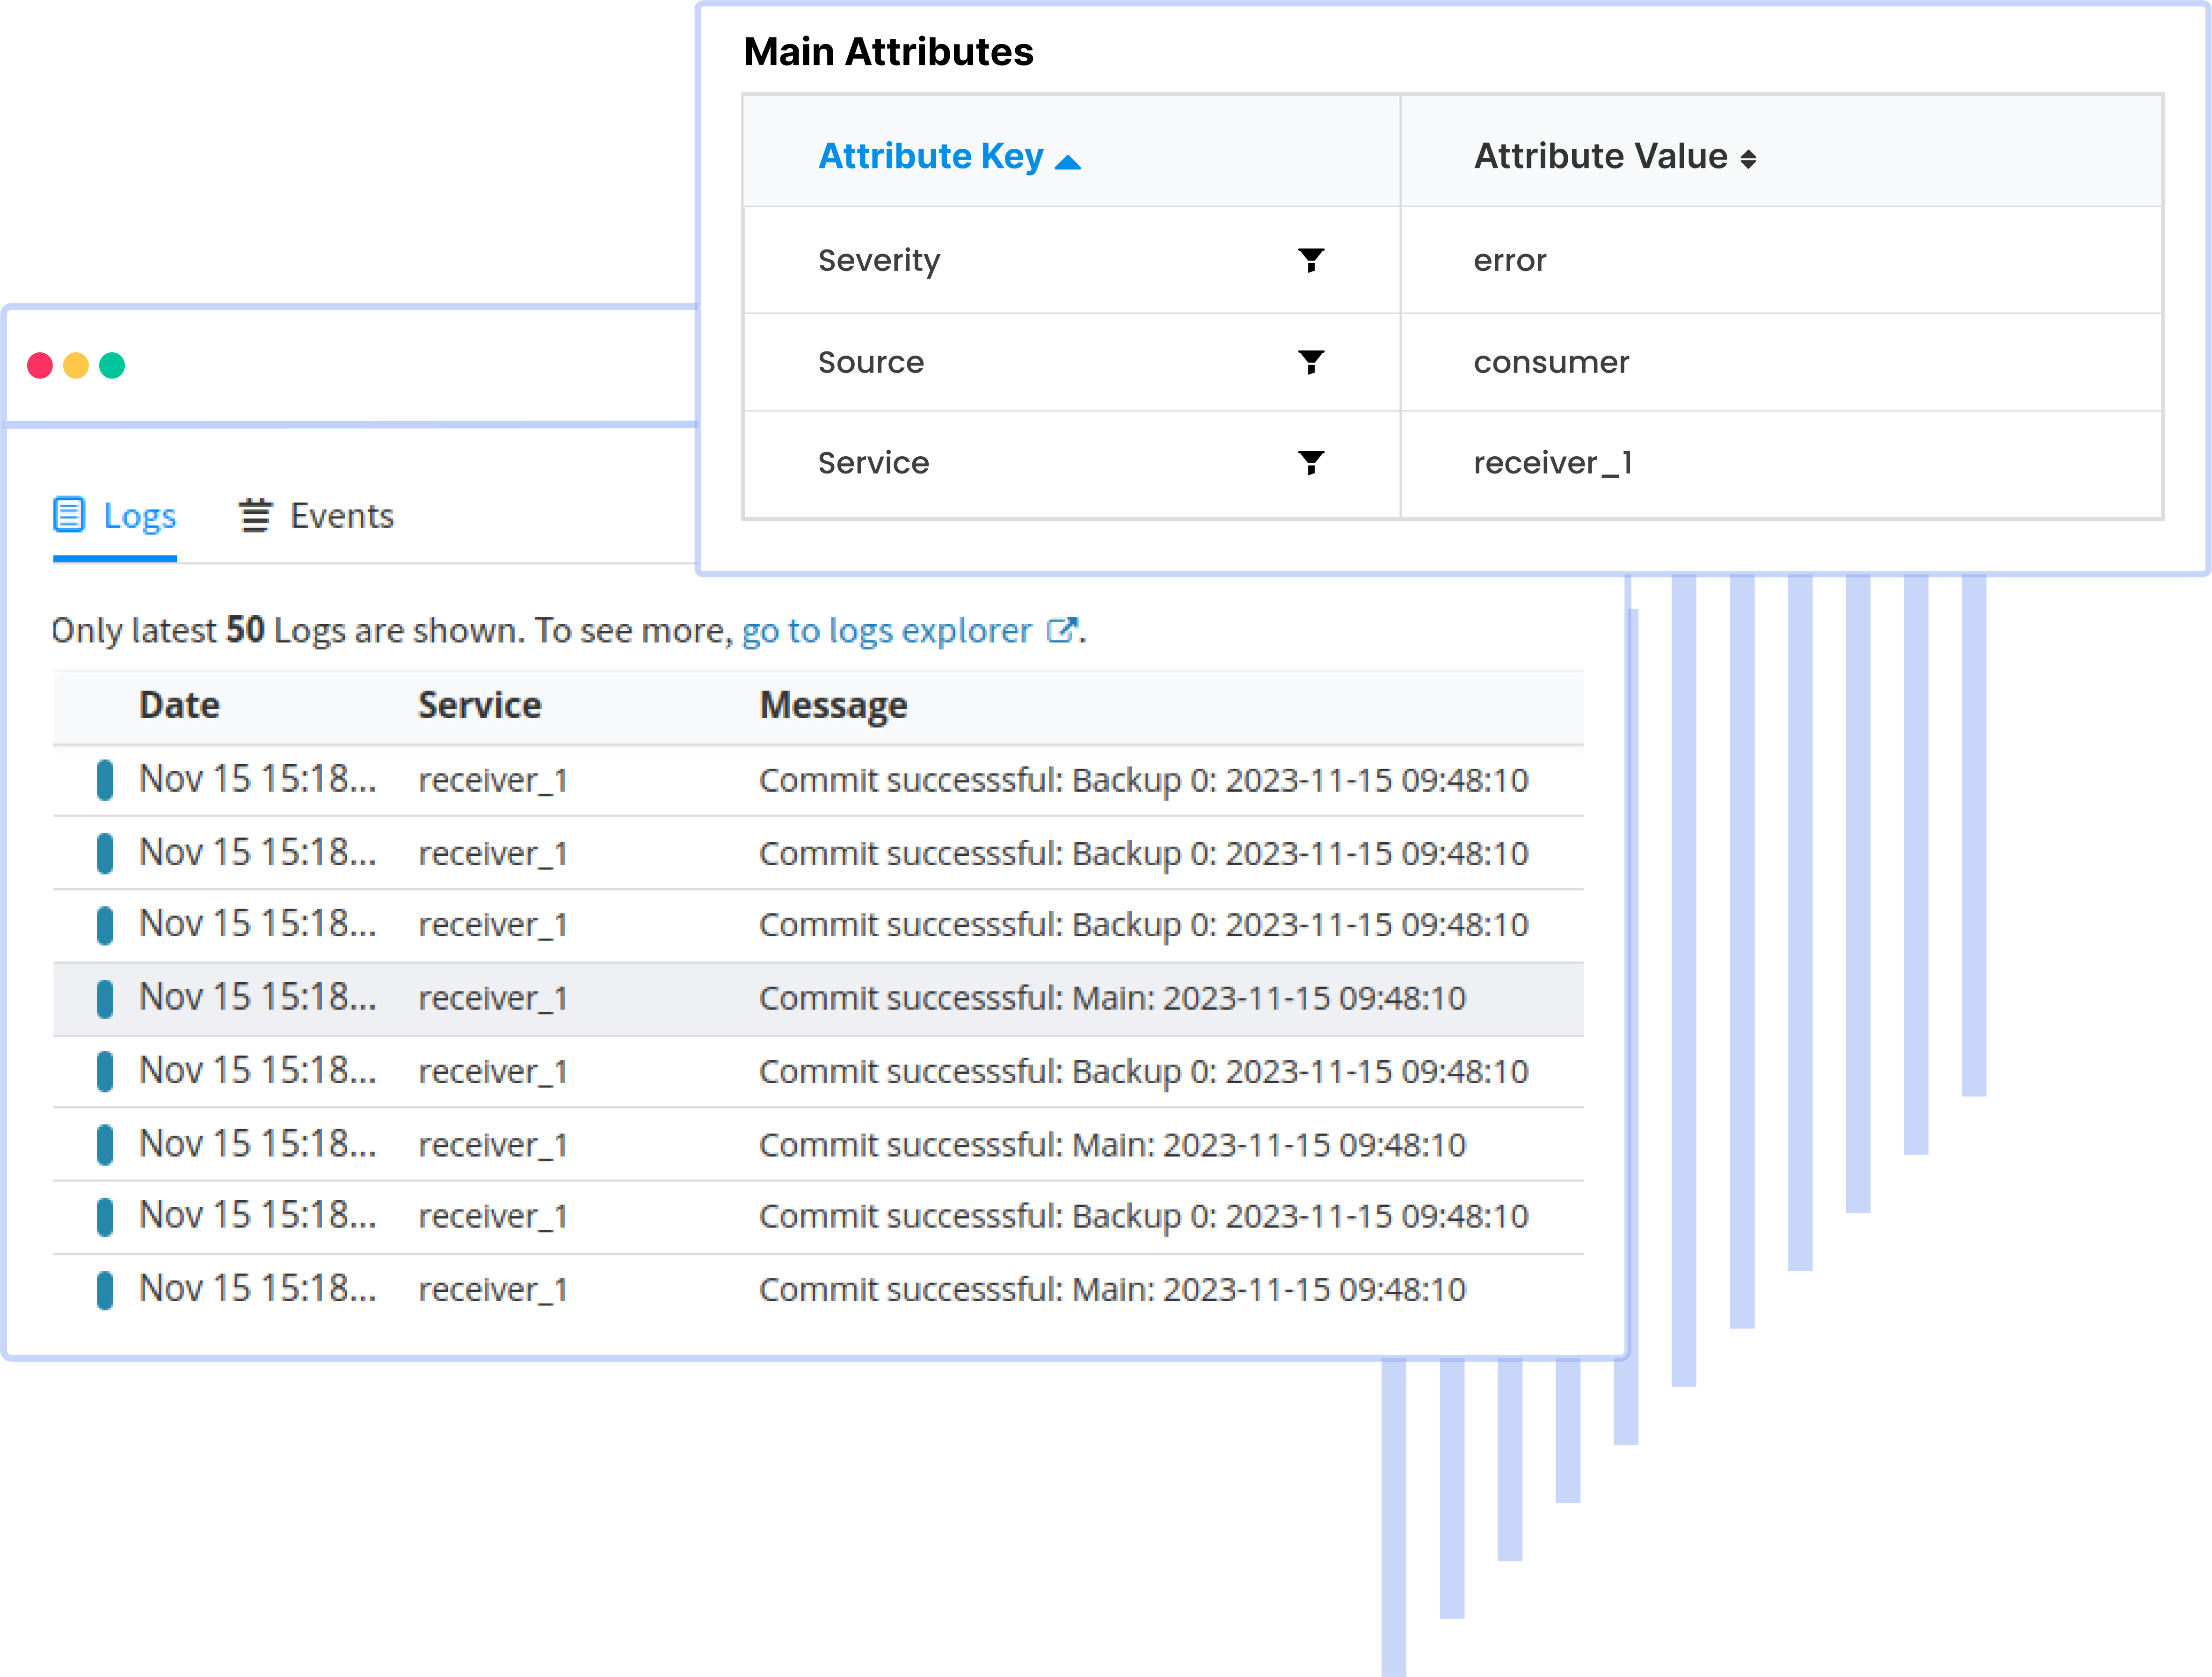
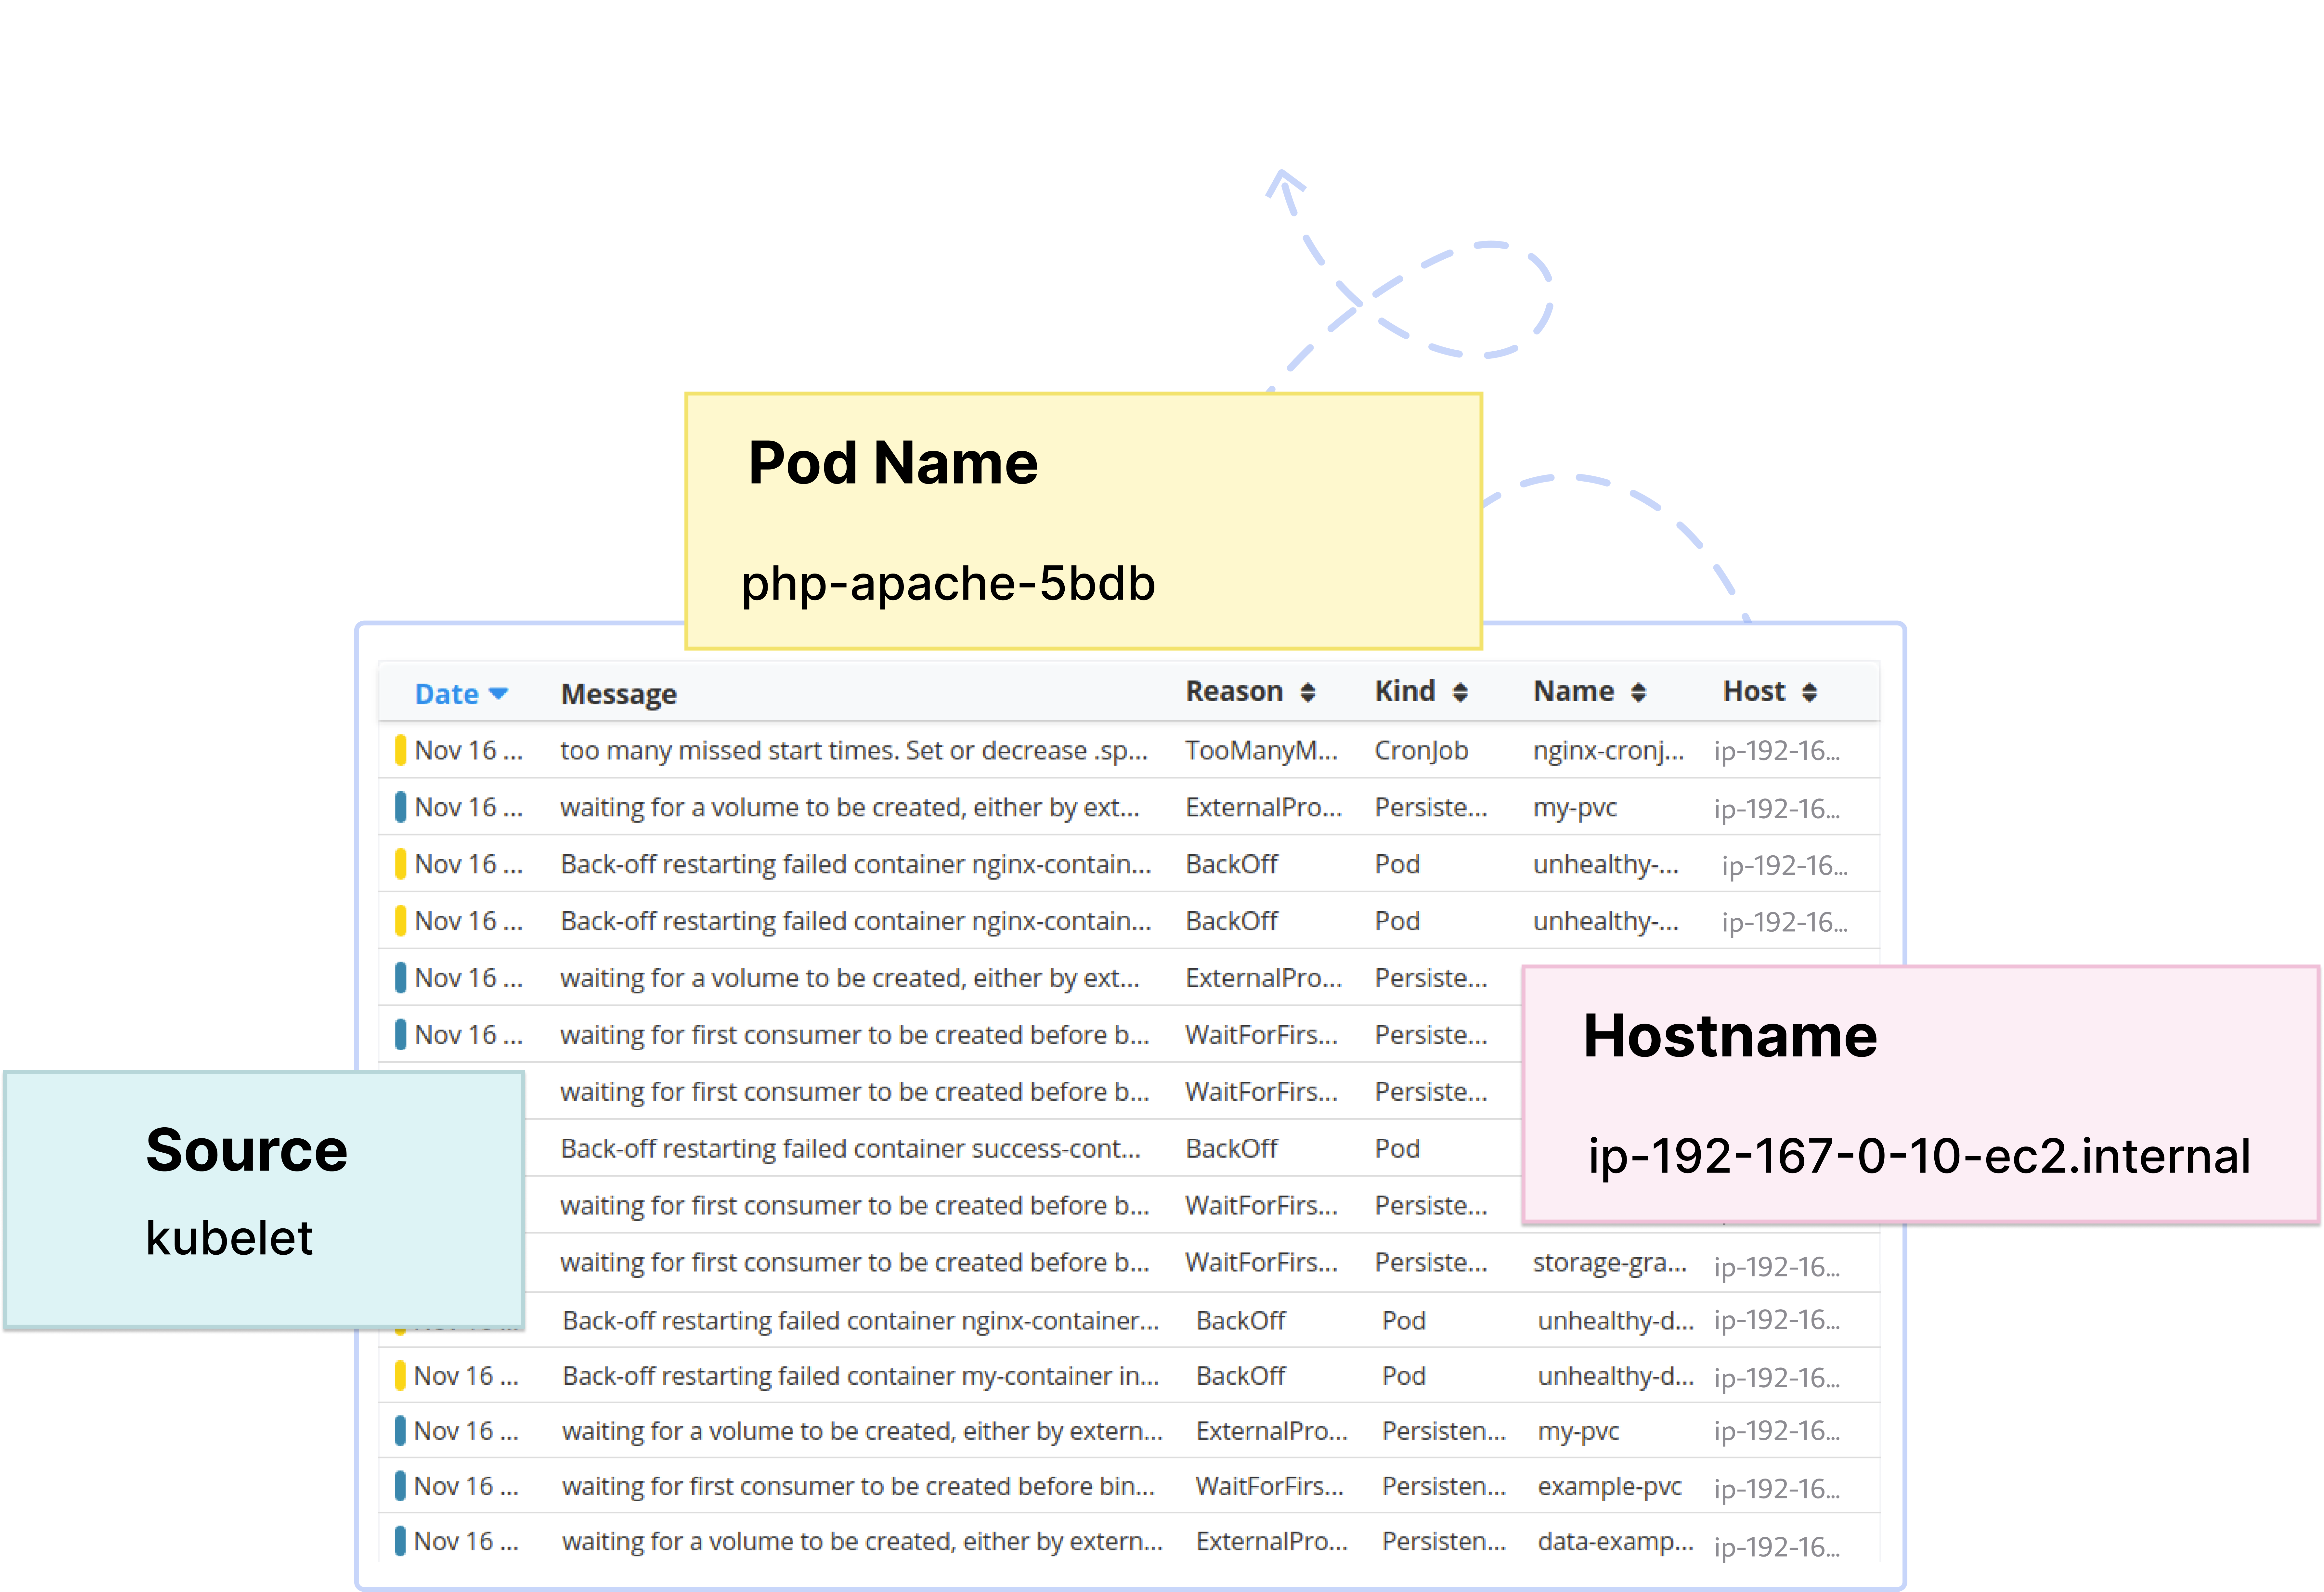
Gain comprehensive insights into your Kubernetes cluster, highlighting strategies to optimize resource utilization across workloads, leading to improved management and efficiency of your Kubernetes setup.

Try Atatus Kubernetes Monitoring with 14-day free trial.
Kubernetes Monitoring Dashboard
Kubernetes Cluster MonitoringCluster Monitoring

Monitor Kubernetes Cluster Health

Evaluate the availability and health of nodes within the cluster, enabling administrators to assess the need for cloud resources effectively. We offer valuable insights into the efficiency of each node by measuring resource utilization—such as memory, CPU, and disk usage. Scale your clusters appropriately, whether by reducing node size for cost efficiency or increasing resources to meet growing demands.

Cluster Metrics

  • Cluster Health
  • Workload Status
  • Resource Utilization
  • Logs & Events
Kubernetes Cluster Monitoring
Pods and Containers MonitoringPods and Containers

Granular K8s Pod and Container Metrics

Assess the readiness of pods or containers to handle traffic, efficiently monitor resource usage at both the individual container and pod levels, and understand the factors contributing to specific container or pod restarts inside your Kubernetes environment.

Pods Metrics

  • Pod Health
  • Container Status
  • Resource Consumption
  • Traces & Events
Pods and Containers Monitoring
Kubernetes Logs MonitoringLog Analysis

Analyzing Log Data from Containers and Pods

Effortlessly consolidate all your logs in one centralized platform for a comprehensive view of your Kubernetes performance. Our integrated solution combines application, database, network, and system logs, offering profound insights into app behavior, db activities, network communications, and system health.

K8s Logs Metrics

  • Application Logs
  • Database Logs
  • Network Logs
  • System Logs
Kubernetes Logs Monitoring
Kubernetes Events MonitoringKubernetes Events

Centralized Visualization of K8s Events

Gain real-time visibility into your cluster's activities, enabling you to promptly identify issues like why a specific pod failed to start or a node became unreachable. You can easily filter events by specifying a particular pod name, node name, or event type (e.g., Warning or Error) to narrow your search and focus on the relevant events. By sorting events based on severity or timestamp, you can quickly pinpoint critical problems that require immediate attention.

Kubernetes Events Metrics

  • Event Source
  • Event Message
  • Event Reason
  • Workload Names
Kubernetes Events Monitoring
Kubernetes Session TracesTraces

APM-driven Kubernetes Session Traces

Trace multiple microservices across distributed Kubernetes clusters, running on different nodes or pods. Investigate how requests are processed, identify potential bottlenecks, and follow the lifecycle of each customer-generated event. Uncover dependencies and interactions between different Kubernetes services to optimize resource allocation for improved overall system performance.

Kubernetes Session Traces

One Platform, Endless Kubernetes Insights

Kubernetes Cluster Monitoring

Enhance Cluster Stability

Ensure and optimize robust cluster health, promoting reliable performance while minimizing disruptions in Kubernetes nodes.

Kubernetes Resource Utilization

Cut Costs Effectively

Visualize spending and gain insights for informed decisions on resource allocation, scaling, and tech investments, reducing overall costs.

Predefined Kubernetes Views

Preconfigured Views

Navigate predefined Kubernetes dashboards to efficiently explore correlated metrics and performance data for specific pods or services.

Kubernetes Event logging

K8s Event Logging

Capture & log Kubernetes events to spot issues, changes, or potential risks. Integrate with logs for correlating events with performance metrics.

Alert

Instant Notifications

Receive immediate alerts for critical events, such as pod failures, resource exhaustion, or abnormal cluster behavior with detailed reports.

Support

Training & Support

Get fast, 1-on-1 support and training. With live in-app chat and a dedicated customer support team, we are here to help with anything.

FAQs on Kubernetes Monitoring

What is Kubernetes monitoring, and why is it important?

Kubernetes monitoring involves tracking the performance and health of your Kubernetes clusters and applications running on them. It is crucial for identifying and resolving issues, optimizing resource usage, and ensuring the overall reliability of your containerized environment.

What metrics does Atatus capture for Kubernetes monitoring?

Below is a list of metrics that Atatus typically captures for Kubernetes monitoring:

  1. CPU & Memory Usage:
    • Node-level CPU & Memory usage
    • Container-level CPU & Memory usage
  2. Pod and Container Health:
    • Number of running pods
    • Container restart count
    • Pod status (Running, Pending, Failed, etc.)
  3. Cluster Resource Utilization:
    • Overall cluster CPU utilization
    • Overall cluster Memory utilization
  4. Storage Metrics:
    • Disk I/O metrics for persistent volumes
    • Storage capacity and usage
  5. Node Metrics:
    • Node health and status
    • Node capacity and availability
How can I set up Kubernetes monitoring with Atatus?

Setting up Kubernetes monitoring with Atatus involves deploying the Atatus Agent as a DaemonSet in your Kubernetes cluster. Additionally, you can use the Atatus Helm chart for easier installation and configuration.

Can Atatus monitor multiple Kubernetes clusters?

Yes, Atatus supports monitoring multiple Kubernetes clusters. You can configure and manage multiple clusters from a single Atatus account, allowing you to centralize monitoring and gain a holistic view of your entire Kubernetes environment.

How does Atatus handle Kubernetes logs and traces?

Atatus integrates with Kubernetes to collect logs and traces. The Atatus Agent can collect logs from your containers and Kubernetes components, providing centralized log management. Atatus offers distributes tracing, allowing you to correlate traces with APM metrics, providing detailed insights into individual Kubernetes requests.

Does Atatus provide alerting for Kubernetes?

Yes, Atatus offers alerting capabilities that allow you to set up custom alerts based on predefined thresholds or anomalies in your Kubernetes metrics. You can receive notifications via various channels such as email, Slack, PagerDuty, and more.

How long is my Kubernetes data available?

Data retention for Kubernetes monitoring is set to 7 days by default. This can be changed in your billing settings to 60 or 90 days. Contact a Customer Success Representative if you require a longer retention period.

You're in good company.

You don't have to trust our word. Hear what our customers say!

Atatus is a great product with great support. Super easy to integrate, it automatically hooks into everything. The support team and dev team were also very helpful in fixing a bug and updating the docs.
Tobias
Tobias L
Full Stack Engineer, ClearVoyage
Atatus is powerful, flexible, scalable, and has assisted countless times to identify issues in record time. With user identification, insight into XHR requests to name a few it is the monitoring tool we choose for our SPAs.
Jan Paul
Jan-Paul B
Chief Executive Officer, iSavta
Atatus continues to deliver useful features based on customer feedback. Atatus support team has been responsive and gave visibility into their timeline of requested features.
Daniel
Daniel G
Software Engineer, MYND Management

Trusted Protection through Global Compliance

Feel assured as we maintain rigorous security protocols, ensuring the safety of your data with every interaction

Soc 2 Type 2 Compliant
ISO 27001 Certified
ISO 27001 Certified
GDPR & CCPA Compliant

Ready to see actionable data?

Avail Atatus features for 14 days free-trial. No credit card required. Instant set-up.