Stand out with API Analytics

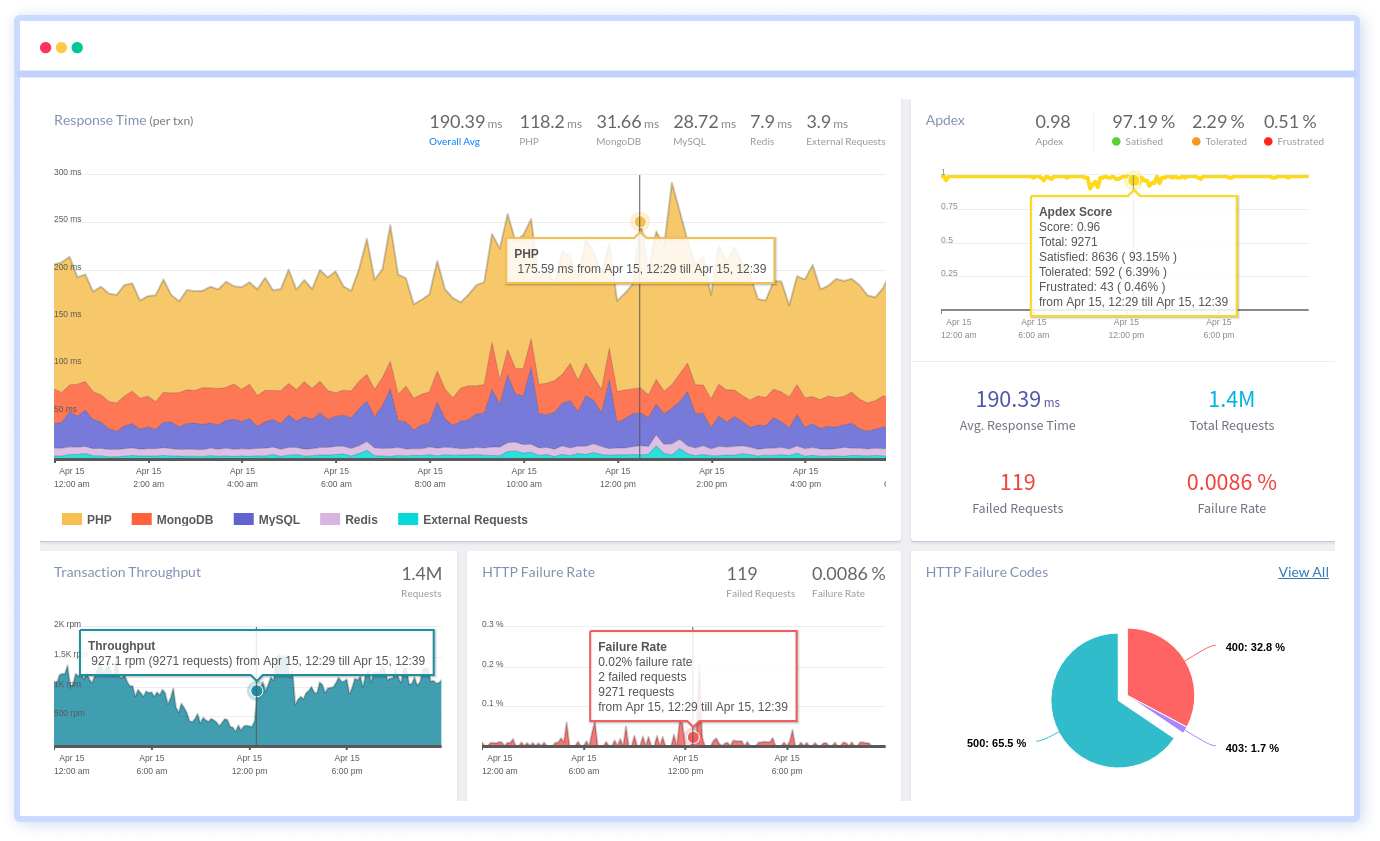
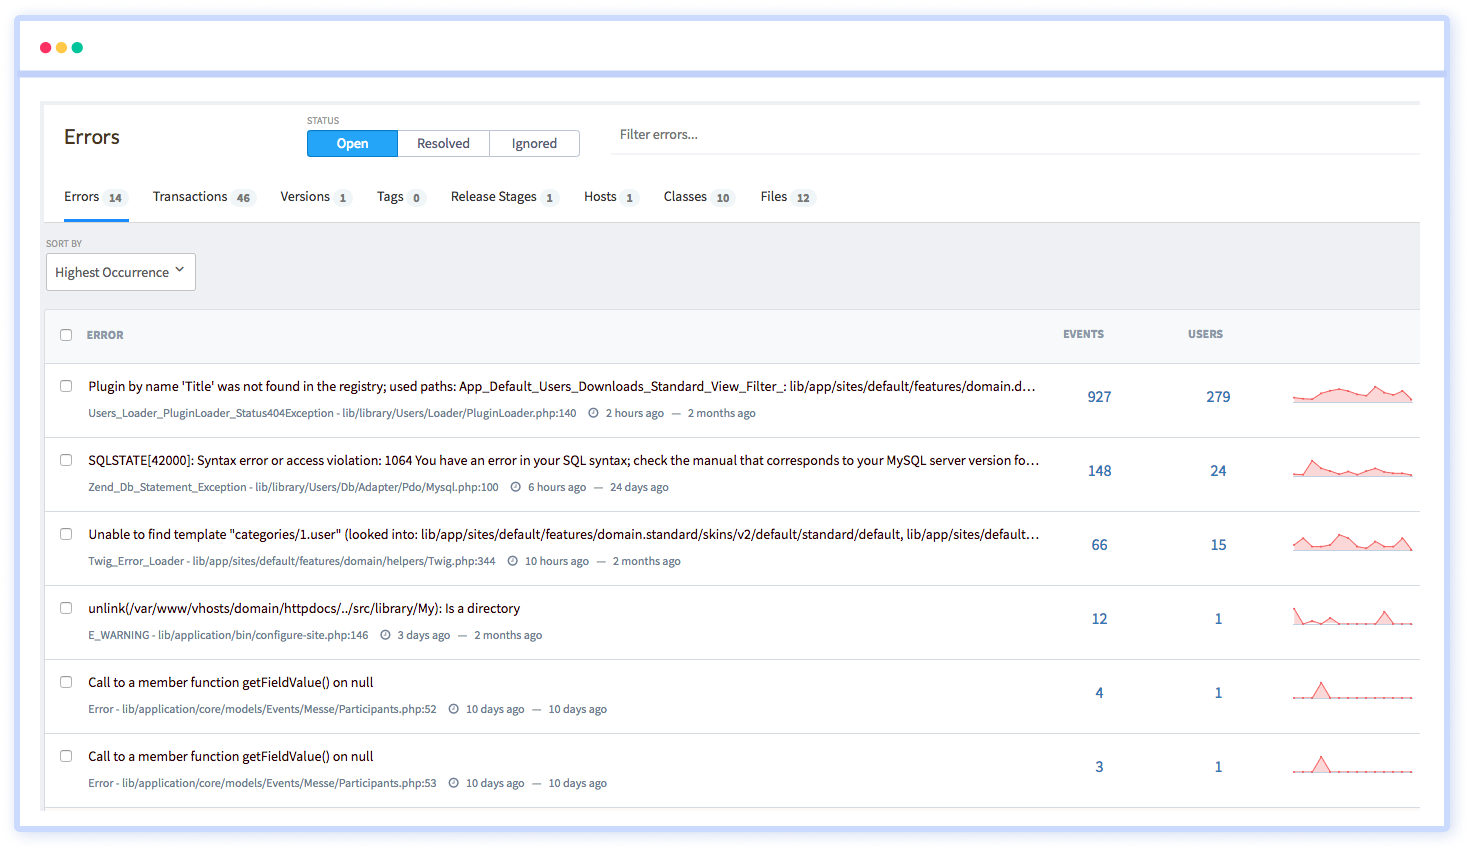
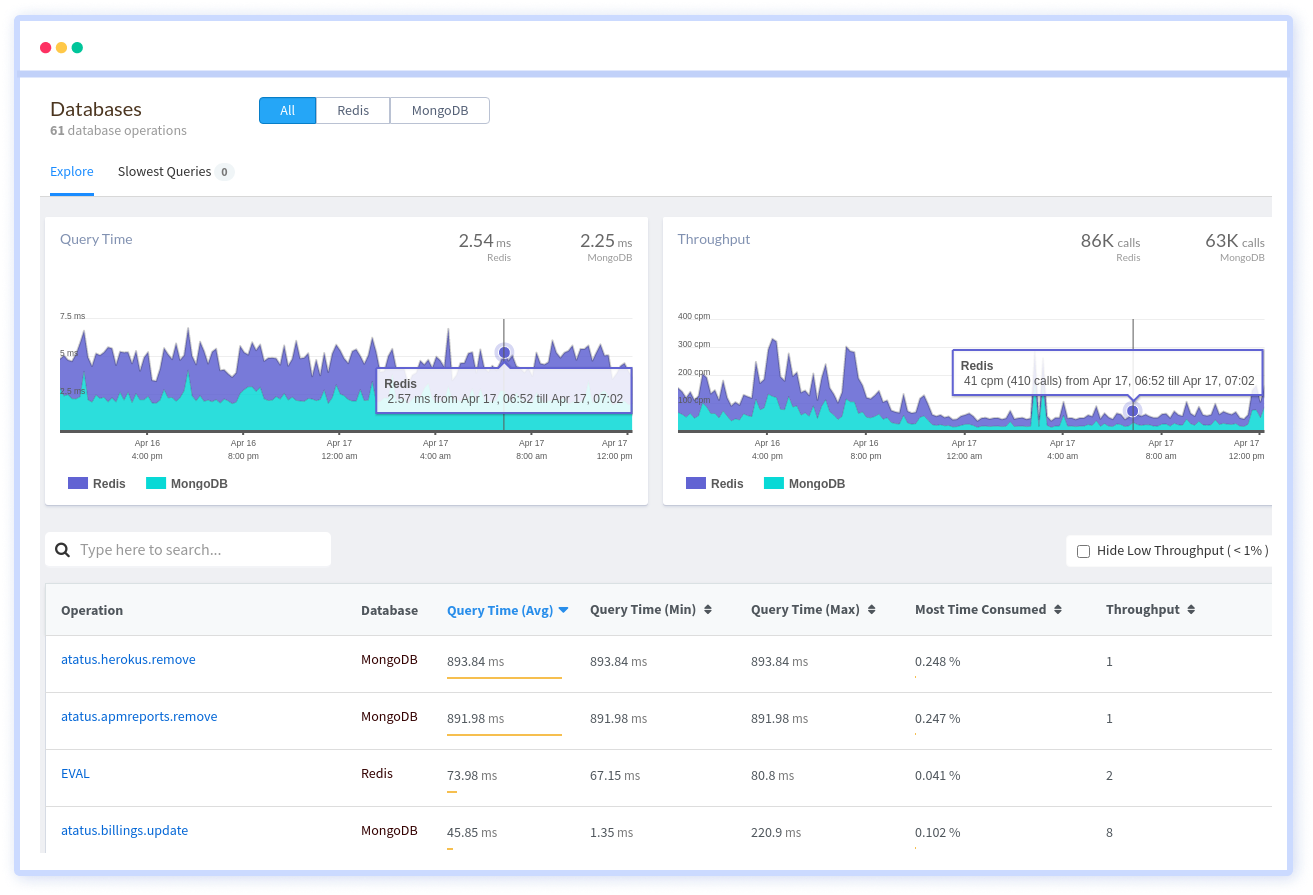
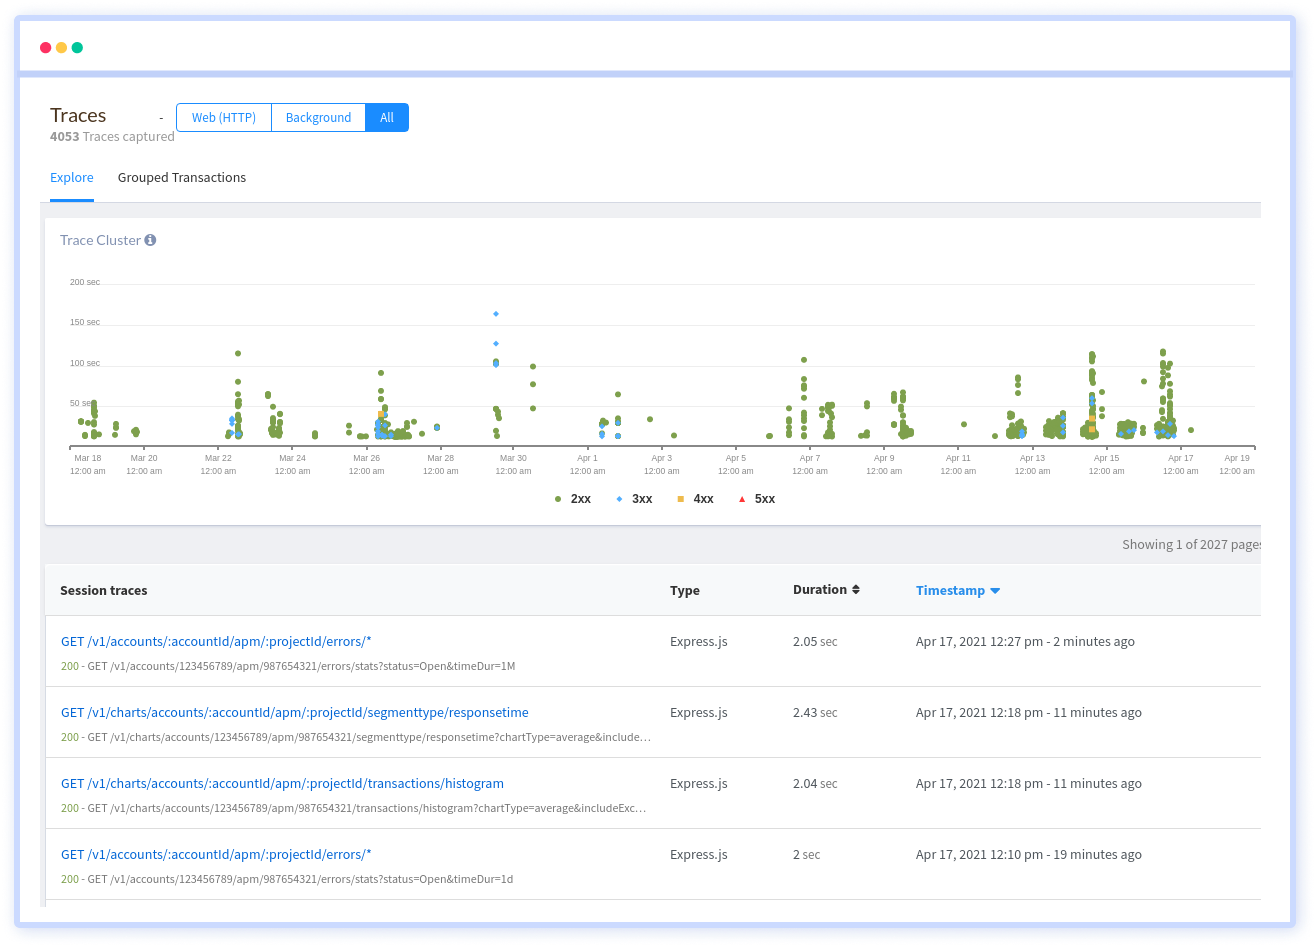
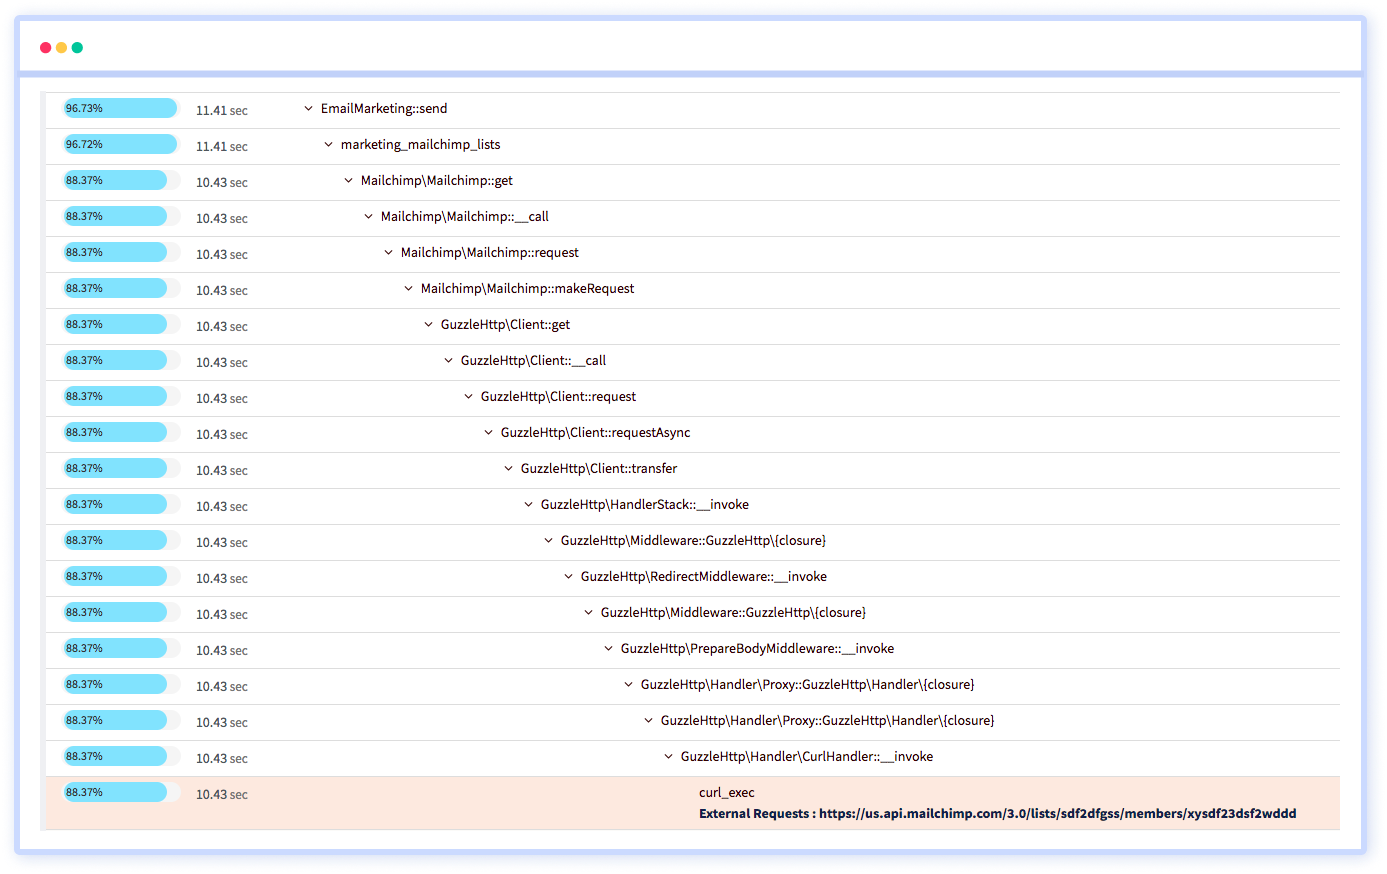
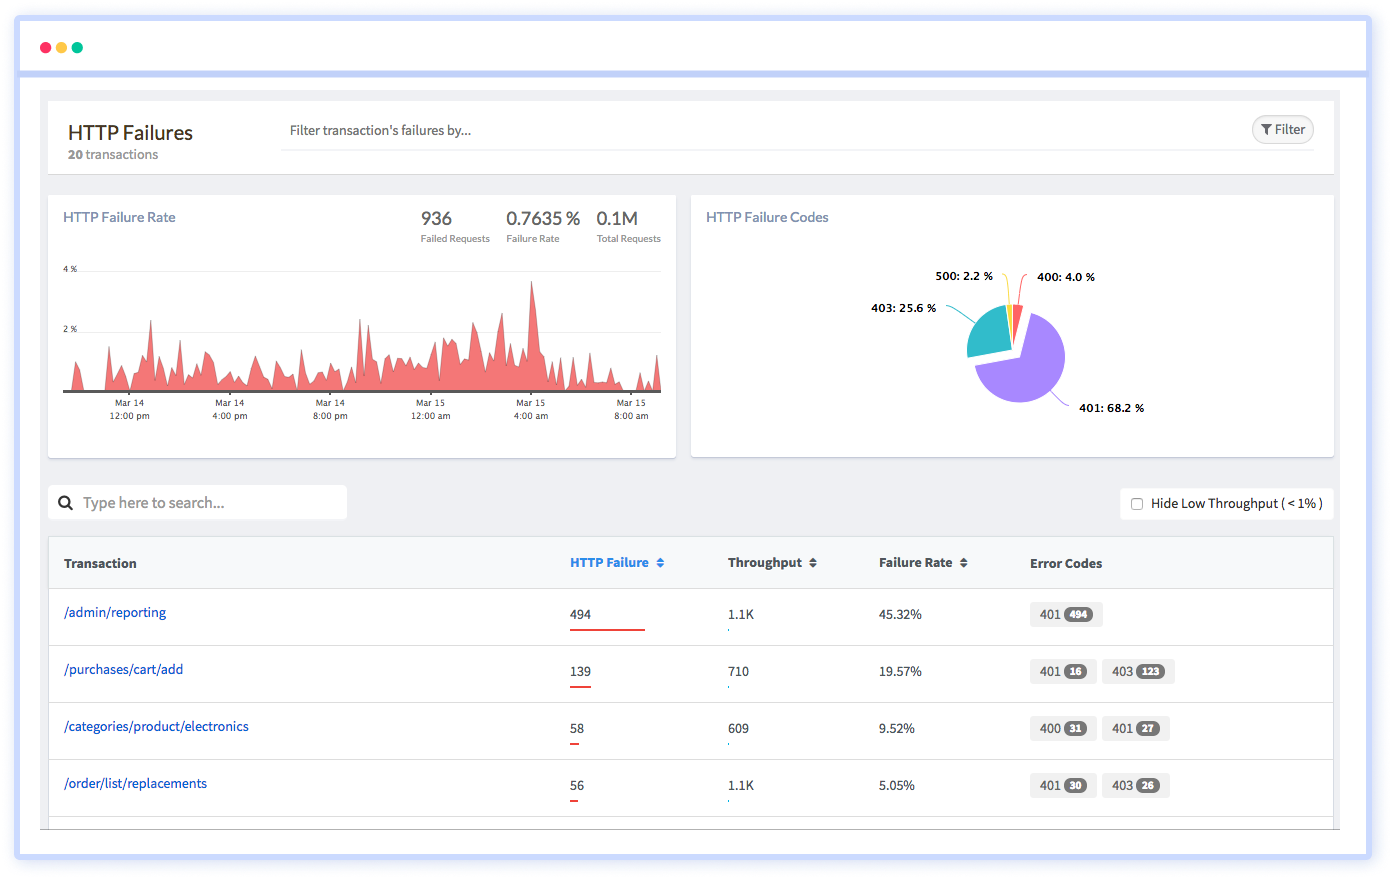
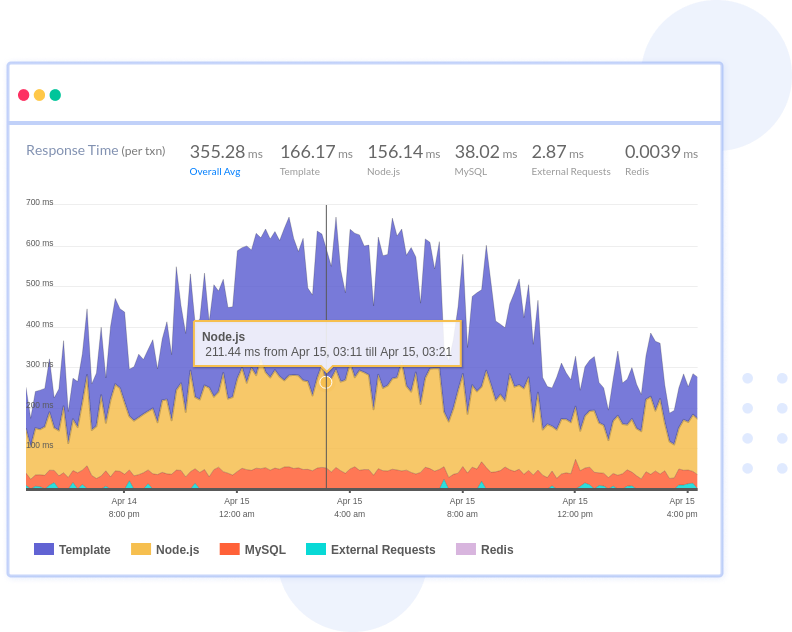
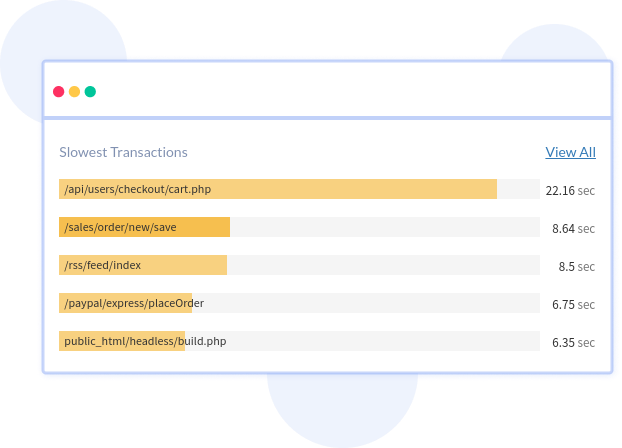
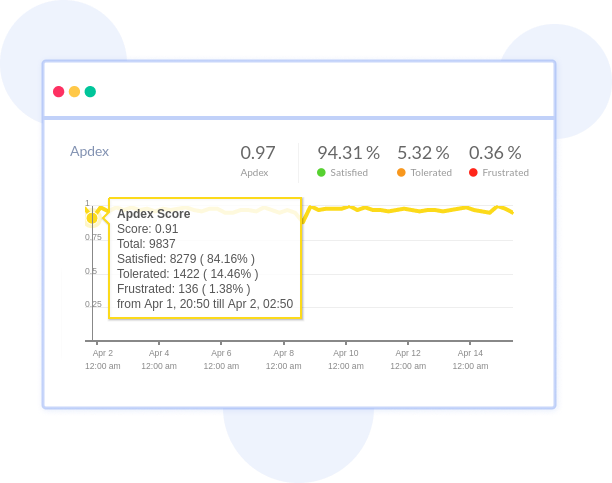
Get a profound knowledge of the usage and performance of your rest APIs and monitor the major failures that happen in your application before it impacts your end-user experience. With Atatus API analytics you can easily find out the API errors and exceptions.

Free Sign Up. No Credit Card Required. Cancel Anytime.

API performance issues that you should know

Start seeing into infrastructure performance

Try it free. No credit card required. Instant set-up.

Awesome Support

Essential tool to monitor your apps and servers

"The user interface is clean, intuitive and easy to use. This is the second project where I used Atatus and it's becoming an essential tool that I recommend to my clients."

— Eduardo D, Founder & CEO, Ace Exhibits

Resolve API error using API analytics

Detect the complex API errors and unexpected exceptions that might impact your business and identify the root cause of the issue with the help of the API analytics provided by Atatus.

ServersREST API performance

API analytics to improve your REST API performance

Handling APIs by developers is a big challenge nowadays. You can visualize all the API metrics in intelligent graphs and charts. With the analytics offered by Atatus, you can easily resolve all the REST APIs' errors at the right time before your end-user could experience them.

API Latency
Cloud MonitorUnified Dashboard

View API Analytics in an all-in-one dashboard

View all the API metrics in a unified dashboard which helps you in answering the most common questions such as when does your APIs' response time gets slow, know at which area you get more API traffic geographically and much more.

Unitfied Monitoring
ReportsReporting

API reports

You can use the API reports to collect and measure specific information about an API and share it with your teams for more investigation. Examine your API metrics using the report and get an in-depth picture of how your REST APIs are performing.

API Reports
PackagesAPI poor performance

Manage risks and make informed business decisions proactively

API analytics provide, at a very high level, an understanding of the API invocations that are going on, that can help you identify which applications are using the API and how the APIs are used. Atatus is focused on helping companies make better decisions when it comes to analytics, with the primary goal of helping companies avoid the risks associated with poor performance.

Apdex

FAQs about API Analytics

What is API Analytics, and how does Atatus facilitate it for developers?

API Analytics involves the tracking, monitoring, and analysis of API traffic, enabling developers to gain insights into how their APIs are being utilized. Atatus provides developers with a comprehensive platform for capturing and analyzing API traffic in real-time, offering detailed metrics such as endpoint usage, error rates, latency, and user behavior.

How does Atatus capture API traffic for analysis?

Atatus integrates seamlessly with various API gateways, frameworks, and programming languages using lightweight agents or plugins. These integrations allow Atatus to intercept incoming and outgoing API requests, capturing essential data such as request and response payloads, headers, status codes, and timestamps. Atatus then aggregates and processes this data to generate actionable insights and analytics.

What kinds of metrics and analytics does Atatus offer for API monitoring?

Atatus provides a wide range of metrics and analytics tailored specifically for APIs, including but not limited to:

  1. Endpoint usage: Number of requests, response times, and error rates for each API endpoint.
  2. Latency distribution: Histograms and percentiles of API response times to identify performance bottlenecks.
  3. Error analysis: Breakdown of error types, frequencies, and affected endpoints.
  4. User segmentation: Analysis of API usage patterns based on user demographics, geographic location, or device type.
  5. Business metrics: Adoption rates, retention rates, and other key performance indicators (KPIs) to measure the success of API initiatives.
Can I track the performance of individual API endpoints with Atatus?

Yes, Atatus allows you to monitor and analyze the performance of individual API endpoints in real-time. You can track metrics such as response time, error rates, throughput, and latency for each endpoint, enabling you to identify performance bottlenecks, optimize resource allocation, and improve the reliability of your APIs.

How does Atatus ensure data privacy and security when capturing API traffic?

Atatus takes data privacy and security seriously and employs various measures to protect sensitive API traffic data. This includes data encryption both in transit and at rest, role-based access controls (RBAC) to restrict access to sensitive data, and compliance with industry standards such as GDPR and HIPAA. Additionally, Atatus offers options for on-premises deployment and data anonymization to further enhance data privacy and compliance.

Is Atatus suitable for microservices and serverless architectures?

Absolutely! Atatus is well-suited for microservices and serverless architectures, offering native support for distributed systems and ephemeral workloads. Its lightweight agents and integrations can be easily deployed alongside microservices and serverless functions, providing developers with visibility into API interactions across complex, decentralized environments.

What kind of data does Atatus capture from API requests and responses?

Atatus captures a wealth of data from API requests and responses, including but not limited to:

  1. Request metadata: HTTP method, URL path, query parameters, headers, and timestamps.
  2. Request payloads: JSON, XML, or other data formats sent in the request body.
  3. Response metadata: HTTP status code, headers, response time, and timestamps.
  4. Response payloads: JSON, XML, or other data formats returned in the response body.
  5. Error details: Stack traces, error messages, and error codes for failed API requests.
Does Atatus support capturing metadata from custom headers or attributes?

Yes, Atatus provides flexibility for capturing custom metadata from API requests and responses. Developers can configure Atatus to extract data from custom HTTP headers, JWT tokens, cookies, or any other attributes specific to their API implementation. This allows for deeper insights and contextual analysis of API traffic based on custom attributes relevant to your business logic.

What products does Atatus provide?

Atatus supports a wide range of products across various domains to help organizations monitor and optimize their systems and applications.

  1. Application Performance Monitoring
  2. Real User Monitoring
  3. Synthetic Monitoring
  4. Logs Monitoring
  5. Infrastructure Monitoring
  6. API Analytics
  7. Database Monitoring
  8. Kubernetes Monitoring

You're in good company.

You don't have to trust our word. Hear what our customers say!

Atatus is a great product with great support. Super easy to integrate, it automatically hooks into everything. The support team and dev team were also very helpful in fixing a bug and updating the docs.
Tobias
Tobias L
Full Stack Engineer, ClearVoyage
Atatus is powerful, flexible, scalable, and has assisted countless times to identify issues in record time. With user identification, insight into XHR requests to name a few it is the monitoring tool we choose for our SPAs.
Jan Paul
Jan-Paul B
Chief Executive Officer, iSavta
Atatus continues to deliver useful features based on customer feedback. Atatus support team has been responsive and gave visibility into their timeline of requested features.
Daniel
Daniel G
Software Engineer, MYND Management

Trusted Protection through Global Compliance

Feel assured as we maintain rigorous security protocols, ensuring the safety of your data with every interaction

Soc 2 Type 2 Compliant
ISO 27001 Certified
ISO 27001 Certified
GDPR & CCPA Compliant

Ready to see actionable data?

Avail Atatus features for 14 days free-trial. No credit card required. Instant set-up.