Stand out with API Performance Monitoring

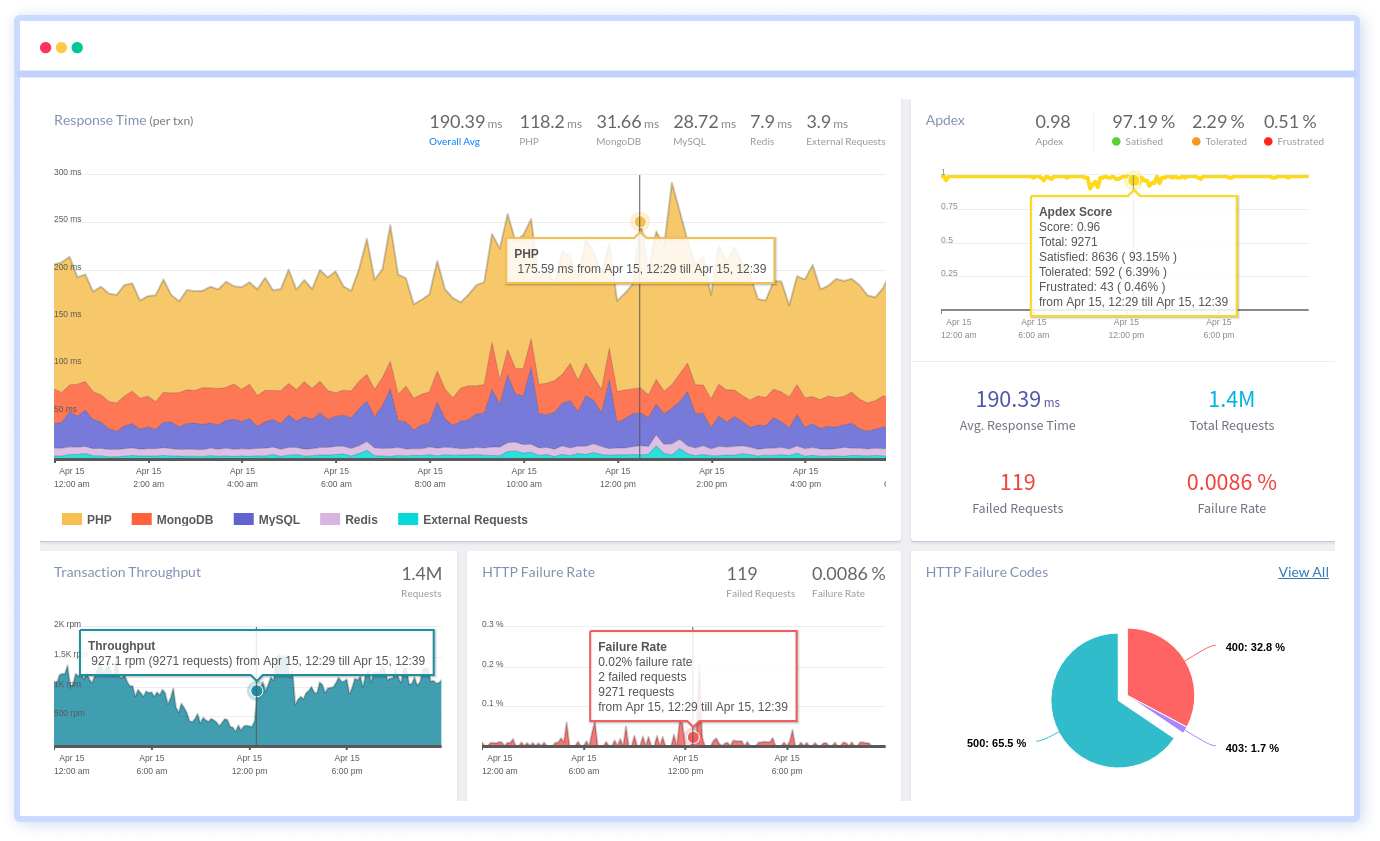
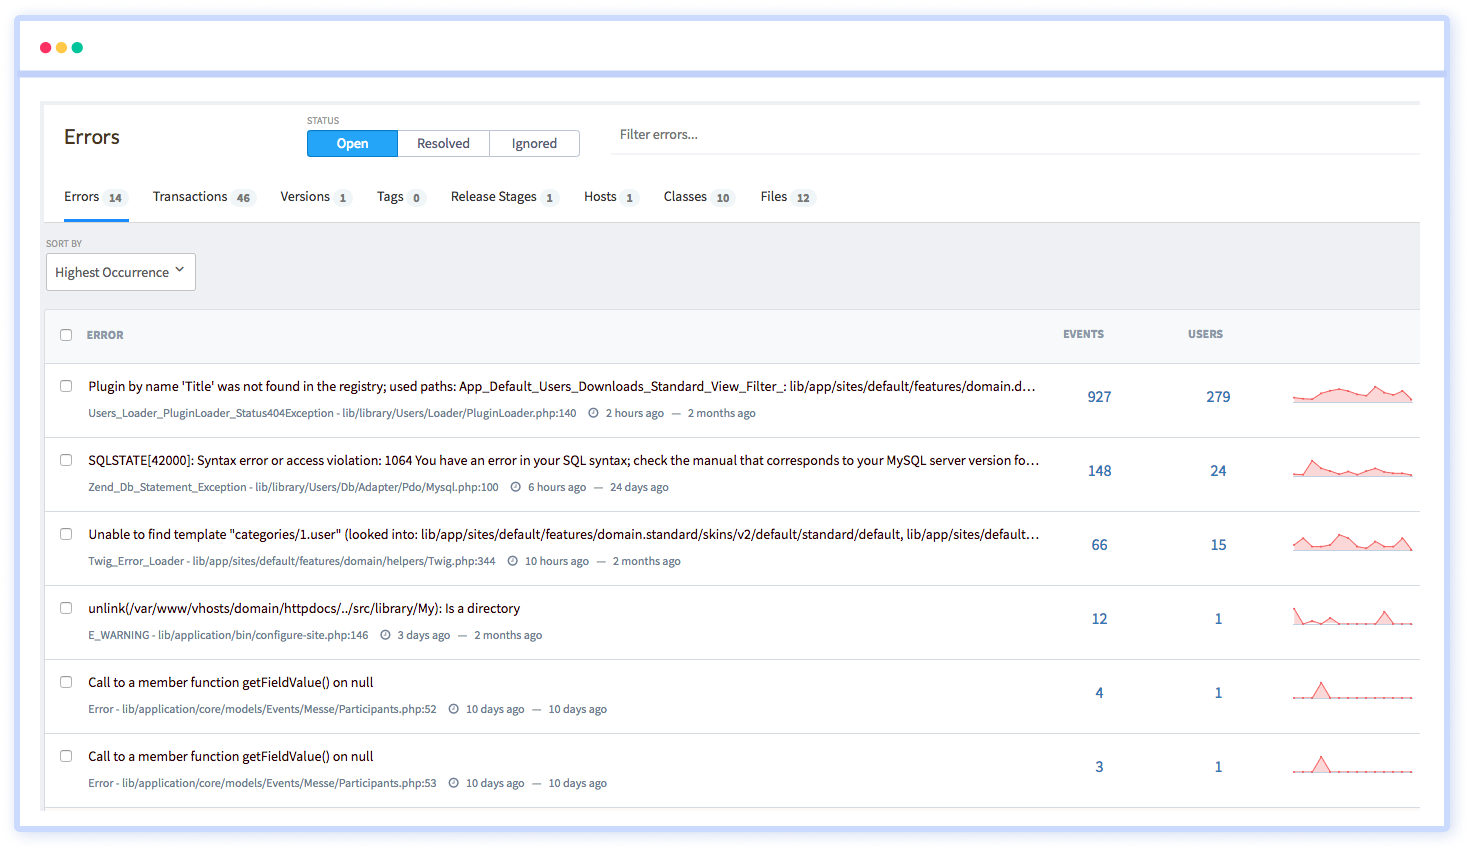
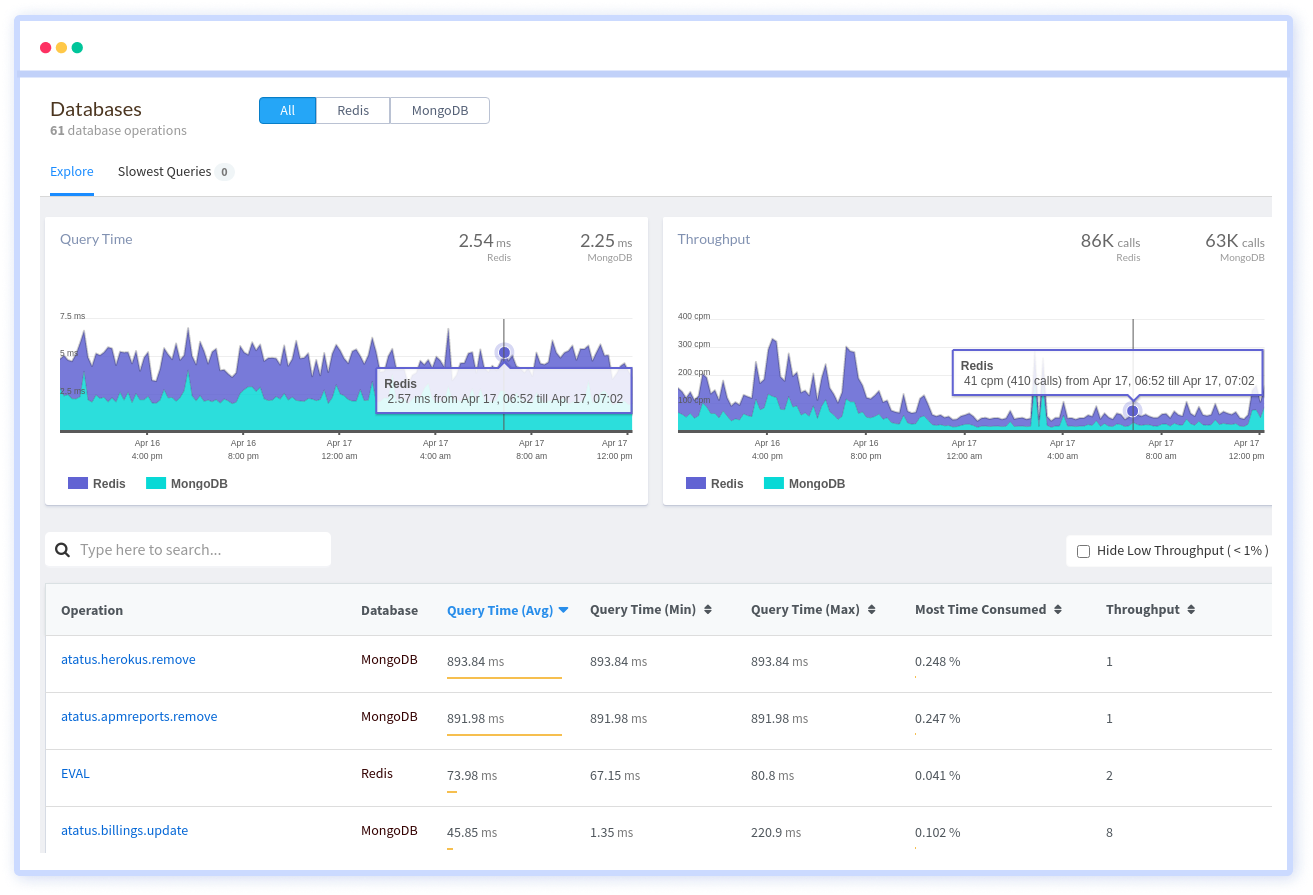
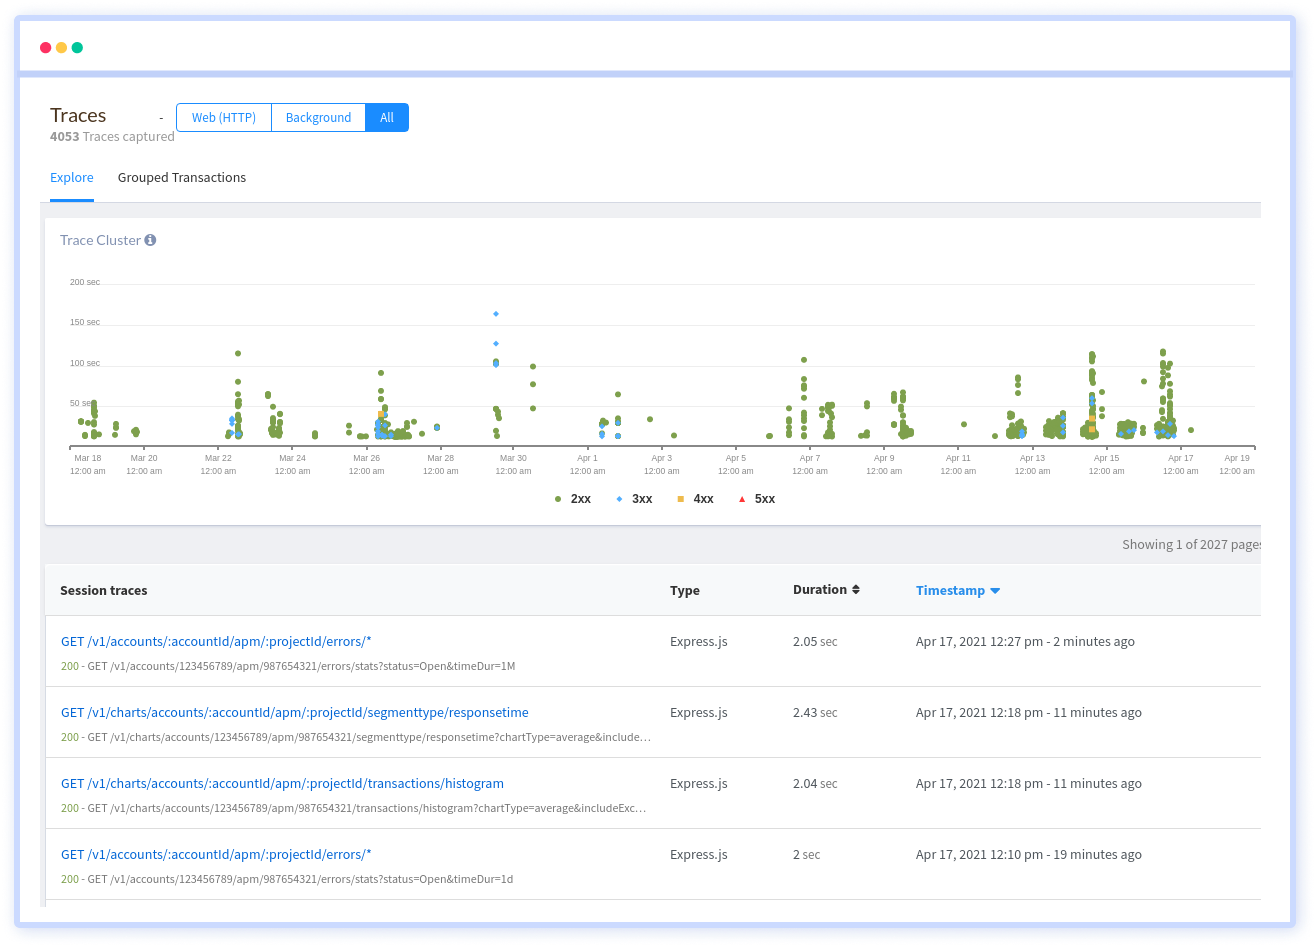
Monitor your internal, external and third-party APIs for their functionality, availability and performance metrics to check how your actual users' experience the API in your app. Validate rest API and keep track of the metrics such as latency, and response time to deliver the best performance of your application.

Free Sign Up. No Credit Card Required. Cancel Anytime.

API performance issues that you should know

Start fixing issues impacting your users right now

Start a 14-day free trial. No credit card, no code changes, no hassle.

Awesome Support

Crazy Easy Install, Fast Time to Value

"Installed it to track a Laravel + MySQL app. Installation was insanely fast and easy, way way easier than the others I tried. I've already found a bunch of queries that need to be tuned, so I'm getting a lot of value already. They track absolutely everything, which gives me great insight into my application."

— Aaron F, Product Manager, Resolute Property Tax Solutions

Gain visibility into API Transactions

Get a piece of complete knowledge on how your API transaction works and keep track of your entire API requests under a single place where you can gain in-depth performance metrics. The metrics are shown in an intuitive dashboard that arise due to slow page loads, route changes, delayed static assets, poor XMLHttpRequest, JS errors and more.

Failure countSlowest API Calls

Find Slowest API Requests in real-time

Sometimes you might miss the API issues when you try to find out manually. Use an API monitoring tool like Atatus in order to find out the API bottlenecks that aren't visible. Know when and where your rest API do not perform well and optimize them at the right time.

Learn morearrow icon
Slowest Request
API FailuresAPI Failures

Get control over the most REST API critical failures

A single API can cause significant issues in any of your components which might also cause widespread failures that you are unaware of. Always ensure that nothing affects your API such as the amount of data coming through an API, latency, response time and other performance-related metrics.

Learn morearrow icon
API Failures
ExceptionsReal-time error monitoring

Stay on top by finding and resolving problems quickly

See the full picture of any exception with in-depth diagnostics that lets you know exactly what went wrong and how to fix it. Get all the data you need in one place including stack trace, request parameters, environment, affected users, host, and more.

Learn morearrow icon
Error Tracking
DeploymentTrack deployments

Spot out the issues in deployment

Add deployment markers to measure how your customers are experiencing the recent code pushed into production. See how your application was performing before and after deployment with the list of slowed down requests, new errors and much more.

Release Tracking
ExceptionsIntegrations

Integrate with your favourite app and get notified

Set static threshold alerts using the metrics in the chart to detect anomalies at the precise time and start validating your API against them to sort out the performance bottlenecks that cause trouble for your customers.

Learn morearrow icon
Alerting

FAQs on API Monitoring

What is API Monitoring?

API monitoring involves tracking the performance, availability, and functionality of APIs in real-time. It helps ensure that APIs meet performance expectations and deliver the intended functionality to users.

How does Atatus monitor APIs?

Atatus monitors APIs by integrating with your API infrastructure using SDKs or API gateways. It captures and analyzes API traffic in real-time, tracking metrics such as latency, error rates, and usage patterns.

What metrics does Atatus provide for API monitoring?

Atatus provides various metrics for API monitoring, including latency, error rate, throughput, response time distribution, endpoint usage, and more. These metrics help identify performance bottlenecks and usage trends.

Can Atatus monitor both internal and external APIs?

Yes, Atatus can monitor both internal APIs (e.g., microservices within your organization) and external APIs (e.g., third-party APIs used in your application). It provides a centralized view of all API traffic.

Does Atatus capture request and response payloads for monitoring?

Yes, Atatus captures request and response payloads for monitoring purposes. It provides detailed insights into the content of API requests and responses, allowing developers to diagnose issues and optimize API performance effectively.

Does Atatus provide support for custom metrics and dashboards?

Yes, Atatus allows users to define custom metrics and dashboards tailored to their specific monitoring requirements. You can track custom metrics such as business KPIs, user engagement, or any other relevant data points for your APIs.

Does Atatus support alerting for API issues?

Yes, Atatus supports alerting for API issues. Users can configure alerts based on thresholds for metrics such as latency, error rate, and throughput. Alerts can be sent via email, Slack, or other notification channels.

How does Atatus ensure data security and compliance?

Atatus takes data security and compliance seriously. It encrypts data in transit and at rest, follows industry best practices for access control, and complies with relevant regulations such as GDPR and HIPAA. Users can also configure data retention policies to meet their compliance requirements.

What products does Atatus provide?

Atatus supports a wide range of products across various domains to help organizations monitor and optimize their systems and applications.

  1. Application Performance Monitoring
  2. Real User Monitoring
  3. Synthetic Monitoring
  4. Logs Monitoring
  5. Infrastructure Monitoring
  6. API Analytics
  7. Database Monitoring
  8. Kubernetes Monitoring

You're in good company.

You don't have to trust our word. Hear what our customers say!

Atatus is a great product with great support. Super easy to integrate, it automatically hooks into everything. The support team and dev team were also very helpful in fixing a bug and updating the docs.
Tobias
Tobias L
Full Stack Engineer, ClearVoyage
Atatus is powerful, flexible, scalable, and has assisted countless times to identify issues in record time. With user identification, insight into XHR requests to name a few it is the monitoring tool we choose for our SPAs.
Jan Paul
Jan-Paul B
Chief Executive Officer, iSavta
Atatus continues to deliver useful features based on customer feedback. Atatus support team has been responsive and gave visibility into their timeline of requested features.
Daniel
Daniel G
Software Engineer, MYND Management

Trusted Protection through Global Compliance

Feel assured as we maintain rigorous security protocols, ensuring the safety of your data with every interaction

Soc 2 Type 2 Compliant
ISO 27001 Certified
ISO 27001 Certified
GDPR & CCPA Compliant

Ready to see actionable data?

Avail Atatus features for 14 days free-trial. No credit card required. Instant set-up.