HAProxy Logs Monitoring & Observability

Effortlessly track HAProxy logs, gaining instant insights into errors and refining logging for a more efficient and reliable application.

HAProxy Logs Monitoring
HAProxy Log InsightsAnalysis

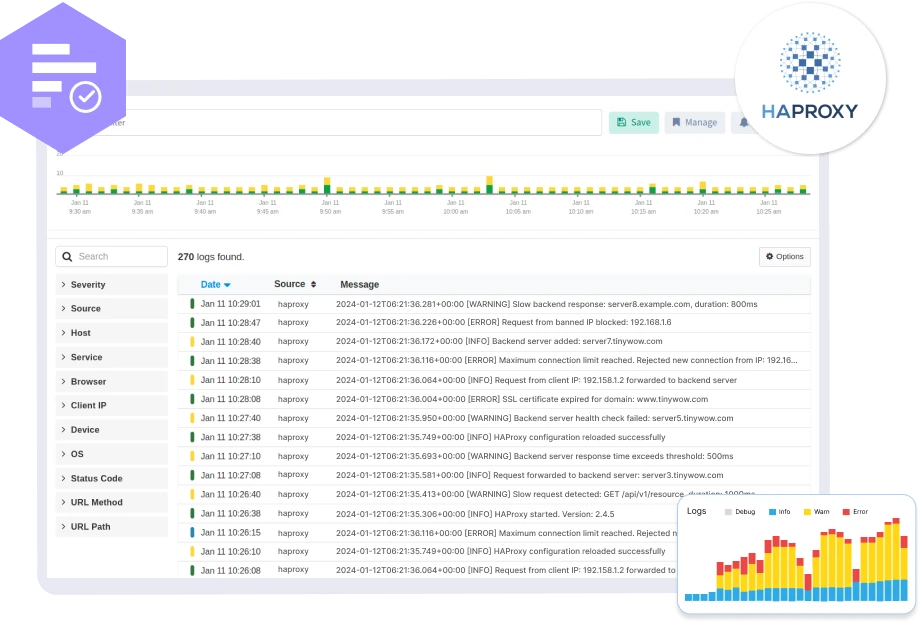
Real-time HAProxy Log Insights

Simplify the collection and analysis of HAProxy log data from diverse sources. Explore millions of log messages with a single click, experiencing search responses in seconds—no indexing required. Ensure rapid issue resolution, identify anomalies, and guarantee a seamless user experience with our real-time HAProxy Logs Monitoring tool, facilitating seamless business operations.

Real-time HAProxy Log Analysis
Parse and Transform HAProxy LogsRefine Logs

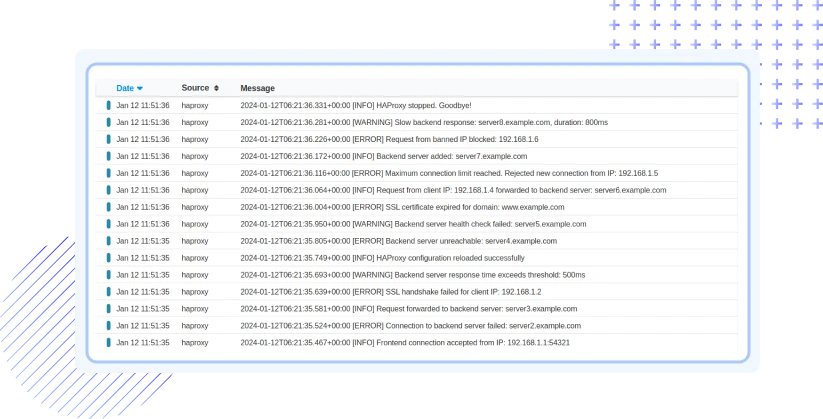
Log Data Parsing and Transformation

Proactively transform raw data by parsing, extracting, and structuring it to derive valuable insights from previously unstructured logs. Prioritize customer security by meticulously anonymizing PII data, completely excluding sensitive fields. Our approach ensures seamless processing, regardless of the data source, format, or schema, optimizing storage, and enabling nuanced analysis for improved monitoring and issue resolution.

Parse and Transform HAProxy Logs
InstallationLog Pipelines

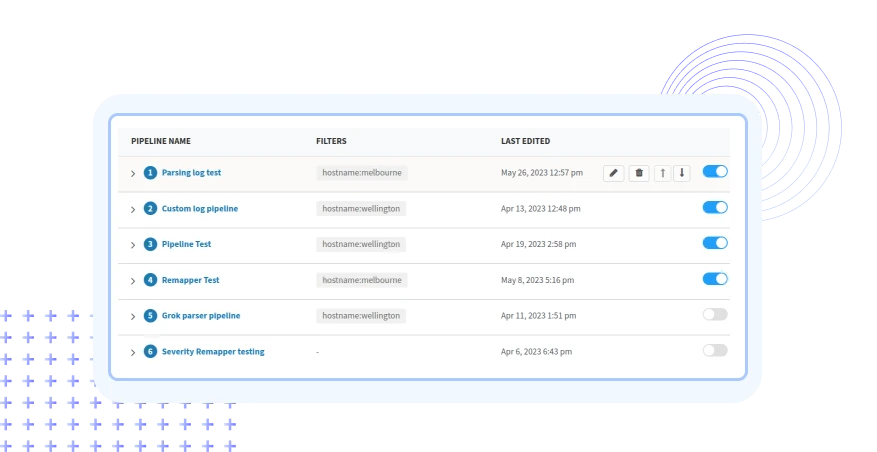
Create Powerful Log Pipelines with Ease

Create customized pipelines using diverse filters and fine-tune your log data through custom parsing rules. Extract valuable insights by breaking down logs into structured fields, ensuring your data is organized and easy to analyze. Filter by log source, severity, timestamp, or any custom field to focus on what matters most. Experience instant updates based on your defined filters as logs flow through your pipeline.

HAProxy Log Pipelines
HAProxy Logs Saved ViewSaved Views

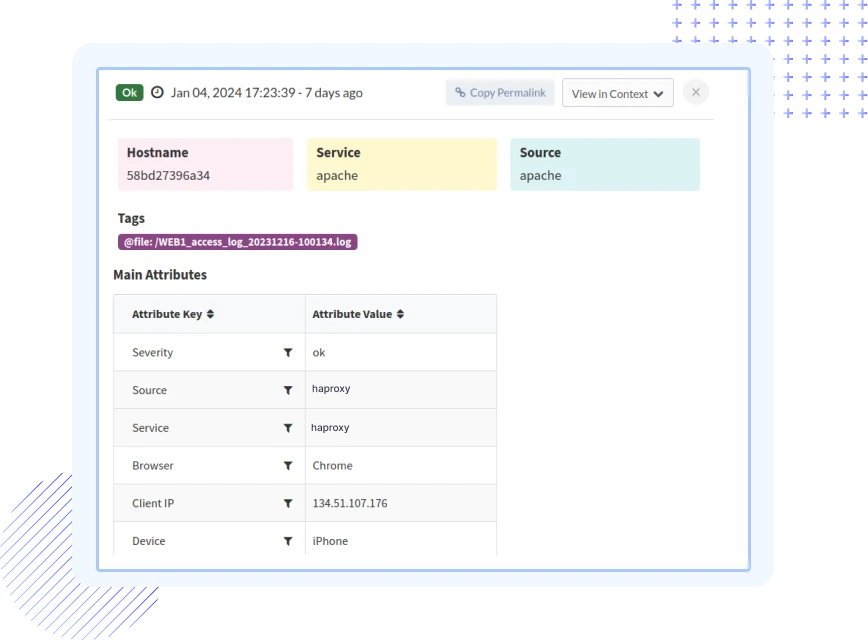
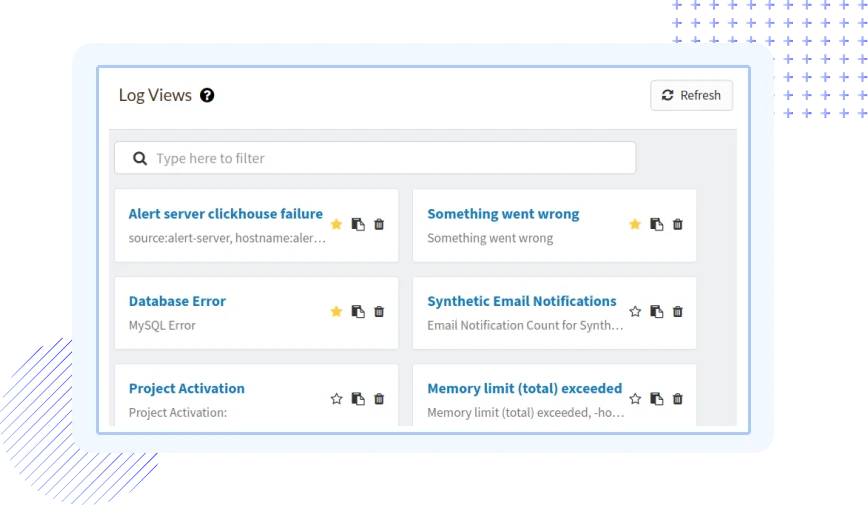
Saved Views for Effortless Context Switching

Customize your troubleshooting environment and switch effortlessly between different contexts with just a click. Save time and boost efficiency by automating repetitive troubleshooting tasks through Saved Views. Define filters, facets, and visualizations in advance to automatically load when switching to a specific troubleshooting context. Simplify collaboration by enabling team members to adopt and share predefined views.

HAProxy Logs Saved View

Logs Aggregate and Analysis made easy!

Live performance data

Real-time alerting

Immediate notification of high-priority incidents through advanced configurations based on error logs or custom queries.

Resolve issues quickly

Filter Context

Enhance debugging by adding/deleting related streams like host, service, source, severity for focused analysis.

Compare releases

Seek by Time

Pinpoint events in distributed logs for detailed issue resolution—critical for understanding specific occurrences across systems.

Smart notifications

Saved Views

Save, re-run searches, and manage views easily within the event viewer—modify filters swiftly for efficient log event analysis.

Built for developers

Built for developers

Designed to help developers and managers determine when and where their attention is required and enable teams to make fast.

Full text search

Email digests

Don't miss out on your events and error stats. Atatus can send you weekly and monthly summaries directly to your inbox.

FAQs on HAProxy Logs Monitoring

Why is HAProxy log monitoring important?

HAProxy log monitoring is crucial for several reasons. It helps identify potential security threats, troubleshoot issues, optimize server performance, track user activity, and gain insights into website traffic patterns. Monitoring HAProxy logs allows administrators to proactively address issues, enhance website reliability, and improve the overall user experience.

What benefits does Atatus provide for HAProxy logs monitoring?

Atatus offers several benefits for HAProxy logs monitoring, including:

  1. Real-time Log Analysis: Atatus provides real-time log analysis, allowing you to quickly identify issues and trends.
  2. Custom Dashboards: Create custom dashboards to visualize HAProxy log data and key metrics.
  3. Alerting: Set up alerts based on log events, allowing you to be notified of specific activities or issues.
  4. Correlation with Infra Metrics: Correlate HAProxy logs with performance metrics for a comprehensive view of your system.
How can I analyze HAProxy logs for performance optimization?

To optimize performance using HAProxy logs:

  1. Look for Slow Requests: Identify requests with high response times.
  2. Check Resource Usage: Monitor server resources (CPU, memory, disk) during peak times.
  3. Review Error Logs: Investigate and resolve errors affecting performance.
  4. Analyze Traffic Patterns: Identify popular content and optimize delivery.
What log formats does Atatus support for HAProxy logs?

Atatus supports various HAProxy log formats. The common log formats include the default format and the HTTP format. Ensure that the log format specified in your HAProxy configuration matches the one configured in Atatus. You can customize the log format in the Atatus Agent configuration to match your HAProxy log format.

How can I customize the parsing of HAProxy logs in Atatus?

Atatus allows you to customize log parsing using Grok patterns in the haproxy.d/conf.yaml file. You can define specific patterns for extracting fields from your HAProxy logs. Refer to the Atatus documentation on log processing for more details on creating custom parsing rules.

Can log pipelines be configured to focus on specific log attributes?

Yes, log pipelines can be configured to filter log data based on various attributes such as log source, severity, timestamp, or any custom field. This customization allows users to focus on specific aspects of log data that are most relevant to their monitoring goals.

How does Saved Views enhance the troubleshooting experience?

Saved Views in HAProxy Logs Monitoring enable you to create and save custom configurations for different troubleshooting scenarios. This feature simplifies collaboration, allows for quick context switching, and automates repetitive tasks, significantly improving overall efficiency.

What happens if my log ingestion rate exceeds the limits of my Atatus subscription?

If you exceed your log ingestion limits, we would contact you to discuss on stopping further processing new log data or upgrade your subscription.

What log storage options does Atatus offer?

You can choose to store logs in Atatus for a limited time (e.g., 7 days) or export them to external storage solutions like Amazon S3 for long-term retention.

What happens if I need to search for historical log data that exceeds the retention period?

To access historical log data beyond the retention period, you can rely on log data exports from Amazon S3, where you can push the logs into Atatus for further analysis.

Can I customize log retention settings in Atatus?

Yes, Atatus provides users with the flexibility to customize log retention settings. Users can adjust retention periods based on their specific needs, aligning with compliance standards or internal data management policies.

You're in good company.

You don't have to trust our word. Hear what our customers say!

Atatus is a great product with great support. Super easy to integrate, it automatically hooks into everything. The support team and dev team were also very helpful in fixing a bug and updating the docs.
Tobias
Tobias L
Full Stack Engineer, ClearVoyage
Atatus is powerful, flexible, scalable, and has assisted countless times to identify issues in record time. With user identification, insight into XHR requests to name a few it is the monitoring tool we choose for our SPAs.
Jan Paul
Jan-Paul B
Chief Executive Officer, iSavta
Atatus continues to deliver useful features based on customer feedback. Atatus support team has been responsive and gave visibility into their timeline of requested features.
Daniel
Daniel G
Software Engineer, MYND Management

Ready to see actionable data?

Avail Atatus features for 14 days free-trial. No credit card required. Instant set-up.