Aerospike Monitoring

Take control of your Aerospike environment, optimize performance, and ensure the reliability of your critical applications

Aerospike Monitoring
Query TimeAerospike Time Consumption

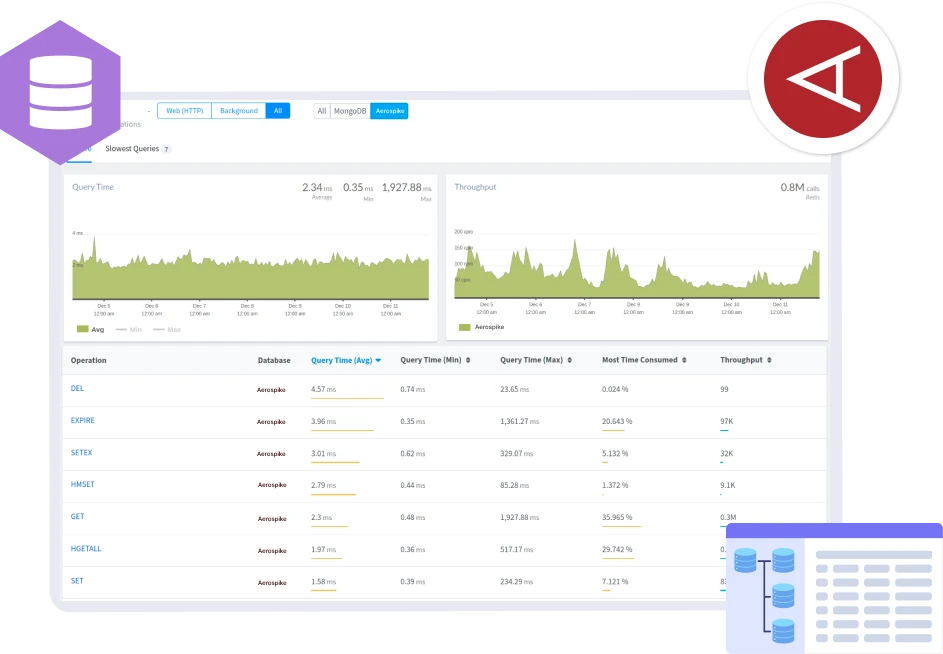
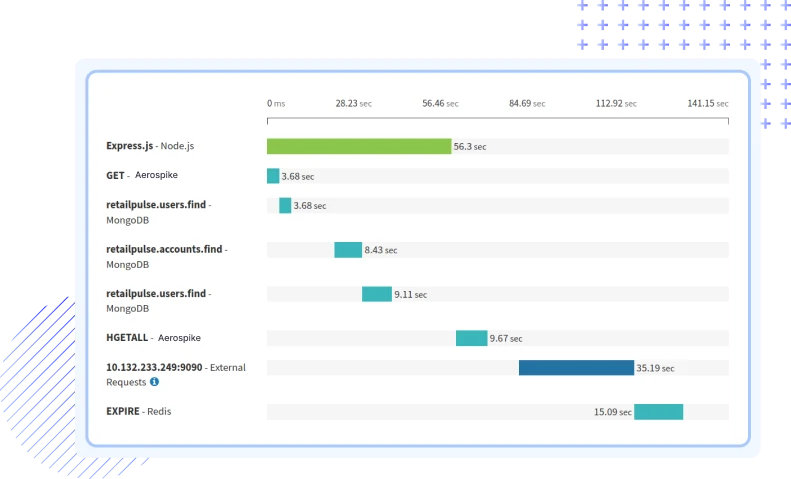
Query Analysis for Code-Level Optimization

Go beyond surface-level monitoring with our detailed query analysis. Enhance overall database responsiveness by optimizing Aerospike queries. Identify and rectify bottlenecks, connecting queries to specific code sections for targeted optimizations. Understand the breakdown of response times to identify areas for improvement.

Aerospike Query Analysis
Slow QuerySlow Queries

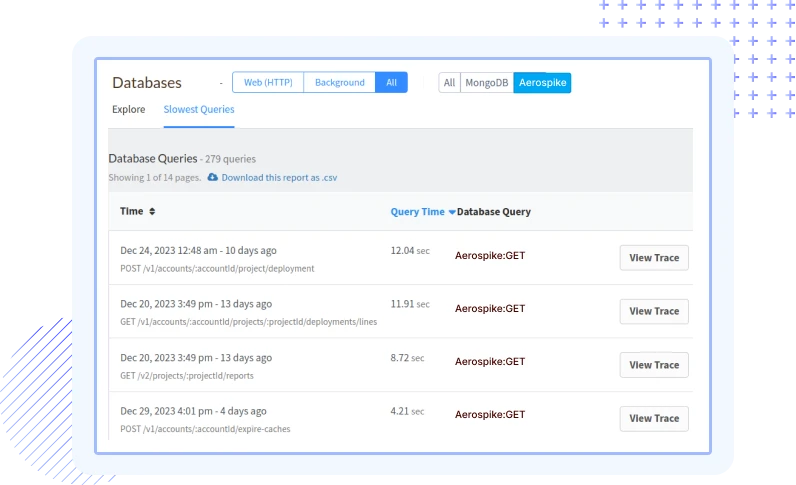
Pinpoint Slow Aerospike Queries

Achieve precision in optimizing Aerospike speed by pinpointing specific commands affecting performance. Our advanced monitoring capabilities allow you to analyze and identify commands with the most significant impact on Aerospike responsiveness. Streamline your Aerospike infrastructure by optimizing these commands, ensuring a faster and more efficient system.

Aerospike Slow Query
DB CallLogs

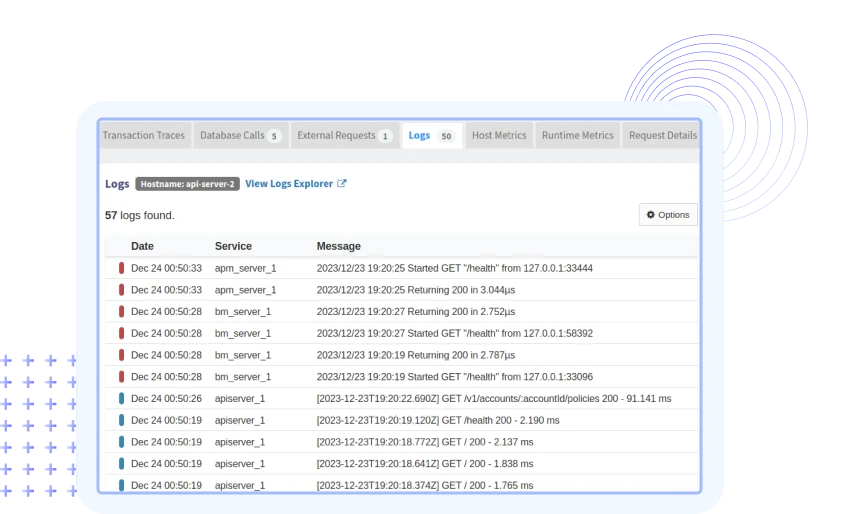
Keep Tabs on Aerospike Logs

Gain real-time insights into log events, track performance trends, and receive immediate alerts for any anomalies. This feature provides a centralized platform to streamline log analysis, ensuring proactive issue resolution and maintaining optimal Aerospike performance.

Aerospike Logs
Slow QueryReplication Lag

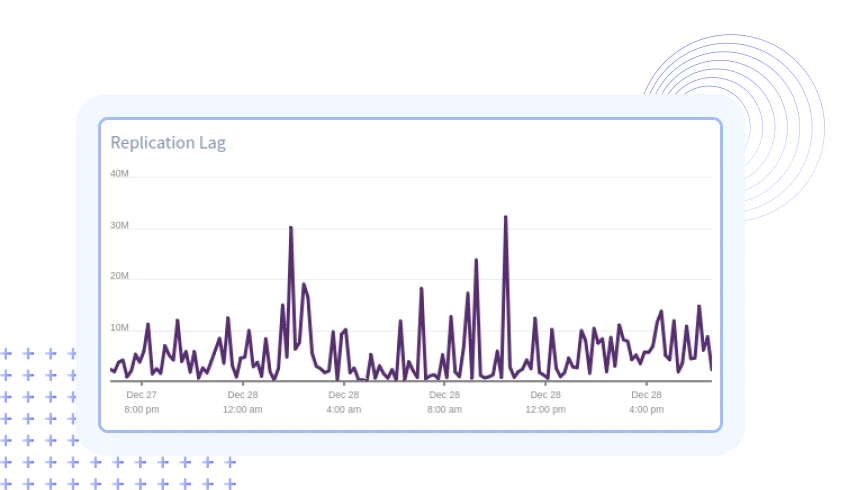
Replication Monitoring for High Availability

Ensure data consistency and high availability with real-time replication monitoring. Receive immediate notifications for replication lag, preventing data inconsistencies. Monitor the health of your Aerospike replication for continuous and uninterrupted service, implementing automated failovers to ensure seamless operations in case of node failures.

Replication Lag
Ensure Continuous Database Monitoring Across all SQL and No-SQL Databases

Monitoring your software stack made easy!

Auto Instrumentation

Auto Instrumentation

Utilize industry-leading integrations with libraries and frameworks for in-depth invisibility into Java, PHP, Node.js, Ruby, Python, Go, .NET applications.

Real-time observability

Real-time observability

See data from multiple apps in real time and visualize critical information including transaction performance, error rate, database performance, network calls and more.

Resolve issues quickly

Resolve issues quickly

Quickly identify error and performance issues and fix them by using the context, environment, and more before it affects your customers.

Unlimited applications

Unlimited applications

Track all your application workflow in one place. Add your production, dev, staging, QA to monitor your applications through the complete software development cycle.

Custom Queries

Custom Queries

Get your questions answered. Use custom queries to slice and dice the data by transaction, URL, error, user, browser, host OS and more using performance monitoring.

Built for developers

Built for developers

Designed by developers, for developers and managers to determine when and where your attention is required and enable teams to ship more and fix less.

Smart notifications

Smart notifications

Setup alerts to automatically monitor your applications for increase in response time, API failures, error rate and much more. Get notified through various channels, including Slack, Teams, Email, PagerDuty and more.

Compare releases

Compare releases

Easily compare one time range to another and so on, and identify changes in app behavior and stability with respect to the app releases.

Email digests

Email digests

Don't miss out on your application performance and error stats. Atatus can send you weekly and monthly summaries directly to your inbox.

FAQs on Aerospike Monitoring

What is Aerospike monitoring, and why is it important?

Aerospike Database monitoring involves tracking and analyzing various metrics and performance indicators to ensure the smooth operation and optimal performance of the Aerospike NoSQL database.

  1. Optimize memory, storage, and CPU usage for overall efficiency.
  2. Plan for growth by analyzing data trends and resource usage.
  3. Ensure system availability by monitoring individual nodes and the cluster.
  4. Improve query performance by analyzing and optimizing query patterns.
  5. Receive notifications when metrics exceed defined thresholds for quick response.
Why should I monitor Aerospike with Atatus?

Atatus offers real-time insights into the performance of your Aerospike infrastructure, helping you identify issues, optimize resource usage, and ensure the overall health of your Aerospike clusters. It provides metrics, traces, and logs for comprehensive monitoring.

What metrics should be monitored in Aerospike?

Key metrics to monitor in Aerospike include: Key metrics include throughput (reads and writes per second), latency, storage usage, memory utilization, node health, and network metrics.

  1. Throughput (reads and writes per second)
  2. Latency
  3. Storage Usage
  4. Memory & CPU Utilization
  5. Node Health
  6. Network Metrics
Which databases does Atatus support for monitoring?

Atatus supports a wide range of popular databases, including but not limited to MySQL, MS SQL, PostgreSQL, MongoDB, MariaDB, Redis, Memcached, and SQLite. The platform provides integrations and pre-built dashboards tailored to each supported database, allowing users to monitor and analyze their database performance effectively. Whether your application relies on MySQL or a combination of different databases, Atatus provides a unified platform for effective monitoring and optimization.

How can I monitor Aerospike cluster health?

The frequency of checking Aerospike metrics depends on the specific requirements of your application and the criticality of your Aerospike deployment. However, regular monitoring, especially during peak usage periods, is recommended to catch potential issues early.

Can I monitor multiple Aerospike clusters with Atatus?

Yes, Atatus allows you to monitor multiple Aerospike clusters simultaneously. You can set up separate integrations for each cluster and organize the metrics accordingly.

Does Atatus support distributed tracing for Aerospike?

Yes, Atatus supports distributed tracing for Aerospike. This allows you to trace requests across different components of your system, providing a holistic view of performance and identifying bottlenecks.

How does Atatus handle Aerospike log monitoring?

Atatus provides log management capabilities, allowing you to collect, aggregate, and analyze Aerospike logs through its Logs Monitoring tool. You can set up log-based metrics and alerts to gain deeper insights into the behavior of your Aerospike instances.

Can I receive alerts based on Aerospike Database metrics in Atatus?

Yes, Atatus allows you to set up custom alerts based on thresholds and conditions for Aerospike Database metrics. This ensures that you are notified promptly when issues or anomalies are detected.

How long is my Aerospike query metrics available?

Data retention for Aerospike monitoring is set to 7 days by default. This can be changed in your billing settings to 60 or 90 days. Contact our Customer Success Representative if you require a longer retention period.

You're in good company.

You don't have to trust our word. Hear what our customers say!

Atatus is a great product with great support. Super easy to integrate, it automatically hooks into everything. The support team and dev team were also very helpful in fixing a bug and updating the docs.
Tobias
Tobias L
Full Stack Engineer, ClearVoyage
Atatus is powerful, flexible, scalable, and has assisted countless times to identify issues in record time. With user identification, insight into XHR requests to name a few it is the monitoring tool we choose for our SPAs.
Jan Paul
Jan-Paul B
Chief Executive Officer, iSavta
Atatus continues to deliver useful features based on customer feedback. Atatus support team has been responsive and gave visibility into their timeline of requested features.
Daniel
Daniel G
Software Engineer, MYND Management

Ready to see actionable data?

Avail Atatus features for 14 days free-trial. No credit card required. Instant set-up.