MongoDB Monitoring & Observability

Make data-driven decisions, optimize MongoDB performance, and ensure the security and resilience of your MongoDB environment.

MongoDB Monitoring
Query TimeMetrics

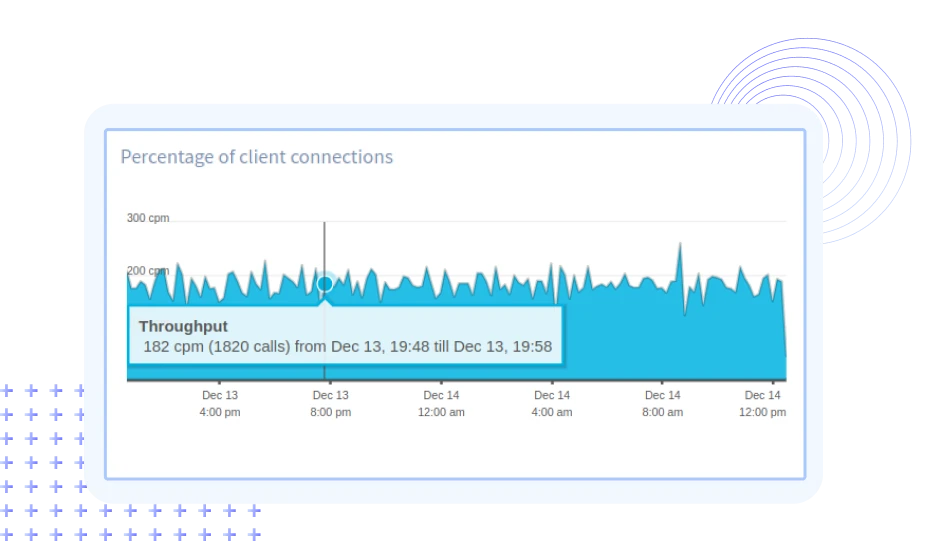
Monitor MongoDB Availability and Connection Metrics

Ensure seamless MongoDB operation with constant availability tracking and detailed connection metric analysis. Understand uptime, observe connection pool dynamics, and diagnose issues in real-time. This results in uninterrupted service, providing instant awareness of any potential challenges, empowering you with a resilient and reliable MongoDB environment.

MongoDB Connection Time
Slow QuerySlow MongoDB Commands

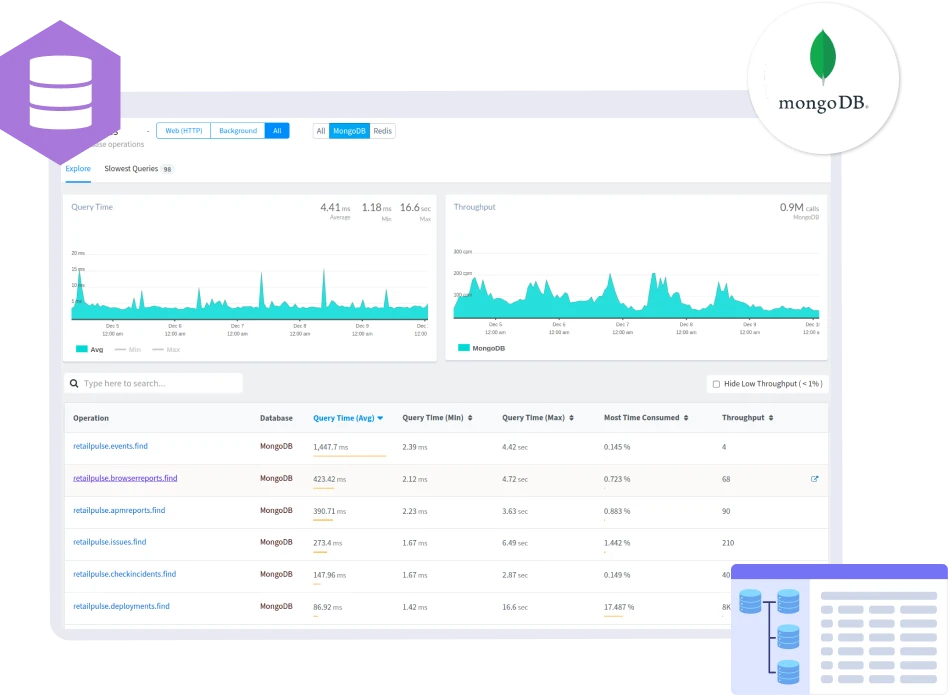
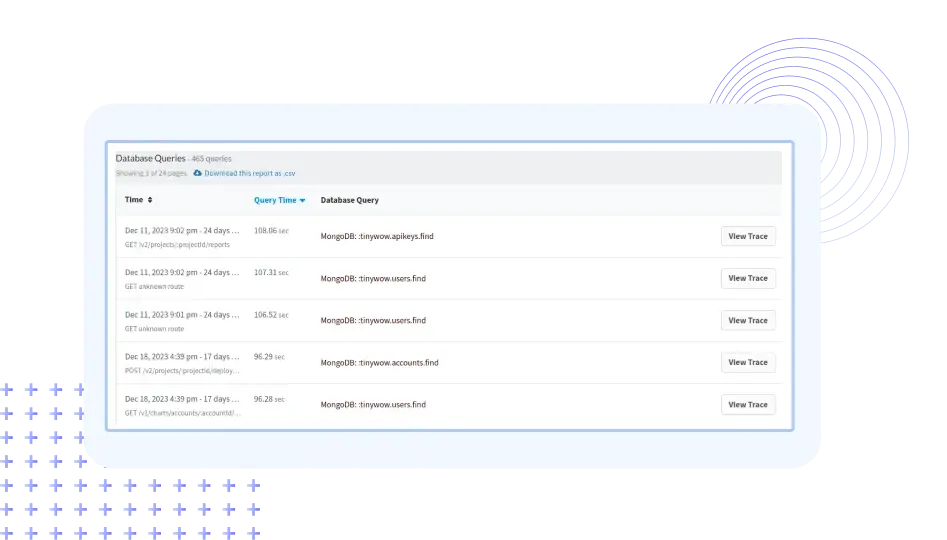
Pinpoint Slow MongoDB Commands Impacting App Performances

Achieve precision in optimizing MongoDB performance by pinpointing slow commands affecting app performance. Our advanced monitoring capabilities allow you to analyze and identify commands with the most significant impact on MongoDB responsiveness. Streamline your MongoDB infrastructure by optimizing these commands, ensuring a faster and more efficient system.

MongoDB Slow Query
DB CallWorkload Analysis

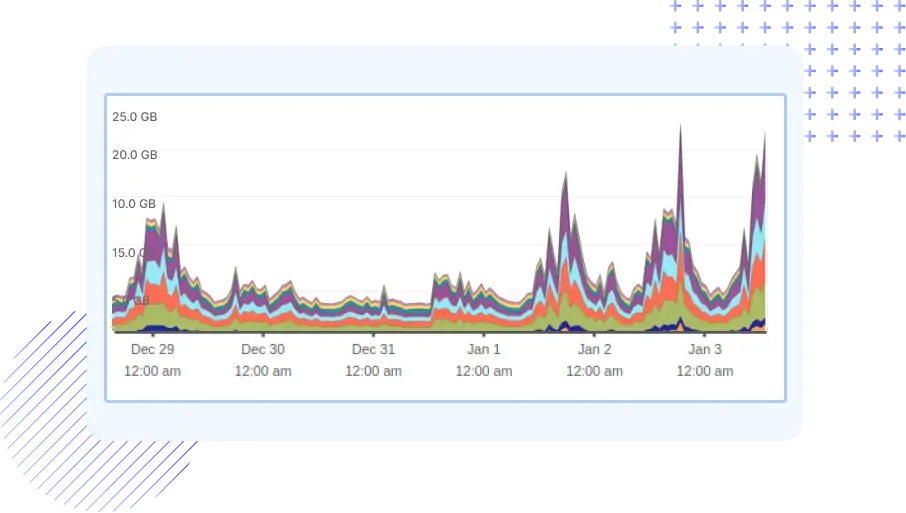
Understand Load Characteristics of MongoDB Instances

Gain precise insights into workload dynamics within MongoDB databases. By tracking and analyzing crucial load characteristics like throughput, response times, and operation rates, you can strategically plan capacity and allocate resources efficiently.

MongoDB Load Analysis
Slow QueryReplica Set

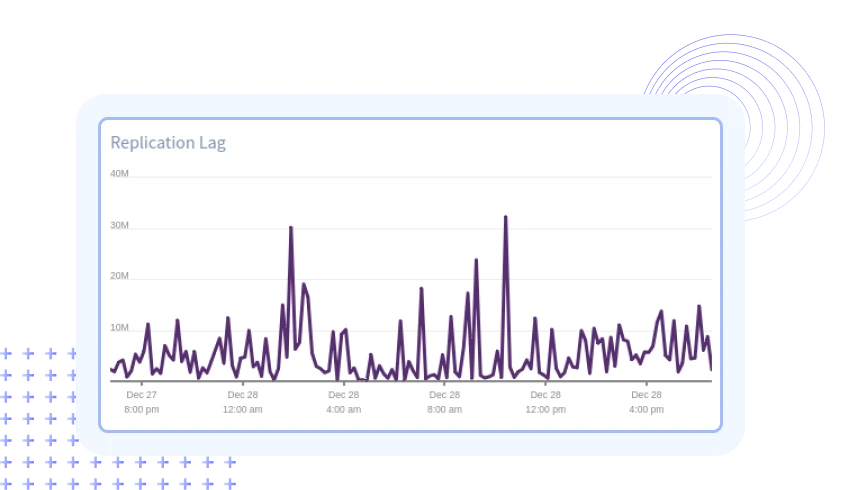
Diagnose and Resolve MongoDB Replica Set Challenges

Monitor real-time replication lag, consistency levels, and node health to uphold the continuous integrity of your data. Proactively detect and swiftly resolve potential issues within MongoDB Replica Sets, ensuring a dependable and resilient database environment.

MongoDB Replica Set Monitoring
Ensure Continuous Database Monitoring Across all SQL and No-SQL Databases

Monitoring your software stack made easy!

Auto Instrumentation

Auto Instrumentation

Utilize industry-leading integrations with libraries and frameworks for in-depth invisibility into Java, PHP, Node.js, Ruby, Python, Go, .NET applications.

Real-time observability

Real-time observability

See data from multiple apps in real time and visualize critical information including transaction performance, error rate, database performance, network calls and more.

Resolve issues quickly

Resolve issues quickly

Quickly identify error and performance issues and fix them by using the context, environment, and more before it affects your customers.

Unlimited applications

Unlimited applications

Track all your application workflow in one place. Add your production, dev, staging, QA to monitor your applications through the complete software development cycle.

Custom Queries

Custom Queries

Get your questions answered. Use custom queries to slice and dice the data by transaction, URL, error, user, browser, host OS and more using performance monitoring.

Built for developers

Built for developers

Designed by developers, for developers and managers to determine when and where your attention is required and enable teams to ship more and fix less.

Smart notifications

Smart notifications

Setup alerts to automatically monitor your applications for increase in response time, API failures, error rate and much more. Get notified through various channels, including Slack, Teams, Email, PagerDuty and more.

Compare releases

Compare releases

Easily compare one time range to another and so on, and identify changes in app behavior and stability with respect to the app releases.

Email digests

Email digests

Don't miss out on your application performance and error stats. Atatus can send you weekly and monthly summaries directly to your inbox.

FAQs on MongoDB Monitoring

What is MongoDB monitoring, and why is it important?

MongoDB monitoring refers to the process of observing and collecting data on the performance, health, and activities of MongoDB databases. It is essential for identifying issues, optimizing performance, and ensuring the overall stability of MongoDB deployments.

What are some important MongoDB metrics to monitor in Atatus?

Key MongoDB metrics to monitor in Atatus include:

  1. Connection statistics: Number of connections, available connections, etc.
  2. Operation counters: Read and write operations.
  3. Memory usage: Resident, virtual, and mapped memory.
  4. Disk I/O: Read and write operations on disk.
  5. Replication lag: Time difference between primary and secondary nodes in a replica set.
Which databases does Atatus support for monitoring?

Atatus supports a wide range of popular databases, including but not limited to MySQL, MS SQL, PostgreSQL, MariaDB, Memcached, Redis, SQLite, and Aerospike. The platform provides integrations and pre-built dashboards tailored to each supported database, allowing users to monitor and analyze their database performance effectively. Whether your application relies on MySQL or a combination of different databases, Atatus provides a unified platform for effective monitoring and optimization.

Can Atatus help with tracking MongoDB queries and performance bottlenecks?

Atatus empowers users with tracing capabilities to actively monitor MongoDB queries and performance. By seamlessly integrating with Application Performance Monitoring (APM), users can correlate data and retrieve comprehensive stack trace information. This integration enables users to actively investigate MongoDB queries, pinpoint slow queries, analyze their impact, and proactively optimize database performance.

Does Atatus support monitoring MongoDB sharded clusters?

Yes, Atatus supports monitoring MongoDB sharded clusters. It provides insights into the performance of individual shards, as well as the overall health of the sharded cluster.

Does Atatus support integration with MongoDB logs?

Yes, Atatus supports Logs Monitoring for MongoDB. You can configure Atatus to collect and analyze MongoDB logs, enabling you to troubleshoot issues, track errors, and gain insights into the database's behavior.

Can I receive alerts for MongoDB issues in Atatus?

Yes, Atatus allows you to set up custom alerts based on specific conditions or thresholds for MongoDB metrics. This ensures that you are notified promptly when there are issues or performance deviations in your MongoDB database.

How long is my MongoDB query metrics available?

Data retention for MongoDB monitoring is set to 7 days by default. This can be changed in your billing settings to 60 or 90 days. Contact our Customer Success Representative if you require a longer retention period.

You're in good company.

You don't have to trust our word. Hear what our customers say!

Atatus is a great product with great support. Super easy to integrate, it automatically hooks into everything. The support team and dev team were also very helpful in fixing a bug and updating the docs.
Tobias
Tobias L
Full Stack Engineer, ClearVoyage
Atatus is powerful, flexible, scalable, and has assisted countless times to identify issues in record time. With user identification, insight into XHR requests to name a few it is the monitoring tool we choose for our SPAs.
Jan Paul
Jan-Paul B
Chief Executive Officer, iSavta
Atatus continues to deliver useful features based on customer feedback. Atatus support team has been responsive and gave visibility into their timeline of requested features.
Daniel
Daniel G
Software Engineer, MYND Management

Ready to see actionable data?

Avail Atatus features for 14 days free-trial. No credit card required. Instant set-up.