MariaDB Monitoring & Observability

Boost MariaDB efficiency by fine-tuning queries, ensuring optimal performance without compromising your database's health.

MariaDB Monitoring
Query TimeQuery Metrics

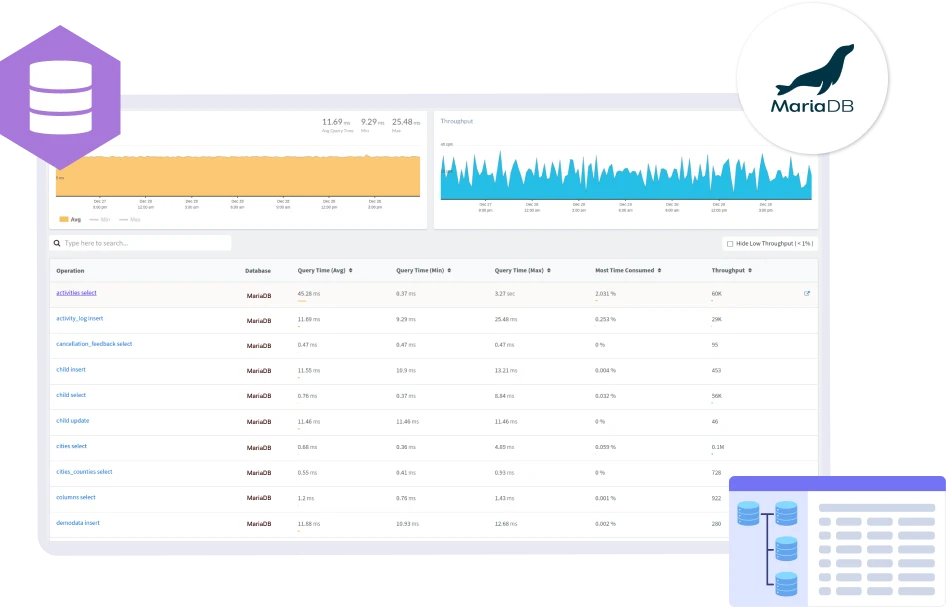
Optimize MariaDB Query Performance

Analyze the root causes of query delays using detailed metrics and profiling techniques. Mitigate denial-of-service threats through connection traffic analysis. Resolve connection leaks to optimize resource usage and enhance MariaDB performance by optimizing long-running queries with detailed execution plans.

MariaDB Query Time
Slow QueryMariaDB Slow Query

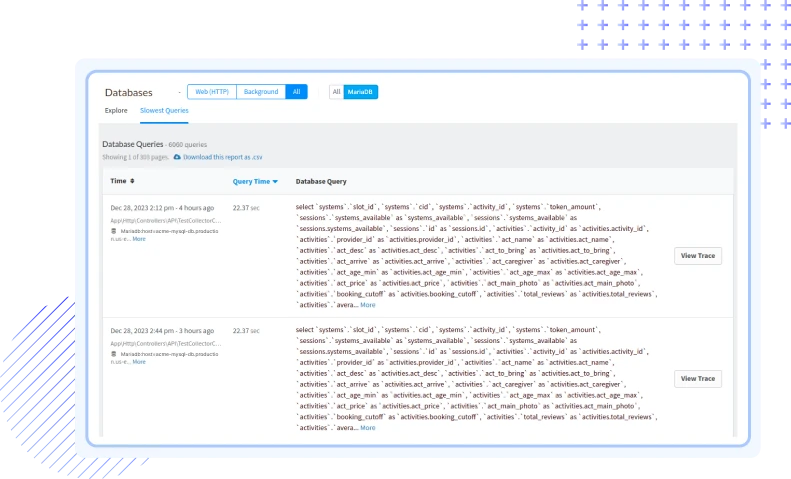
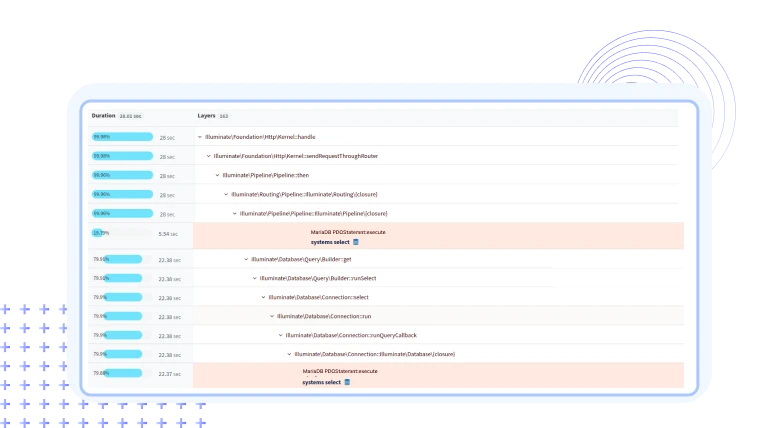
Pinpoint Slow MariaDB Queries

Achieve precision in optimizing MariaDB speed by pinpointing specific queries affecting performance. Our advanced monitoring capabilities allow you to analyze and identify queries with the most significant impact on MariaDB responsiveness. Streamline your MariaDB infrastructure by optimizing the sluggish queries, ensuring a faster and more efficient system.

MariaDB Slow Queries
DB CallLog Events

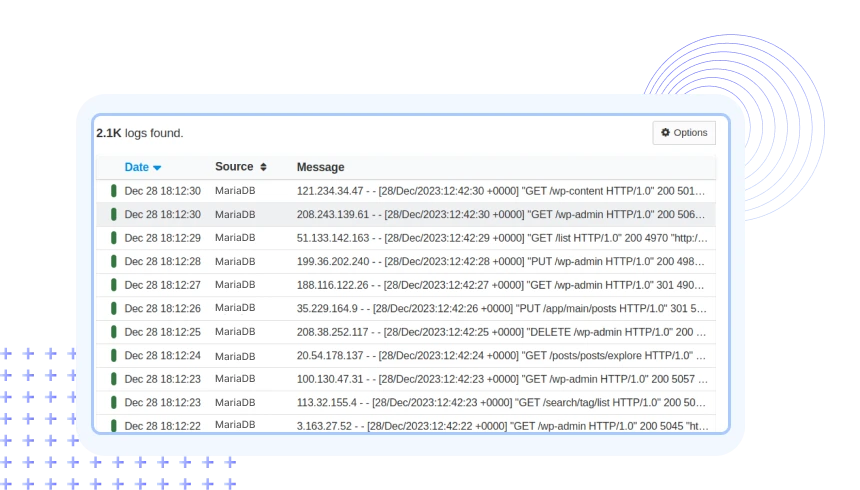
Simplify Troubleshooting with Enriched MariaDB Logs

Streamline log analysis by parsing MariaDB data alongside infrastructure log events, consolidating all information in a centralized hub. Uncover detailed insights into query execution, resource usage, and error conditions to get a holistic perspective on transaction details, index optimizations, and precise timestamp correlations.

MariaDB logs Monitoring
Slow QueryServer Metrics

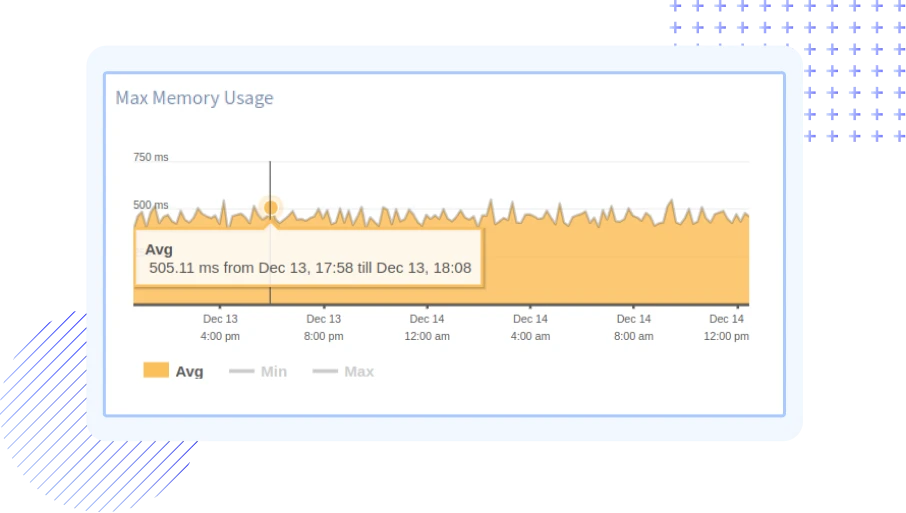
Maximize Performance of MariaDB Server Health

Proactively receive alerts for database growth, ensuring prevention of capacity issues in large tables, and optimizing binary log space. Dive into InnoDB metrics like throughput, IOPS, and log writes to address engine bottlenecks effectively. Simultaneously, monitor InnoDB memory usage to prevent potential capacity issues, enhancing overall MariaDB server performance.

MariaDB Server Performance
Ensure Continuous Database Monitoring Across all SQL and No-SQL Databases

Monitoring your software stack made easy!

Auto Instrumentation

Auto Instrumentation

Utilize industry-leading integrations with libraries and frameworks for in-depth invisibility into Java, PHP, Node.js, Ruby, Python, Go, .NET applications.

Real-time observability

Real-time observability

See data from multiple apps in real time and visualize critical information including transaction performance, error rate, database performance, network calls and more.

Resolve issues quickly

Resolve issues quickly

Quickly identify error and performance issues and fix them by using the context, environment, and more before it affects your customers.

Unlimited applications

Unlimited applications

Track all your application workflow in one place. Add your production, dev, staging, QA to monitor your applications through the complete software development cycle.

Custom Queries

Custom Queries

Get your questions answered. Use custom queries to slice and dice the data by transaction, URL, error, user, browser, host OS and more using performance monitoring.

Built for developers

Built for developers

Designed by developers, for developers and managers to determine when and where your attention is required and enable teams to ship more and fix less.

Smart notifications

Smart notifications

Setup alerts to automatically monitor your applications for increase in response time, API failures, error rate and much more. Get notified through various channels, including Slack, Teams, Email, PagerDuty and more.

Compare releases

Compare releases

Easily compare one time range to another and so on, and identify changes in app behavior and stability with respect to the app releases.

Email digests

Email digests

Don't miss out on your application performance and error stats. Atatus can send you weekly and monthly summaries directly to your inbox.

FAQs on MariaDB Monitoring

What is MariaDB monitoring, and why is it important?

MariaDB monitoring in Atatus refers to the process of using Atatus monitoring and observability tools to track and analyze the performance of MariaDB databases. It allows users to gain insights into database health, query performance, and other critical metrics to ensure optimal operation.

What metrics can I monitor for MariaDB in Atatus?

Atatus MariaDB Monitoring allows you to monitor various MariaDB metrics, including query execution time, database connections, cache hits and misses, replication lag, and server resource utilization. These metrics provide insights into database performance, helping you identify and address potential issues.

Which databases does Atatus support for monitoring?

Atatus supports a wide range of popular databases, including but not limited to MySQL, MS SQL, PostgreSQL, MongoDB, Redis, Memcached, SQLite, and Aerospike. The platform provides integrations and pre-built dashboards tailored to each supported database, allowing users to monitor and analyze their database performance effectively. Whether your application relies on MySQL or a combination of different databases, Atatus provides a unified platform for effective monitoring and optimization.

Is it possible to analyze MariaDB query performance in Atatus?

Absolutely. Atatus provides detailed insights into MariaDB query performance, allowing you to identify slow queries along with the complete stack trace, analyze execution plans, and optimize database performance.

Can I monitor multiple MariaDB instances with Atatus?

Yes, Atatus supports the monitoring of multiple MariaDB instances. You can install the Atatus agent on each server running MariaDB, and the Atatus platform will aggregate and display data for all monitored instances in a centralized dashboard.

How can I set up MariaDB monitoring in Atatus?

To set up MariaDB monitoring in Atatus, you need to install the Atatus Agent on your MariaDB server and configure the MariaDB integration. Atatus provides detailed documentation and step-by-step guides to assist you in the setup process.

Can I receive alerts for MariaDB issues in Atatus?

Yes, Atatus allows you to set up custom alerts based on specific conditions or thresholds for MariaDB metrics. This ensures that you are notified promptly when there are issues or performance deviations in your MariaDB database.

How long is my MariaDB query metrics available?

Data retention for MariaDB monitoring is set to 7 days by default. This can be changed in your billing settings to 60 or 90 days. Contact our Customer Success Representative if you require a longer retention period.

You're in good company.

You don't have to trust our word. Hear what our customers say!

Atatus is a great product with great support. Super easy to integrate, it automatically hooks into everything. The support team and dev team were also very helpful in fixing a bug and updating the docs.
Tobias
Tobias L
Full Stack Engineer, ClearVoyage
Atatus is powerful, flexible, scalable, and has assisted countless times to identify issues in record time. With user identification, insight into XHR requests to name a few it is the monitoring tool we choose for our SPAs.
Jan Paul
Jan-Paul B
Chief Executive Officer, iSavta
Atatus continues to deliver useful features based on customer feedback. Atatus support team has been responsive and gave visibility into their timeline of requested features.
Daniel
Daniel G
Software Engineer, MYND Management

Ready to see actionable data?

Avail Atatus features for 14 days free-trial. No credit card required. Instant set-up.