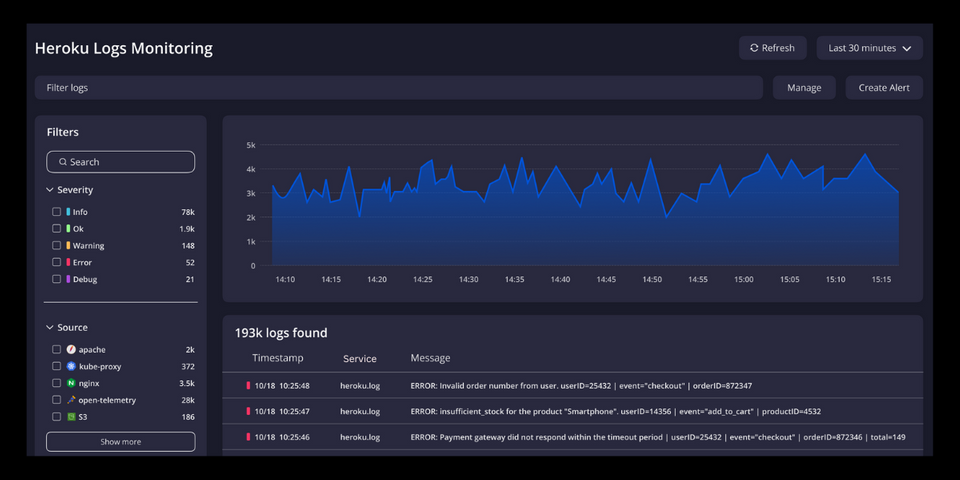
Learn how to effectively monitor Heroku logs to identify errors, optimize performance, and ensure application reliability. Discover best practices, tools, and step-by-step instructions for setting up real-time log monitoring and alerts.
Explore Prometheus histogram buckets, how they work, how to set them up, and their real-world applications. Learn how to configure, monitor, and analyse performance metrics with buckets in this technical guide for DevOps and monitoring.
Discover the exciting new features of PHP 8.4, including readonly classes, the 'json_validate()' function, dynamic callables, and enhanced enums. Learn how these improvements boost performance, improve developer productivity, and enhance security in your PHP applications.
Learn how to effectively find and optimize slow and top queries in MySQL to improve database performance. This blog covers key strategies and explores how Atatus advanced DB monitoring streamlines query optimization for efficient database management.
Unlock ClickHouse's potential with this guide to fixing performance bottlenecks. Learn to resolve slow queries, long merges, CPU/memory issues, and more with actionable steps and a Python script.
Discover how to manage and monitor Heroku logs effectively. Learn about Heroku's logplex, log drains, and how to improve your log management by integrating with Atatus. Optimize your logging strategy for better performance, debugging, and observability.
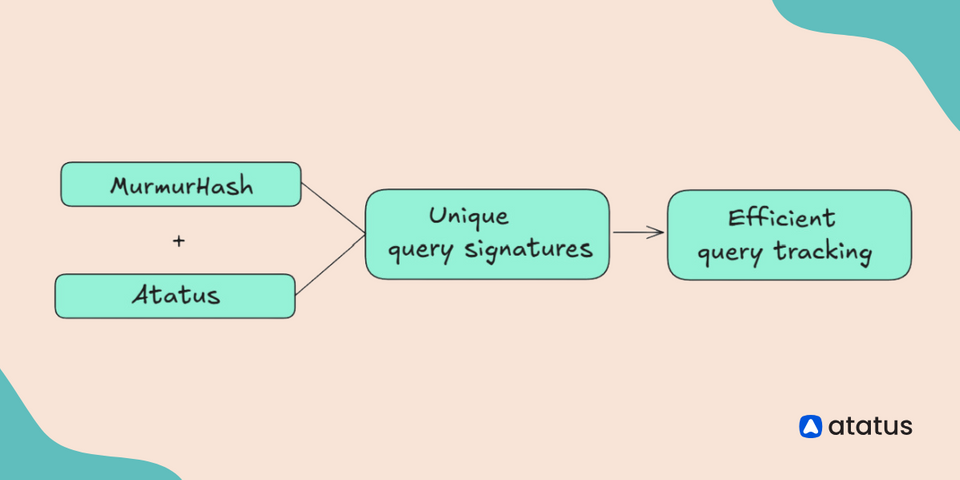
Learn how Atatus uses MurmurHash to create query signatures for effective database monitoring. Explore Atatus tools for tracking query performance, analyzing EXPLAIN plans, and improving database efficiency. Find slow queries, minimize resource usage, and boost performance in real time.
Monitor your entire software stack
Gain end-to-end visibility of every business transaction and see how each layer of your software stack affects your customer experience.