Know Exactly Why Your APIs Are Slow, Failing, or Costing You Customers
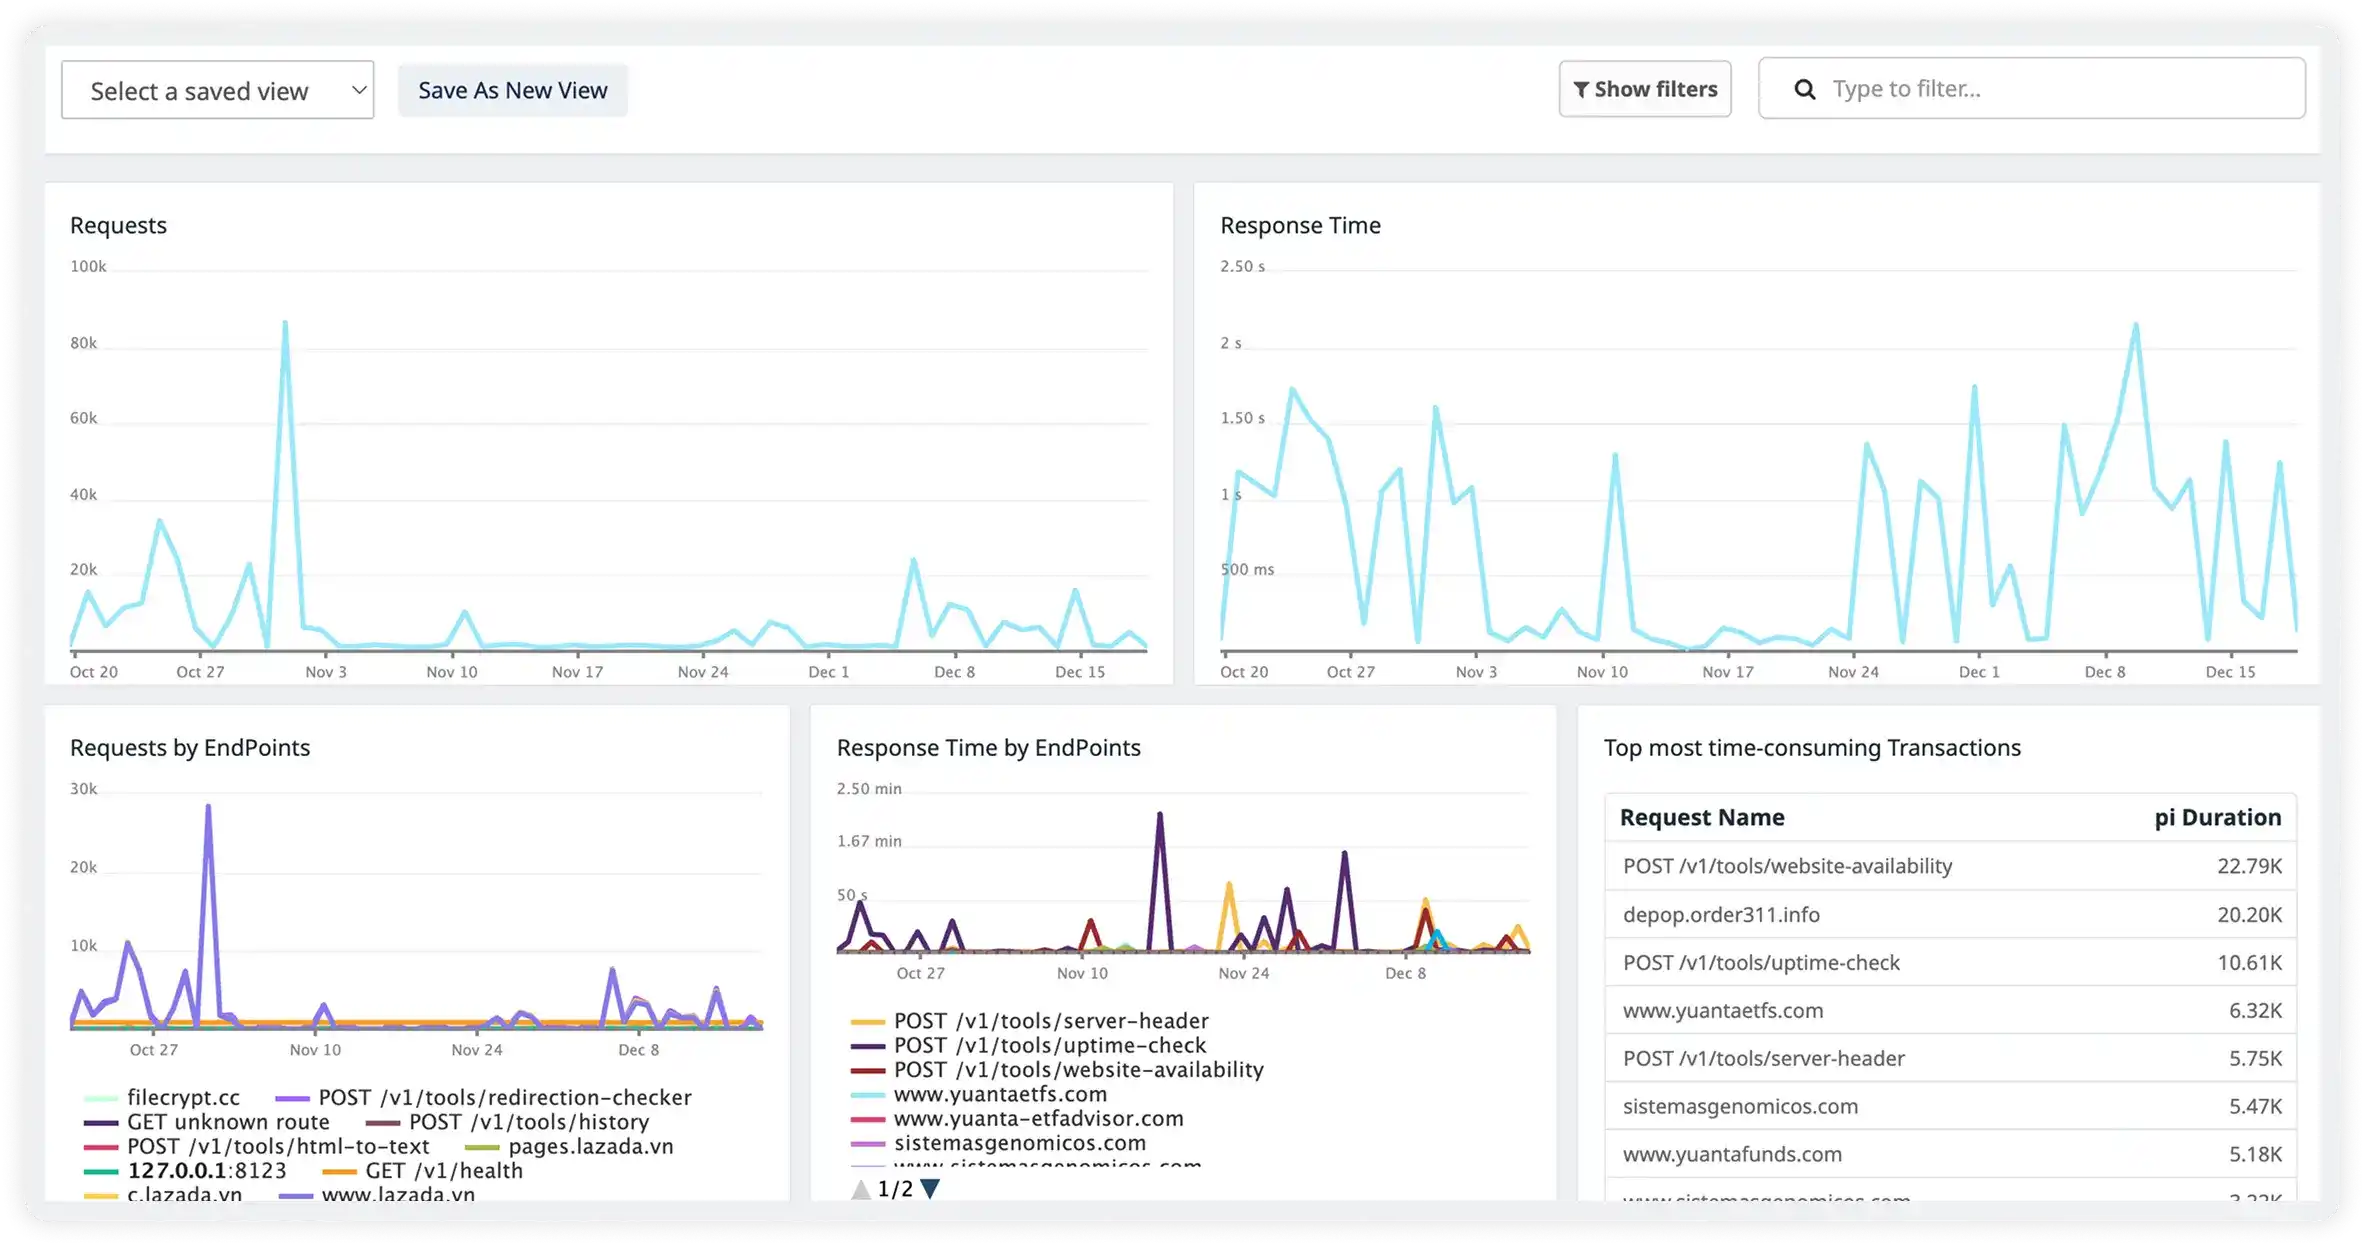
Atatus API Analytics records every request with its headers, bodies and caller, links it to the APM transaction behind it, and shows which endpoint, customer or country is slow or failing.
Open any call. See what was sent.
Request and response bodies, headers and who made the call.
Click an endpoint · sample data
POST /v1/orders1,240 ms{
"error": "payment_unavailable",
"retry_after": 30
}Know who uses your API.
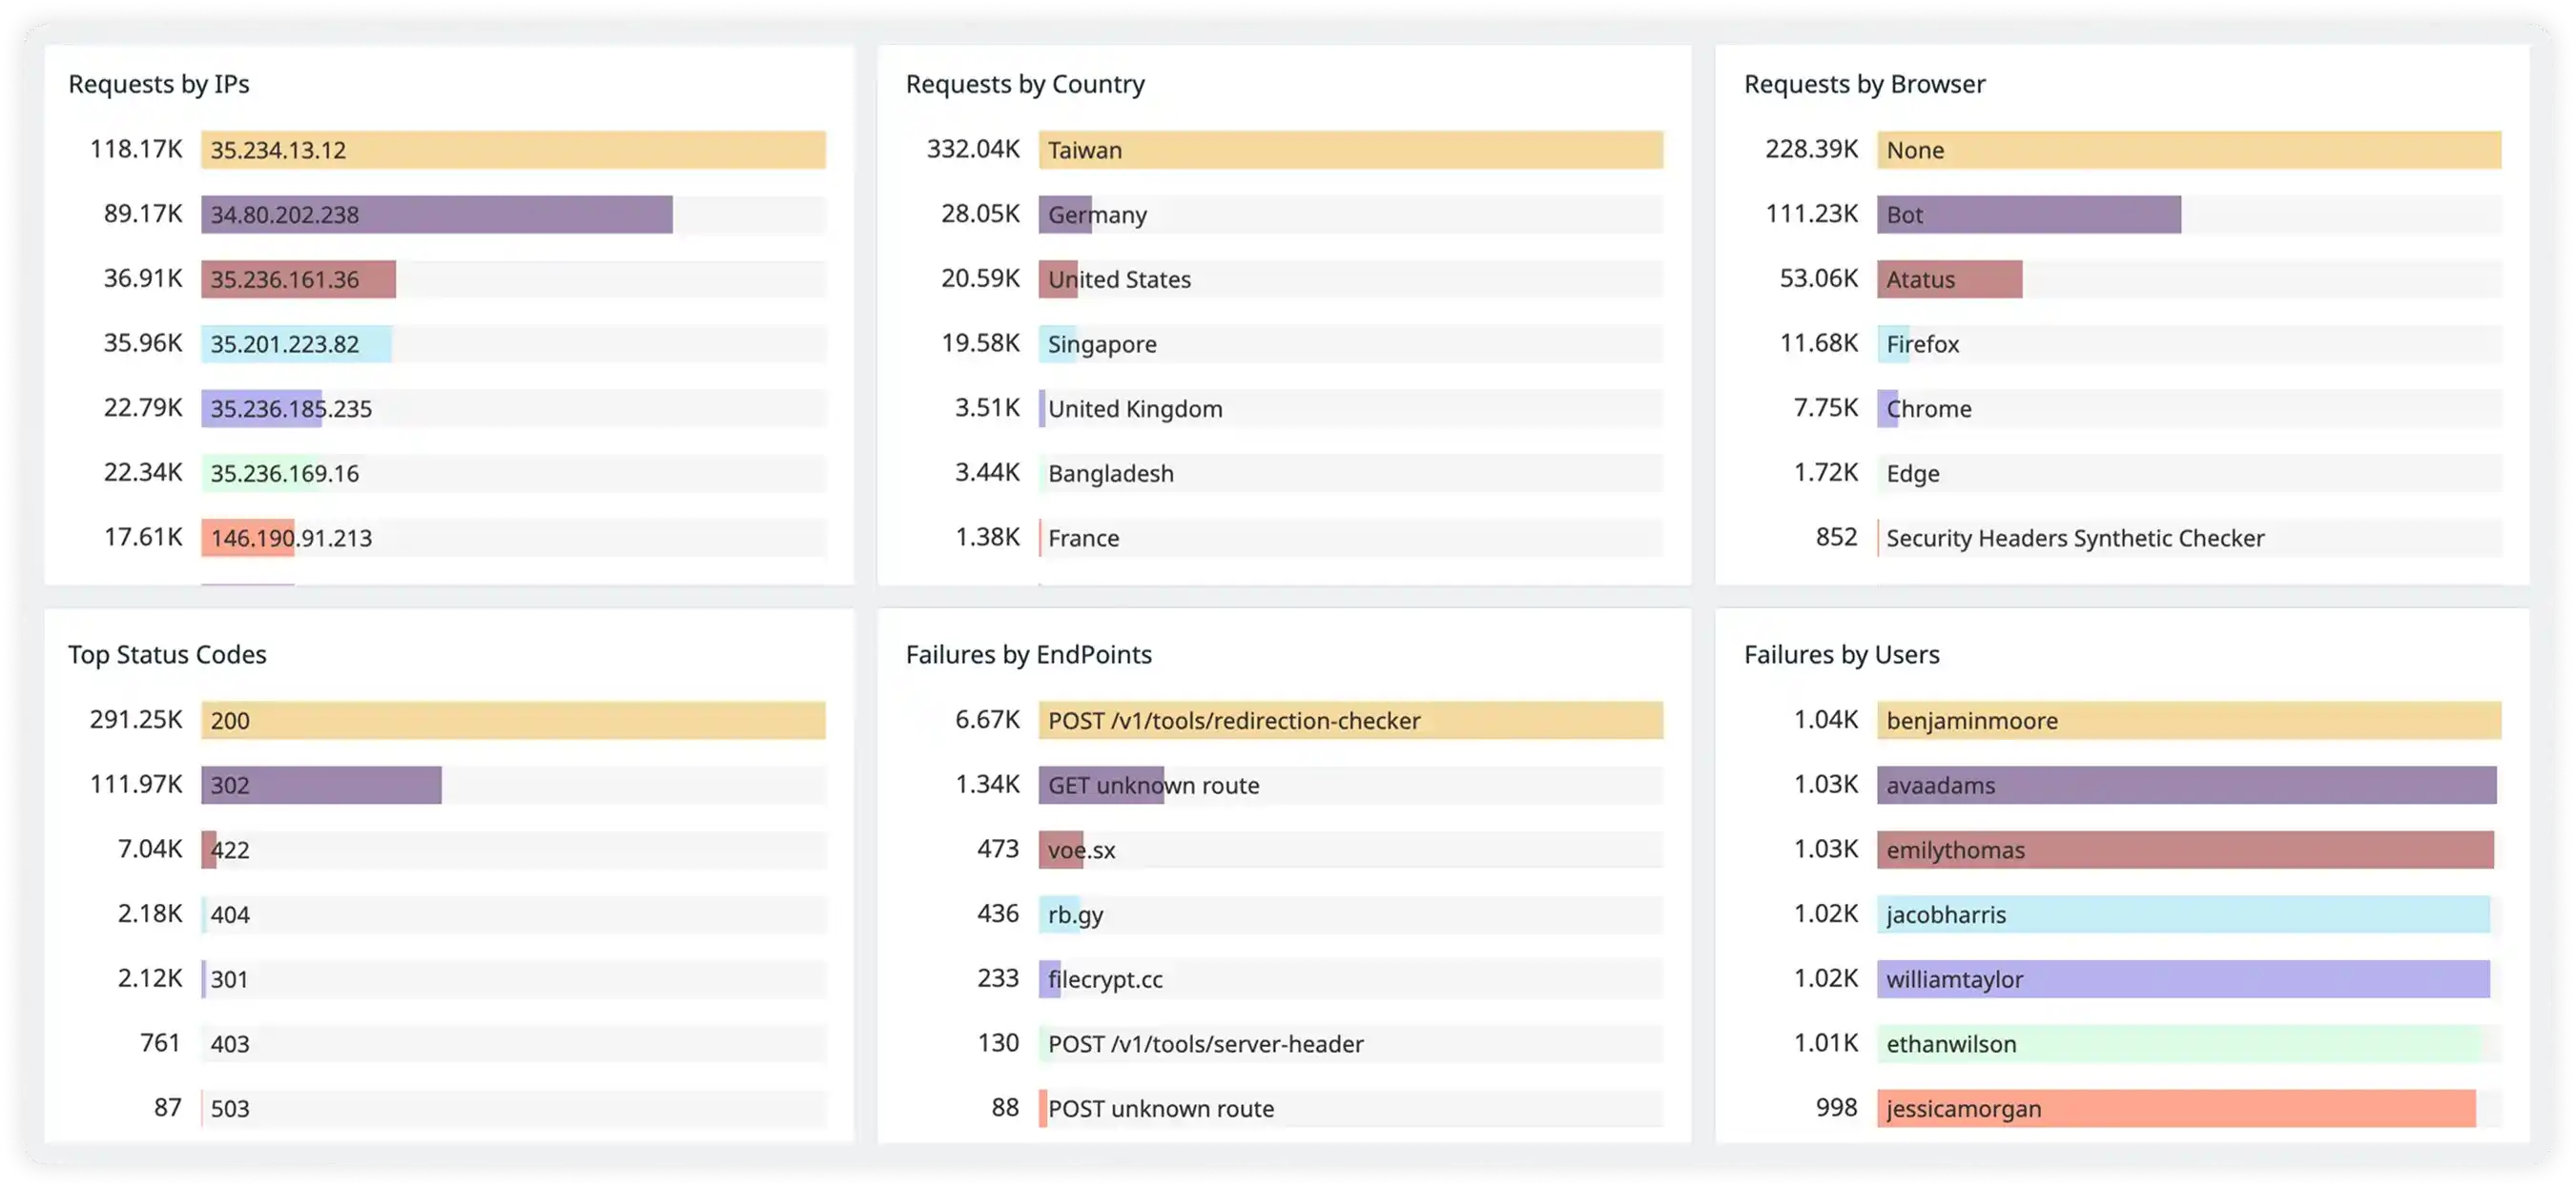
Group traffic by customer, path, country or IP. Read any minute to see who sent it and how it went.
Move across the chart or use the arrow keys · sample data
Click a row to pin its band
Bodies when you need them. Noise left out.
Choose when request and response bodies are kept, and skip the requests you never want to see.
capture_bodyBodies only on requests that failed.
# Java agent
-Datatus.analytics=true
-Datatus.capture_body=errors

// Node.js agent
atatus.setAnalyticsSkip((event) => {
  if (event.name === 'GET /health' ||
      event.name === 'POST /cron/report') return true;
  if (event.responseHeaders['content-type']
      .includes('text/html')) return true;
  return false;
});
Sensitive fields can be masked in the same way with setAnalyticsMask.
- POST
/v1/orders201headers only · application/json - GET
/health200skipped · not sent - POST
/v1/auth/token401{ "error": "invalid_grant" }error event has the body - GET
/v1/products/219200headers only · application/json - GET
/docs200skipped · not sent - POST
/v1/orders502{ "error": "payment_unavailable" }error event has the body - POST
/cron/report200skipped · not sent - GET
/v1/cart200headers only · application/json
Sample requests
In your service. Or at the gateway.
analytics=true
logBody=true
Basic API analytics is on by default. These two enable full capture.
API Analytics, screen by screen.
Real screens from the Atatus app.
Questions engineers ask about API analytics
Pricing, deployment, data and the agent. If something is missing, a person will answer it on a demo call.
API monitoring tells you whether an endpoint is up and fast. API analytics records every request so you can see why it is slow, which endpoints fail most, which customers, countries and IPs call them, and what the request and response looked like. Atatus does both: analytics alerts watch throughput, latency percentiles and 4xx or 5xx counts per endpoint, and the request view lets you open any single call.
API analytics comes with the Atatus APM agents for Node.js, Python, Java, PHP, Ruby and Go. Basic analytics is on by default, and setting analytics=true and logBody=true turns on full capture with request and response bodies. If you would rather capture at the edge, use the Atatus plugin for Kong Gateway or the Lua hooks for OpenResty.
Yes. Analytics alerts evaluate throughput, average, p75, p90 and p95 response time, and 4xx and 5xx failure counts. Group a rule by endpoint path, HTTP method, service or status code category, and every group that crosses the threshold opens its own incident, so one slow endpoint does not hide behind the average.
Every API request is linked to the APM transaction behind it. Open a slow or failed call to see its headers and bodies, then jump to its trace, where the time is split across application code, database queries and external calls. You see which span added the latency instead of searching logs for it.
Yes. Use setAnalyticsMask to change or remove headers, body fields or query parameters before they leave your server, for example to mask a password or a token. Use setAnalyticsSkip to drop requests you never want to see, such as health checks or HTML pages. In the Java agent, capture_body sets when bodies are kept: off, errors, transactions or all.
Yes. Atatus offers an on-premises setup for teams with strict data sovereignty, compliance or security requirements, so request and response data stays in your private network. You receive a Docker-based deployment package and point your Atatus agents at your own server.
If you already run an Atatus APM agent, basic API analytics is on by default. For full capture, set analytics=true and logBody=true in the agent configuration and restart your application. At the gateway, install the Atatus plugin for Kong or add the two OpenResty hooks. Requests then appear with their endpoint, status, duration and caller.