Lost Execution Flow
In live systems, execution paths fragment quickly. Asynchronous work branches across multiple layers, breaking the original flow. When something goes wrong, engineers cannot reconstruct what actually happened end-to-end.
Monitor Node.js applications with real-time APM, distributed tracing, and memory leak detection. Track Express, NestJS, and Fastify performance. Reduce MTTR by 60% with intelligent alerts and database query optimization. Start free trial.
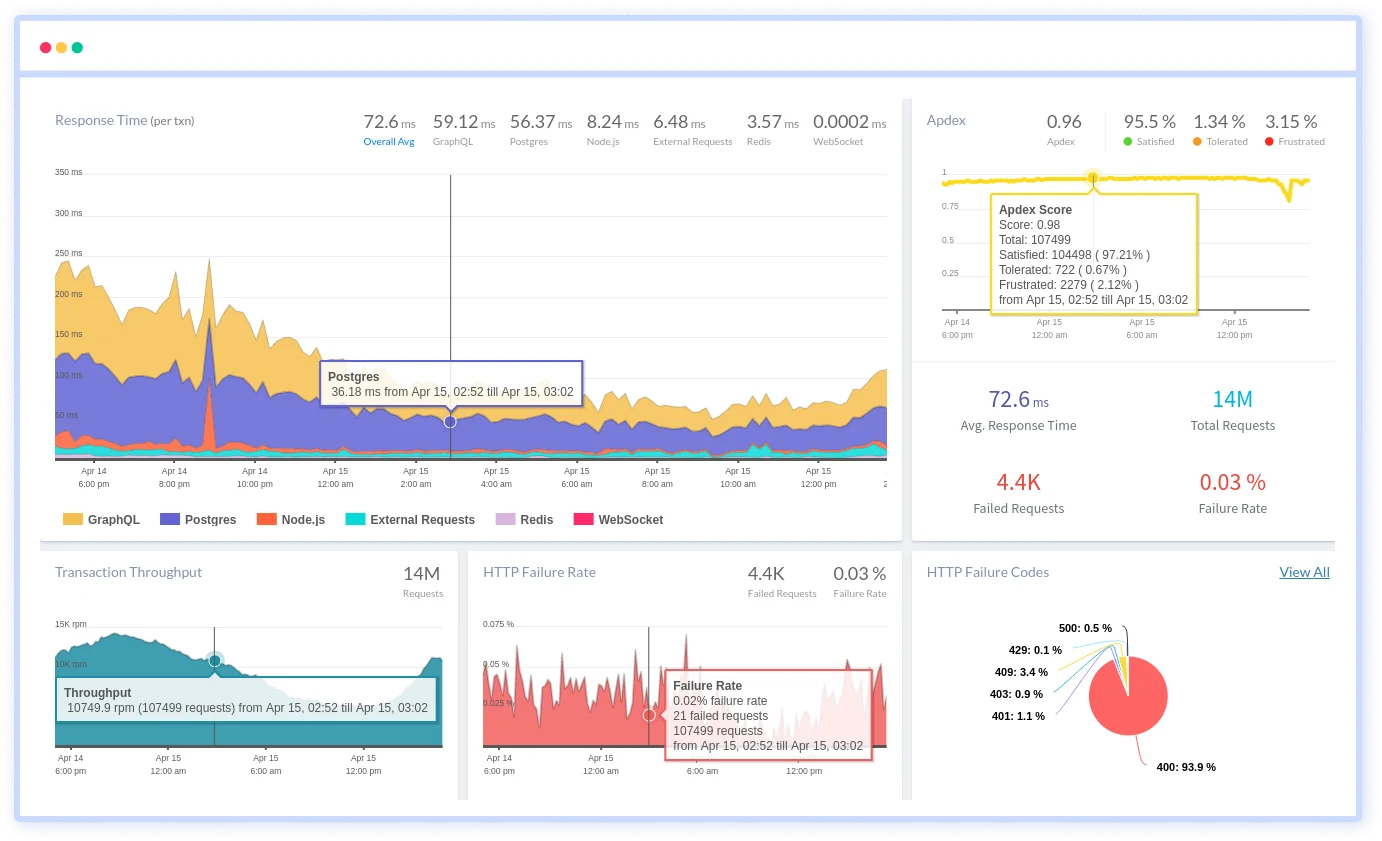
In live systems, execution paths fragment quickly. Asynchronous work branches across multiple layers, breaking the original flow. When something goes wrong, engineers cannot reconstruct what actually happened end-to-end.
Failures surface as isolated signals with little surrounding state. By the time an error appears, the conditions that caused it are already gone, forcing engineers to reason backward with incomplete information.
Slowdowns rarely come from a single hotspot. Latency accumulates quietly across I/O waits, scheduling delays, and external dependencies, making performance issues hard to localize.
Higher throughput amplifies small inefficiencies. Behavior becomes inconsistent under sustained load, increasing variance without making root causes obvious.
Investigation relies heavily on intuition, logs, and past experience. Outcomes depend on who is available rather than on a shared understanding of system behavior.
Service recovery happens faster than explanation. Post-incident analysis drags on long after impact, often ending without clear or actionable conclusions.
Real-world usage introduces patterns never seen in testing. Systems behave differently under real concurrency and data, creating blind spots that only exist in live environments.
Repeated unknowns reduce trust in the system. Teams hesitate to change code, not due to risk in the change itself, but due to uncertainty in runtime behavior.
Real-time observability built for modern Node.js workloads to help teams catch issues faster, improve performance, and ship with confidence.
Track every request across services, APIs, and databases in a single end-to-end trace. Get full visibility into async operations, execution flow, and performance behavior across your Node.js application.
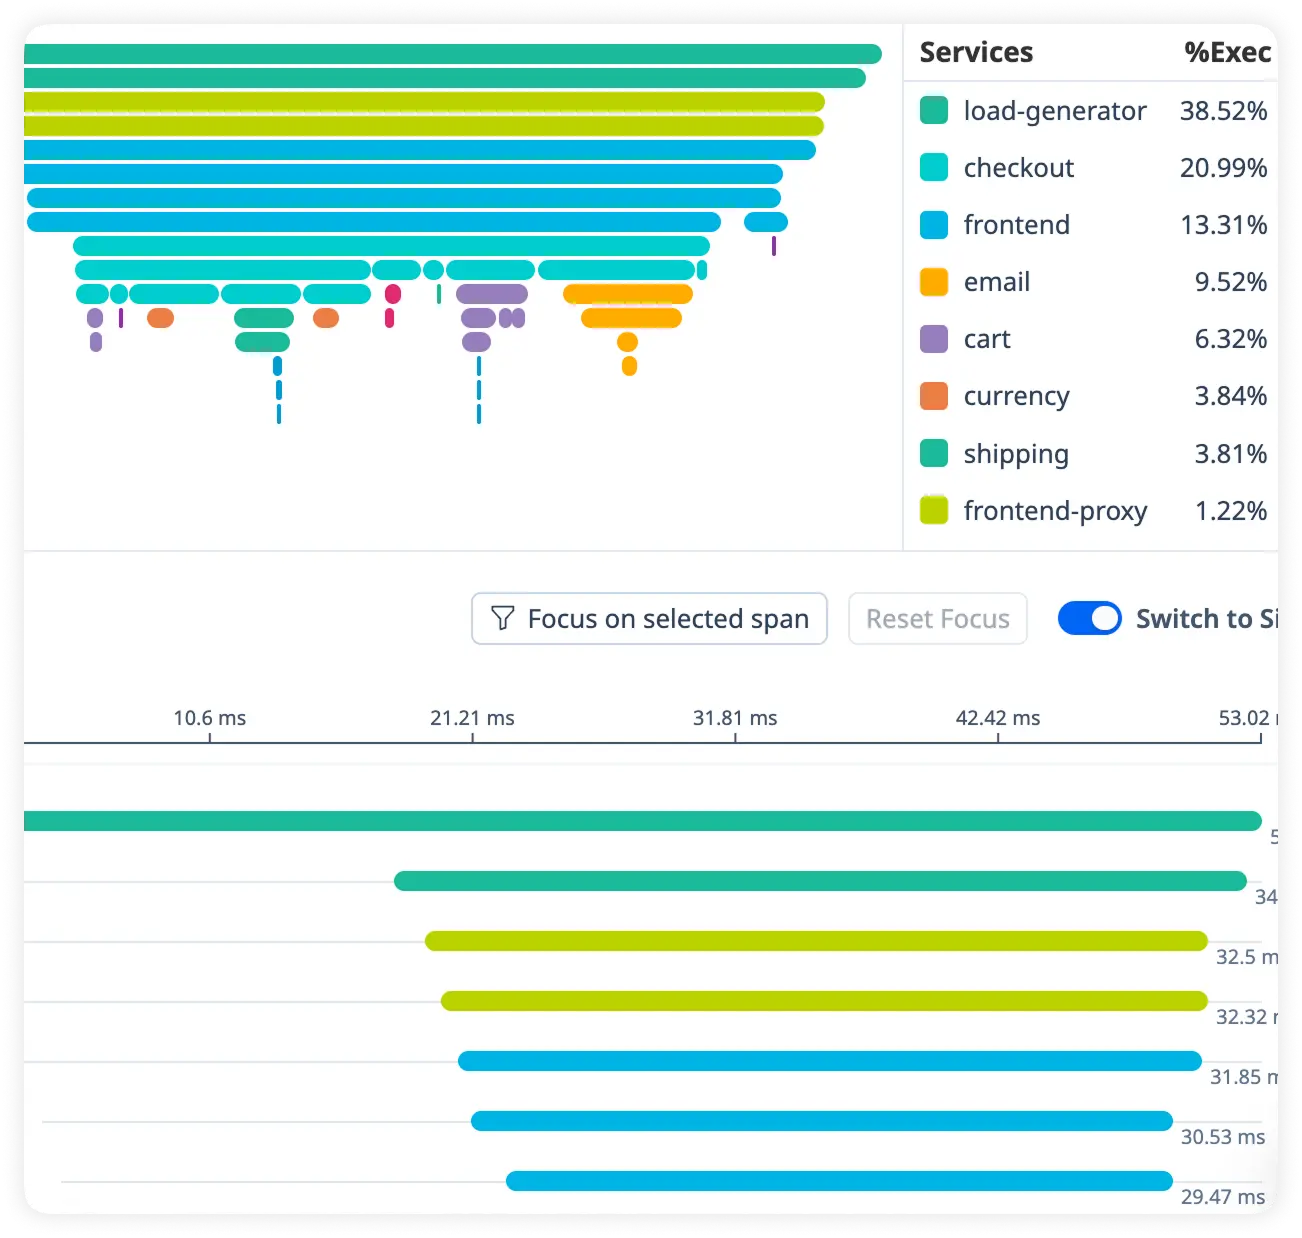
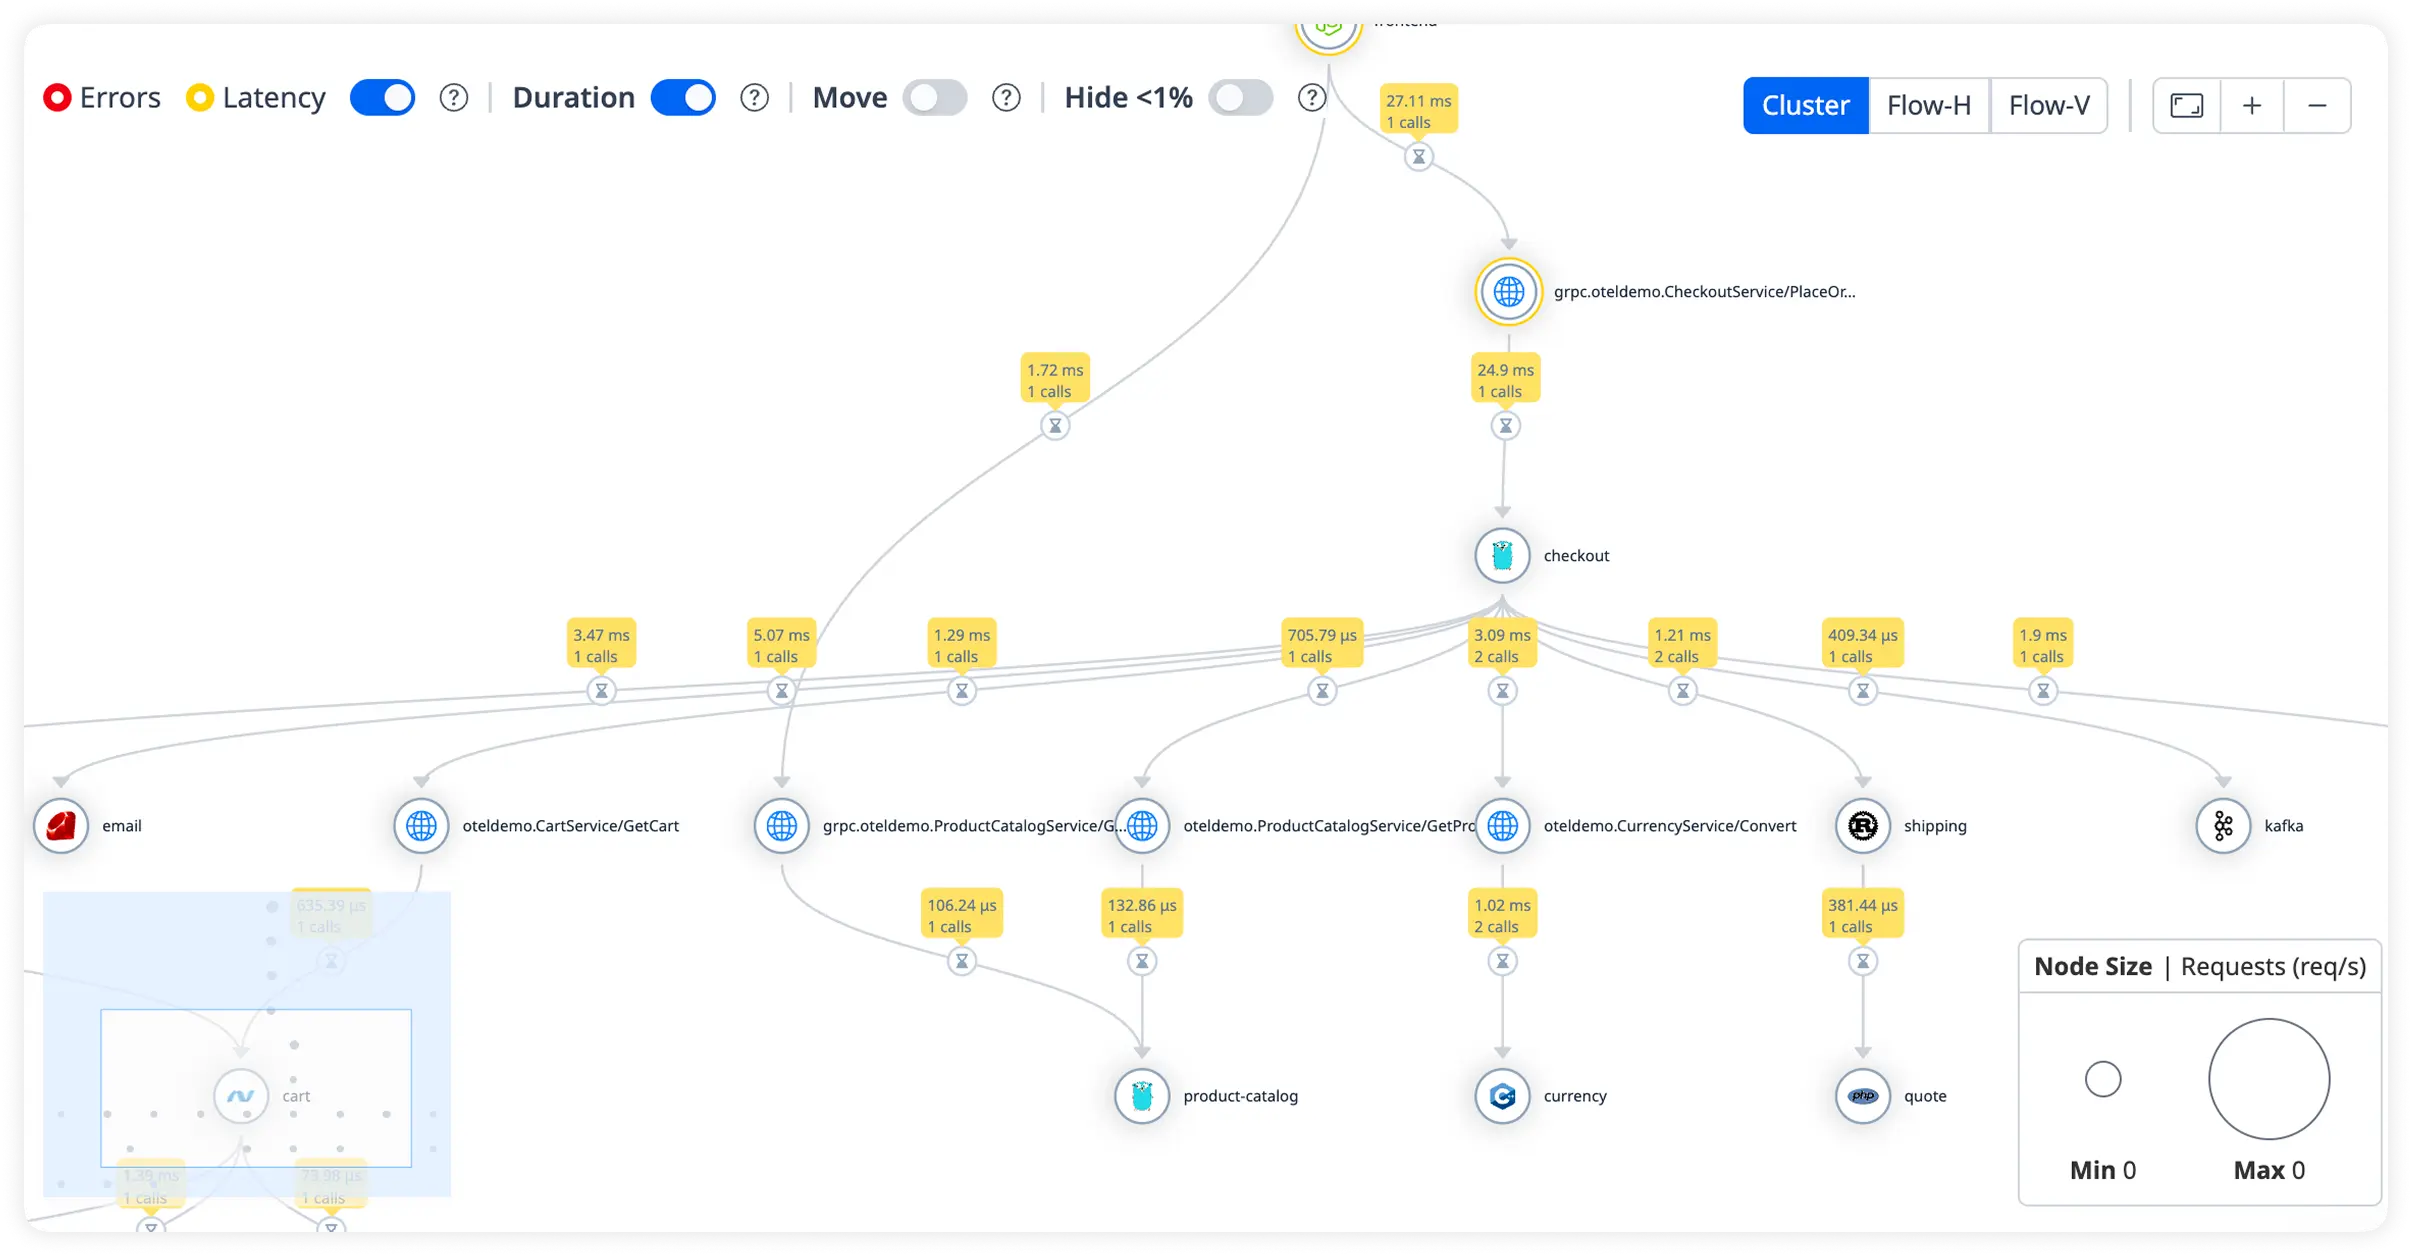
Understand how Node.js services interact with databases, message queues, caches, and external APIs. Identify latency spikes, throughput changes, and failure patterns to eliminate bottlenecks proactively.
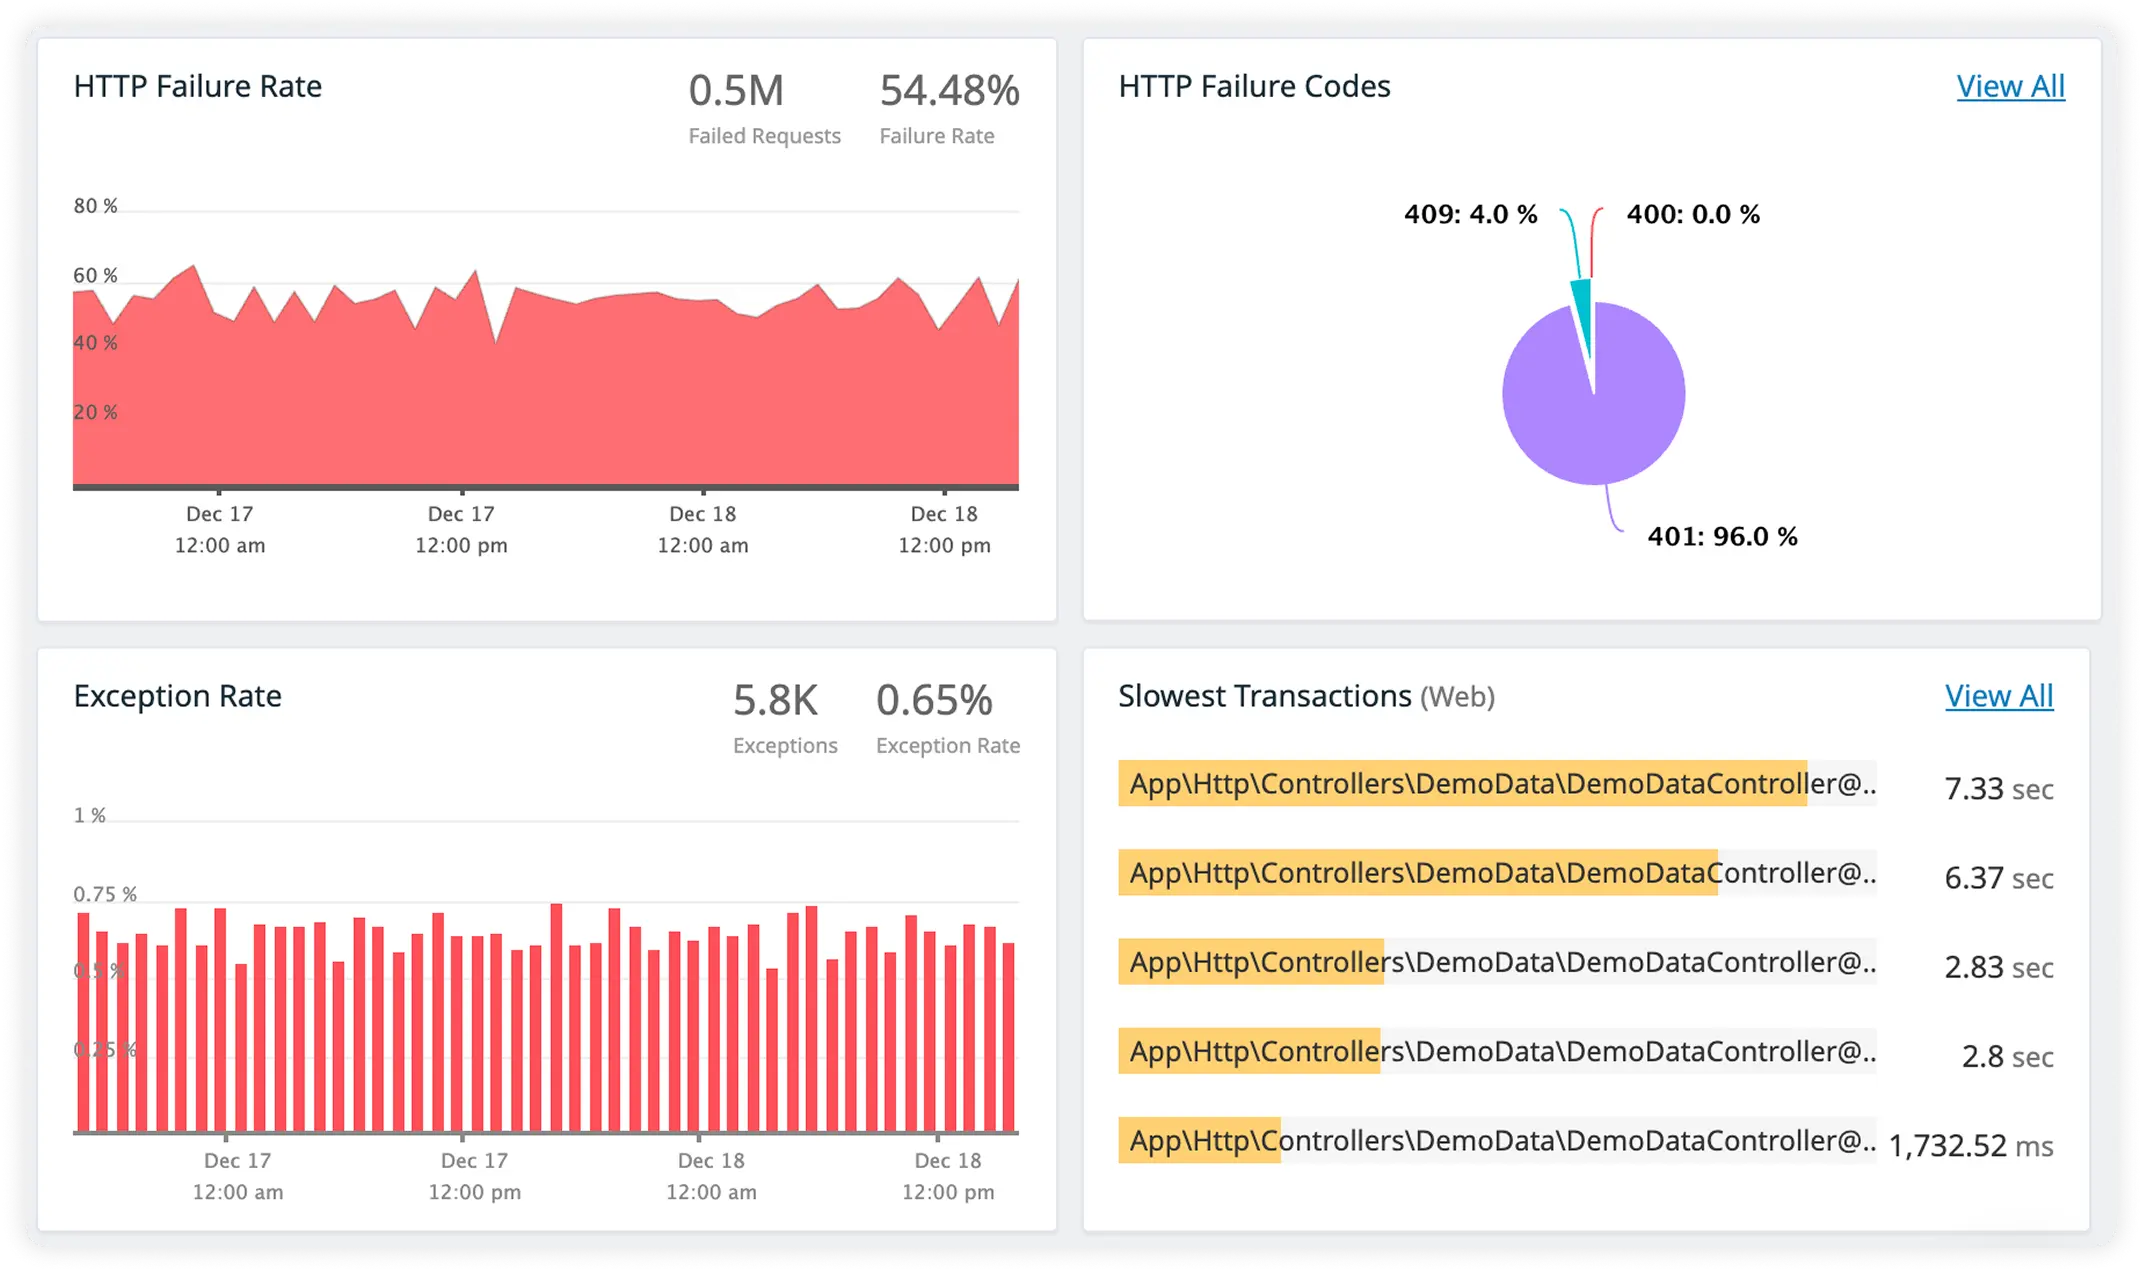
Track high-impact user journeys such as signups, payments, API workflows, and background jobs. Quickly spot slow endpoints, rising error rates, and performance regressions affecting user experience.
Monitor third-party APIs, microservices, and integrations your Node.js apps depend on. Detect slowdowns and outages early to prevent cascading failures in production.
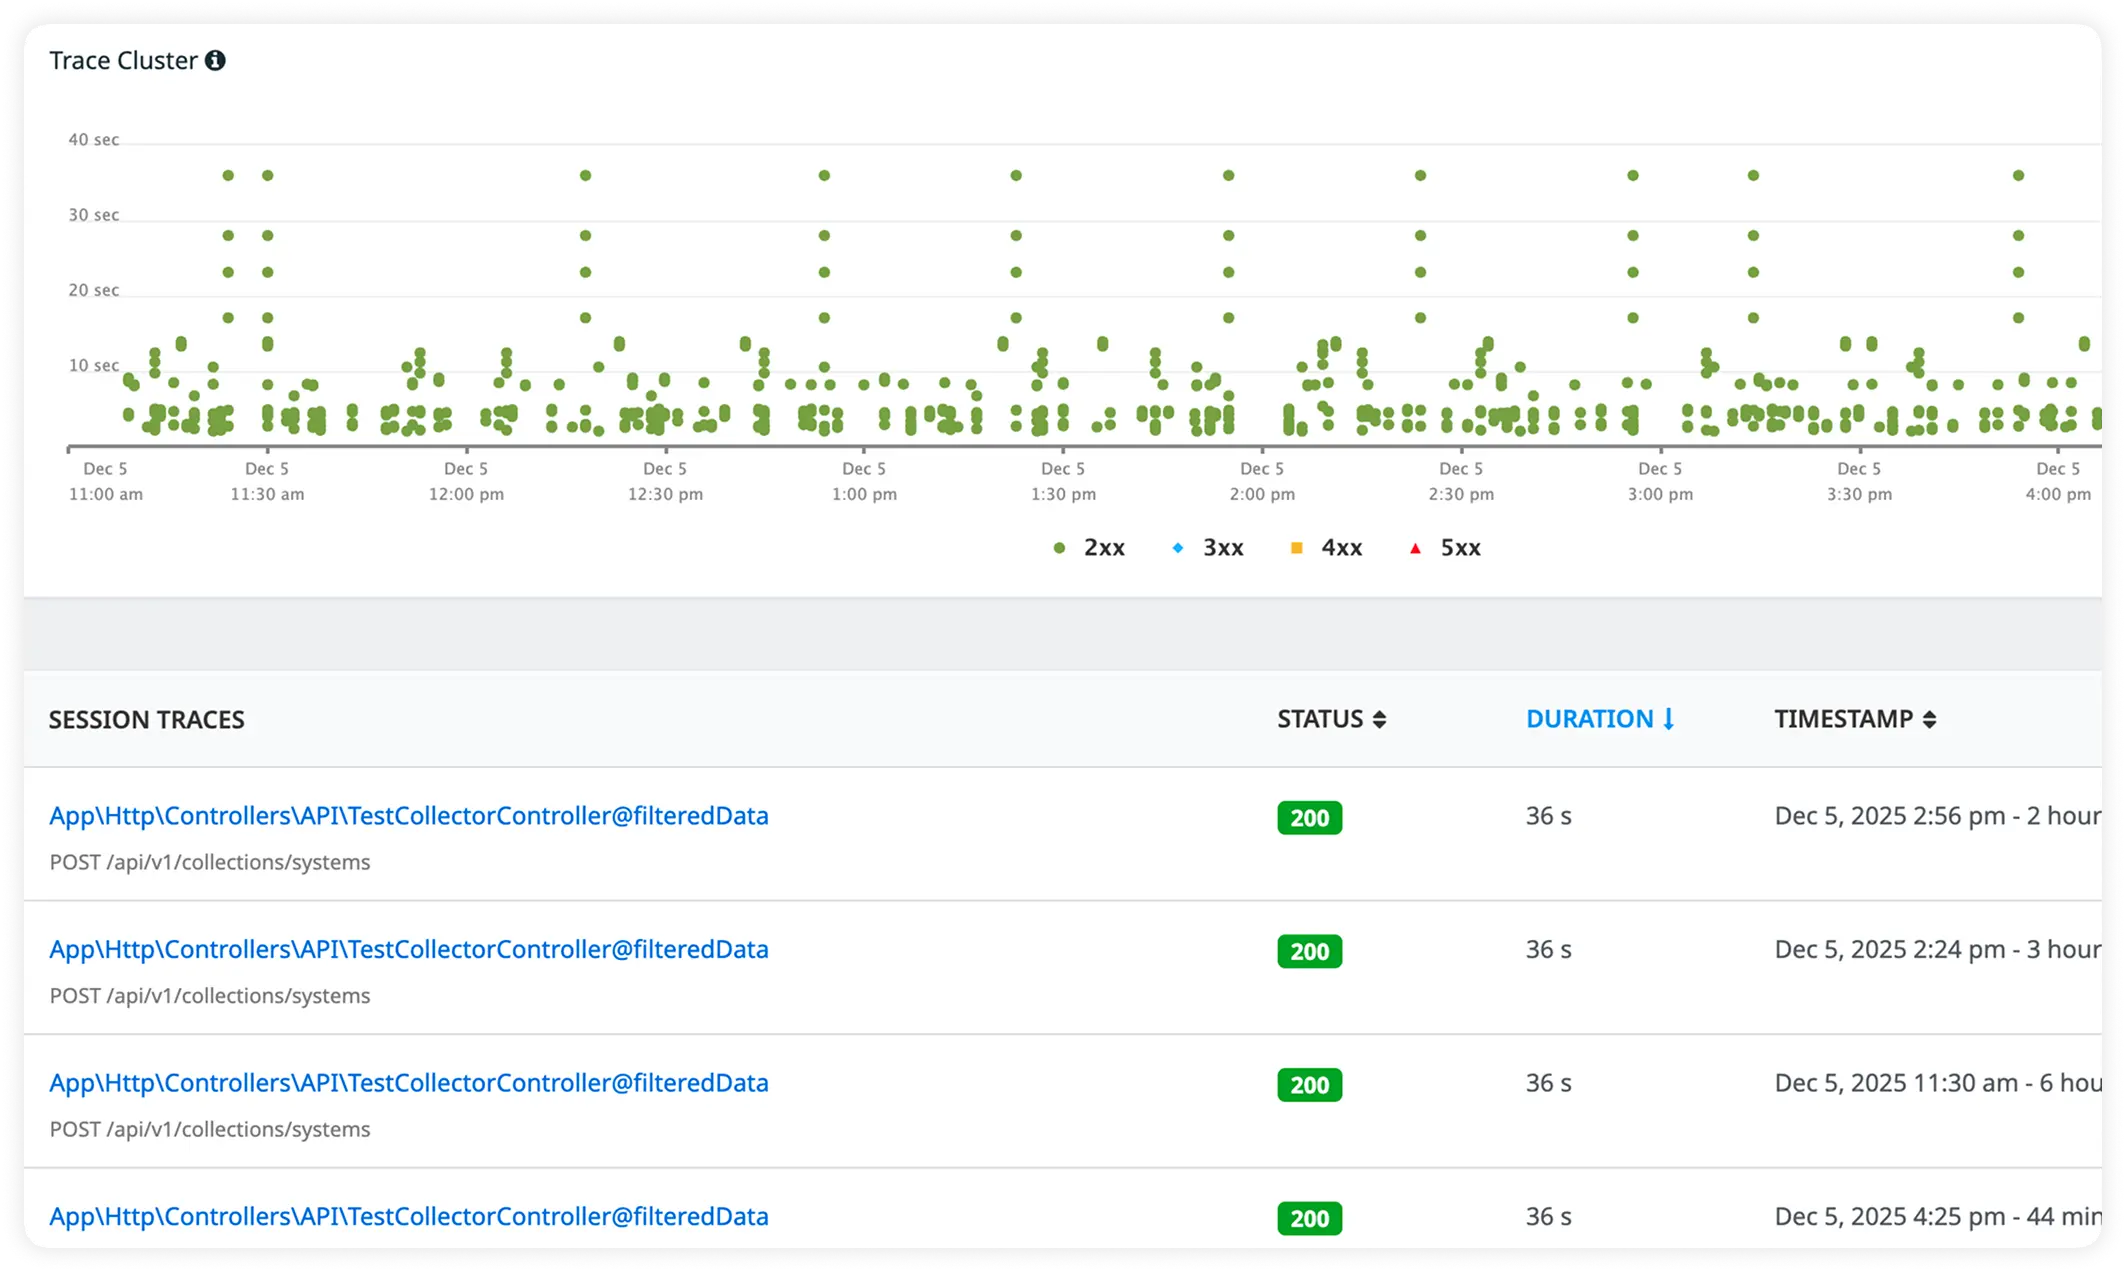
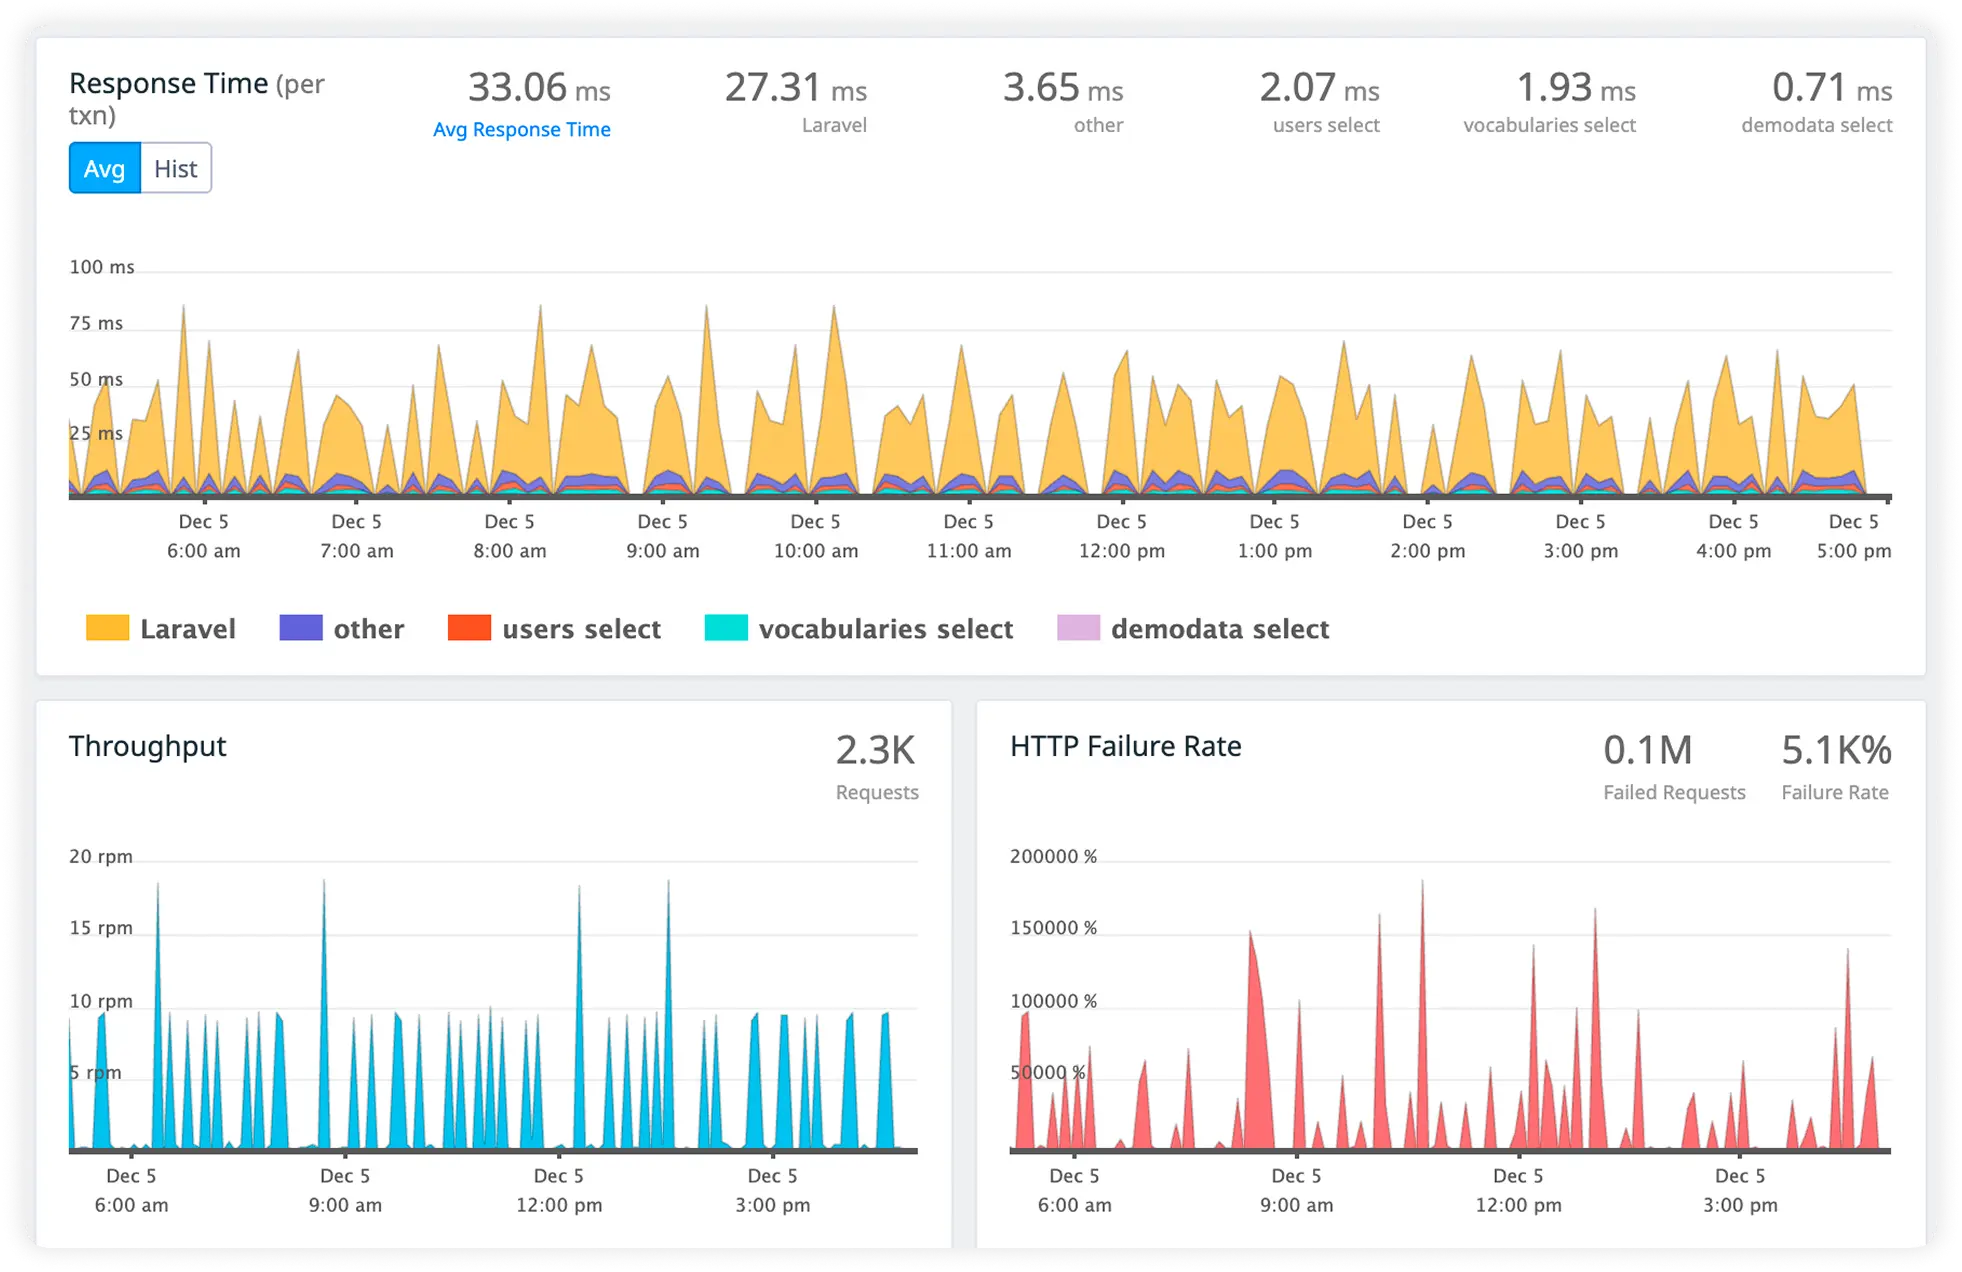
Teams choose Atatus for clear visibility into Nodejs performance without adding complexity to their stack.
Teams want a consistent view of how their Node.js systems behave in production. Atatus aligns engineers around observable reality rather than assumptions.
During incidents, teams need to agree quickly on what is happening. Atatus helps reduce debate and focus attention on what matters.
Engineering tools must fit existing mental models. Atatus resonates with how Node.js engineers reason about execution, state, and failure.
Teams prefer to debug directly from real behavior instead of recreating issues locally. Atatus supports reasoning from production conditions.
Consistency builds confidence. Engineers rely on Atatus because it reflects what they see in real outcomes.
As systems grow more complex, maintaining clarity becomes harder. Atatus helps teams preserve simple mental models across expanding architectures.
Engineers with different experience levels can reach the same conclusions without relying on undocumented knowledge or individual memory.
Understanding reduces hesitation. Teams move faster when decisions are grounded in clear system behavior.
Atatus is chosen for long-term reliability. Teams spend less time firefighting and more time improving their systems.
Atatus adapts to how engineering teams work across development, operations, and reliability.
Debug errors and slow paths with the full context of what happened.
Atatus for developersTrack deployments and see how each release affects stability.
Atatus for DevOpsWatch latency and error rates to ship with less production risk.
Atatus for release engineersPricing, deployment, data and the agent. If something is missing, a person will answer it on a demo call.
To measure Node.js performance, you can use performance monitoring tools such as Node.js APM. These tools provide insights into metrics like:
Atatus offers comprehensive Node.js APM capabilities, giving you real-time visibility into these metrics and helping you efficiently detect and resolve performance bottlenecks.
Improving Node.js performance involves:
Yes, Atatus integrates seamlessly with popular Node.js frameworks like Express, Nest.js, Restify, and more. It also automatically instruments and monitors specific libraries and components to provide comprehensive performance insights.
Node.js APM offers several benefits:

