Query Plan Analysis
Analyzes execution plans, index scans, and sequential scans to detect inefficient SQL execution paths.
From slow queries and lock contention to replication health and resource utilization, everything you need to optimize PostgreSQL performance.

Analyzes execution plans, index scans, and sequential scans to detect inefficient SQL execution paths.
Tracks row, table, and advisory locks that cause transaction blocking and latency spikes.
Monitors active sessions, idle transactions, and max connection limits.
Observes vacuum frequency, table bloat growth, and dead tuple accumulation.
Measures WAL generation rate and replica replay delay affecting data consistency.
Tracks shared buffer cache effectiveness and disk read dependency.
Captures PostgreSQL errors related to crashes, checkpoints, and replication.
Analyzes CPU, memory, and disk IO consumption under transactional workloads.
Understand performance across execution plans, transactions, memory, and I/O.
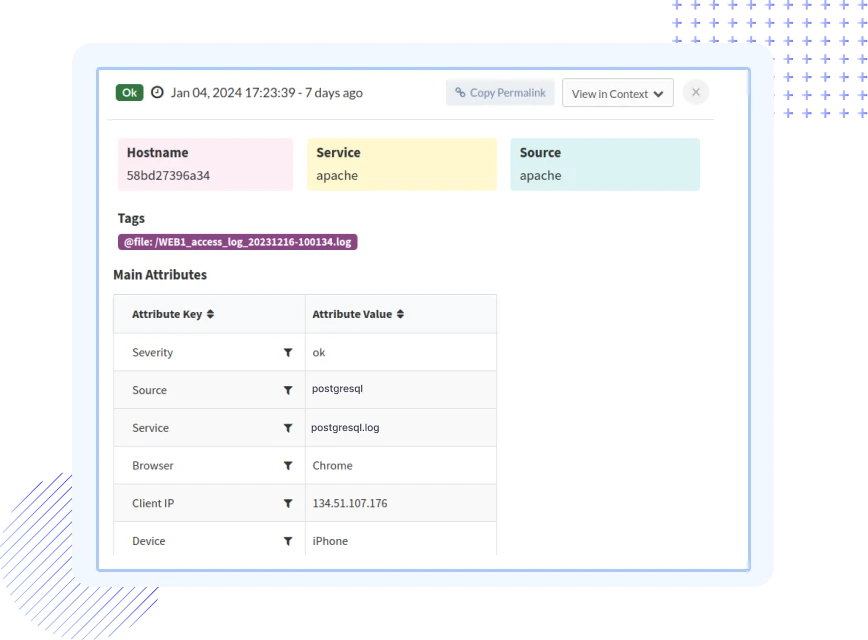
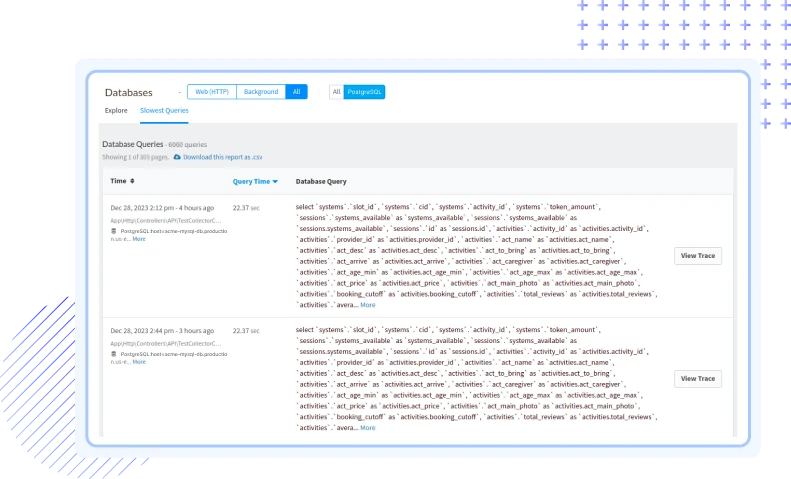
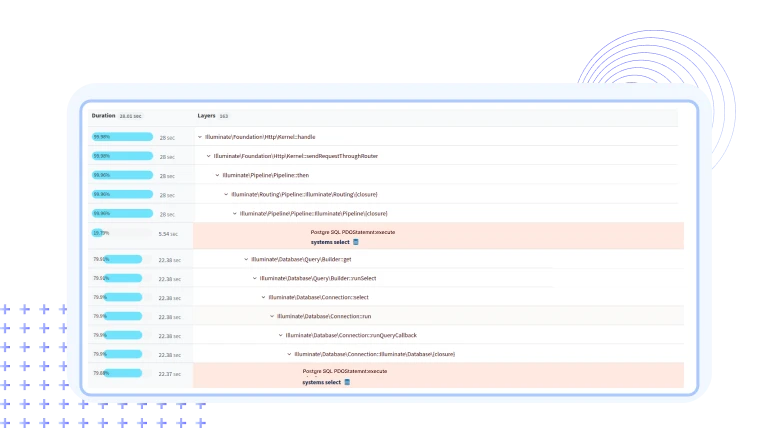
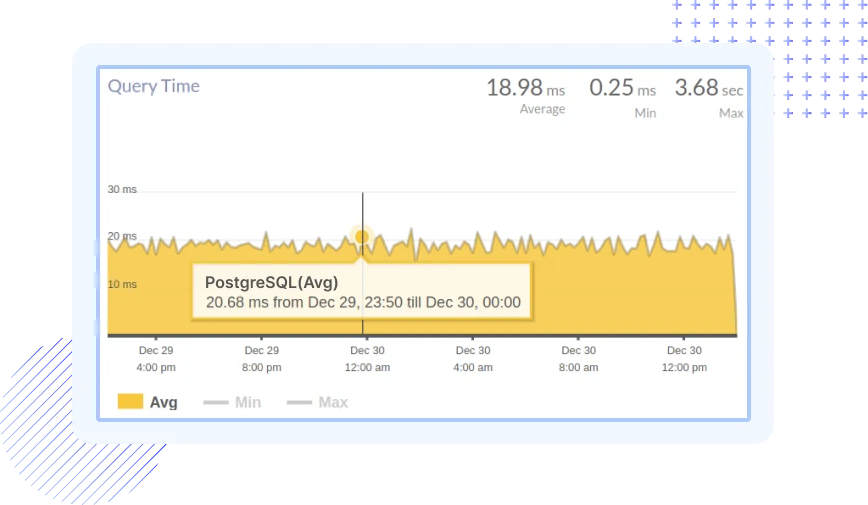
Analyze query plans, index usage, and sequential scans to spot inefficient execution paths.
Monitor row, table, and advisory locks to identify blocking transactions quickly.
Track vacuum cycles, dead tuples, and table bloat to keep queries fast.
Monitor WAL generation rates and replica replay lag for synchronization stability.
Track idle sessions, long-running queries, and connection limits to prevent overload.
Link database activity with CPU, memory, and disk usage for faster root cause analysis.
Atatus adapts to how engineering teams work across development, operations, and reliability.
Debug errors and slow paths with the full context of what happened.
Atatus for developersTrack deployments and see how each release affects stability.
Atatus for DevOpsWatch latency and error rates to ship with less production risk.
Atatus for release engineersPricing, deployment, data and the agent. If something is missing, a person will answer it on a demo call.
PostgreSQL monitoring involves the systematic observation and analysis of various performance metrics and parameters within a PostgreSQL database. It is crucial for ensuring the optimal performance, availability, and reliability of PostgreSQL instances. Monitoring allows you to detect and address potential issues, optimize resource usage, and maintain the overall health of your PostgreSQL databases, which are fundamental components of many web applications.
Monitoring PostgreSQL with Atatus offers a comprehensive solution for gaining deep insights into the performance of your PostgreSQL databases. Atatus provides real-time visibility, customizable dashboards, and intelligent alerting capabilities, allowing you to proactively manage and optimize PostgreSQL instances. With Atatus, you can ensure high availability, quickly troubleshoot issues, and streamline the performance of your PostgreSQL-powered applications.
Important PostgreSQL metrics to monitor include:
Atatus supports a wide range of popular databases, including but not limited to MySQL, MS SQL, PostgreSQL, MongoDB, MariaDB, Redis, Memcached, SQLite, and Aerospike. The platform provides integrations and pre-built dashboards tailored to each supported database, allowing users to monitor and analyze their database performance effectively. Whether your application relies on MySQL or a combination of different databases, Atatus provides a unified platform for effective monitoring and optimization.
Atatus provides Query Performance Monitoring, allowing you to identify slow queries, view query plans, and assess overall query performance. With this information, you can optimize queries for better database efficiency.
Yes, Atatus is designed to monitor PostgreSQL databases in both traditional and distributed environments. It supports monitoring across on-premises, cloud, and hybrid infrastructure, providing a unified view of your PostgreSQL performance regardless of the deployment model.
Atatus supports various notification channels, including email, Slack, PagerDuty, and others. You can configure alerting policies with specific thresholds and conditions to receive timely notifications when PostgreSQL metrics deviate from expected values.
Data retention for PostgreSQL monitoring is set to 7 days by default. This can be changed in your billing settings to 60 or 90 days. Contact our Customer Success Representative if you require a longer retention period.


