
Monitor Kubernetes with Full Context Across Nodes, Pods, and Services
Atatus monitors every cluster, node, pod, container, and workload in your Kubernetes environment like connecting metrics, logs, events, and traces so your team can diagnose and resolve incidents in minutes, not hours.
<5min
Time to first insight after install
70%
Faster mean time to resolution
99.9%
Crash-free session rate achievable
Full Kubernetes Observability for Engineering Teams
From CrashLoopBackOff diagnostics to cost-per-namespace reporting, Atatus surfaces the full picture of Kubernetes health in one place.
Real-Time Kubernetes Resource Monitoring
Track CPU usage, memory consumption, and network throughput across every node and pod as it happens. Catch resource pressure before it triggers OOMKills or pod evictions that silently degrade service performance.
Kubernetes Traffic Analytics and Throughput
Understand request volume, latency distribution, and error rates at the service and workload level. Identify which deployments are under load and which are consuming resources without serving meaningful traffic.
Service Dependency Visibility
Map how pods, deployments, and services communicate across namespaces and clusters. Detect broken service dependencies and cascading failures before they surface as user-facing errors.
Performance Trends Over Time
Track resource utilization and workload behavior across time windows from 30-minute spikes to 30-day capacity trends. Use historical data to plan autoscaling thresholds and identify recurring performance patterns.
Root Cause Analysis for Kubernetes Incidents
When a pod crashes or a deployment rolls back, Atatus surfaces correlated events, logs, and trace data in a single investigation flow. Engineers spend time fixing problems, not hunting for context across disconnected tools.
Engineer-Ready Kubernetes Dashboards
Pre-built dashboards for clusters, nodes, namespaces, workloads, and cost show the right data for the right audience from on-call SREs to engineering managers reviewing resource spend.
Everything You Need to Monitor Your Kubernetes Clusters
Connected metrics, logs, events, and traces give your team the context needed to understand what's wrong and fix it fast.
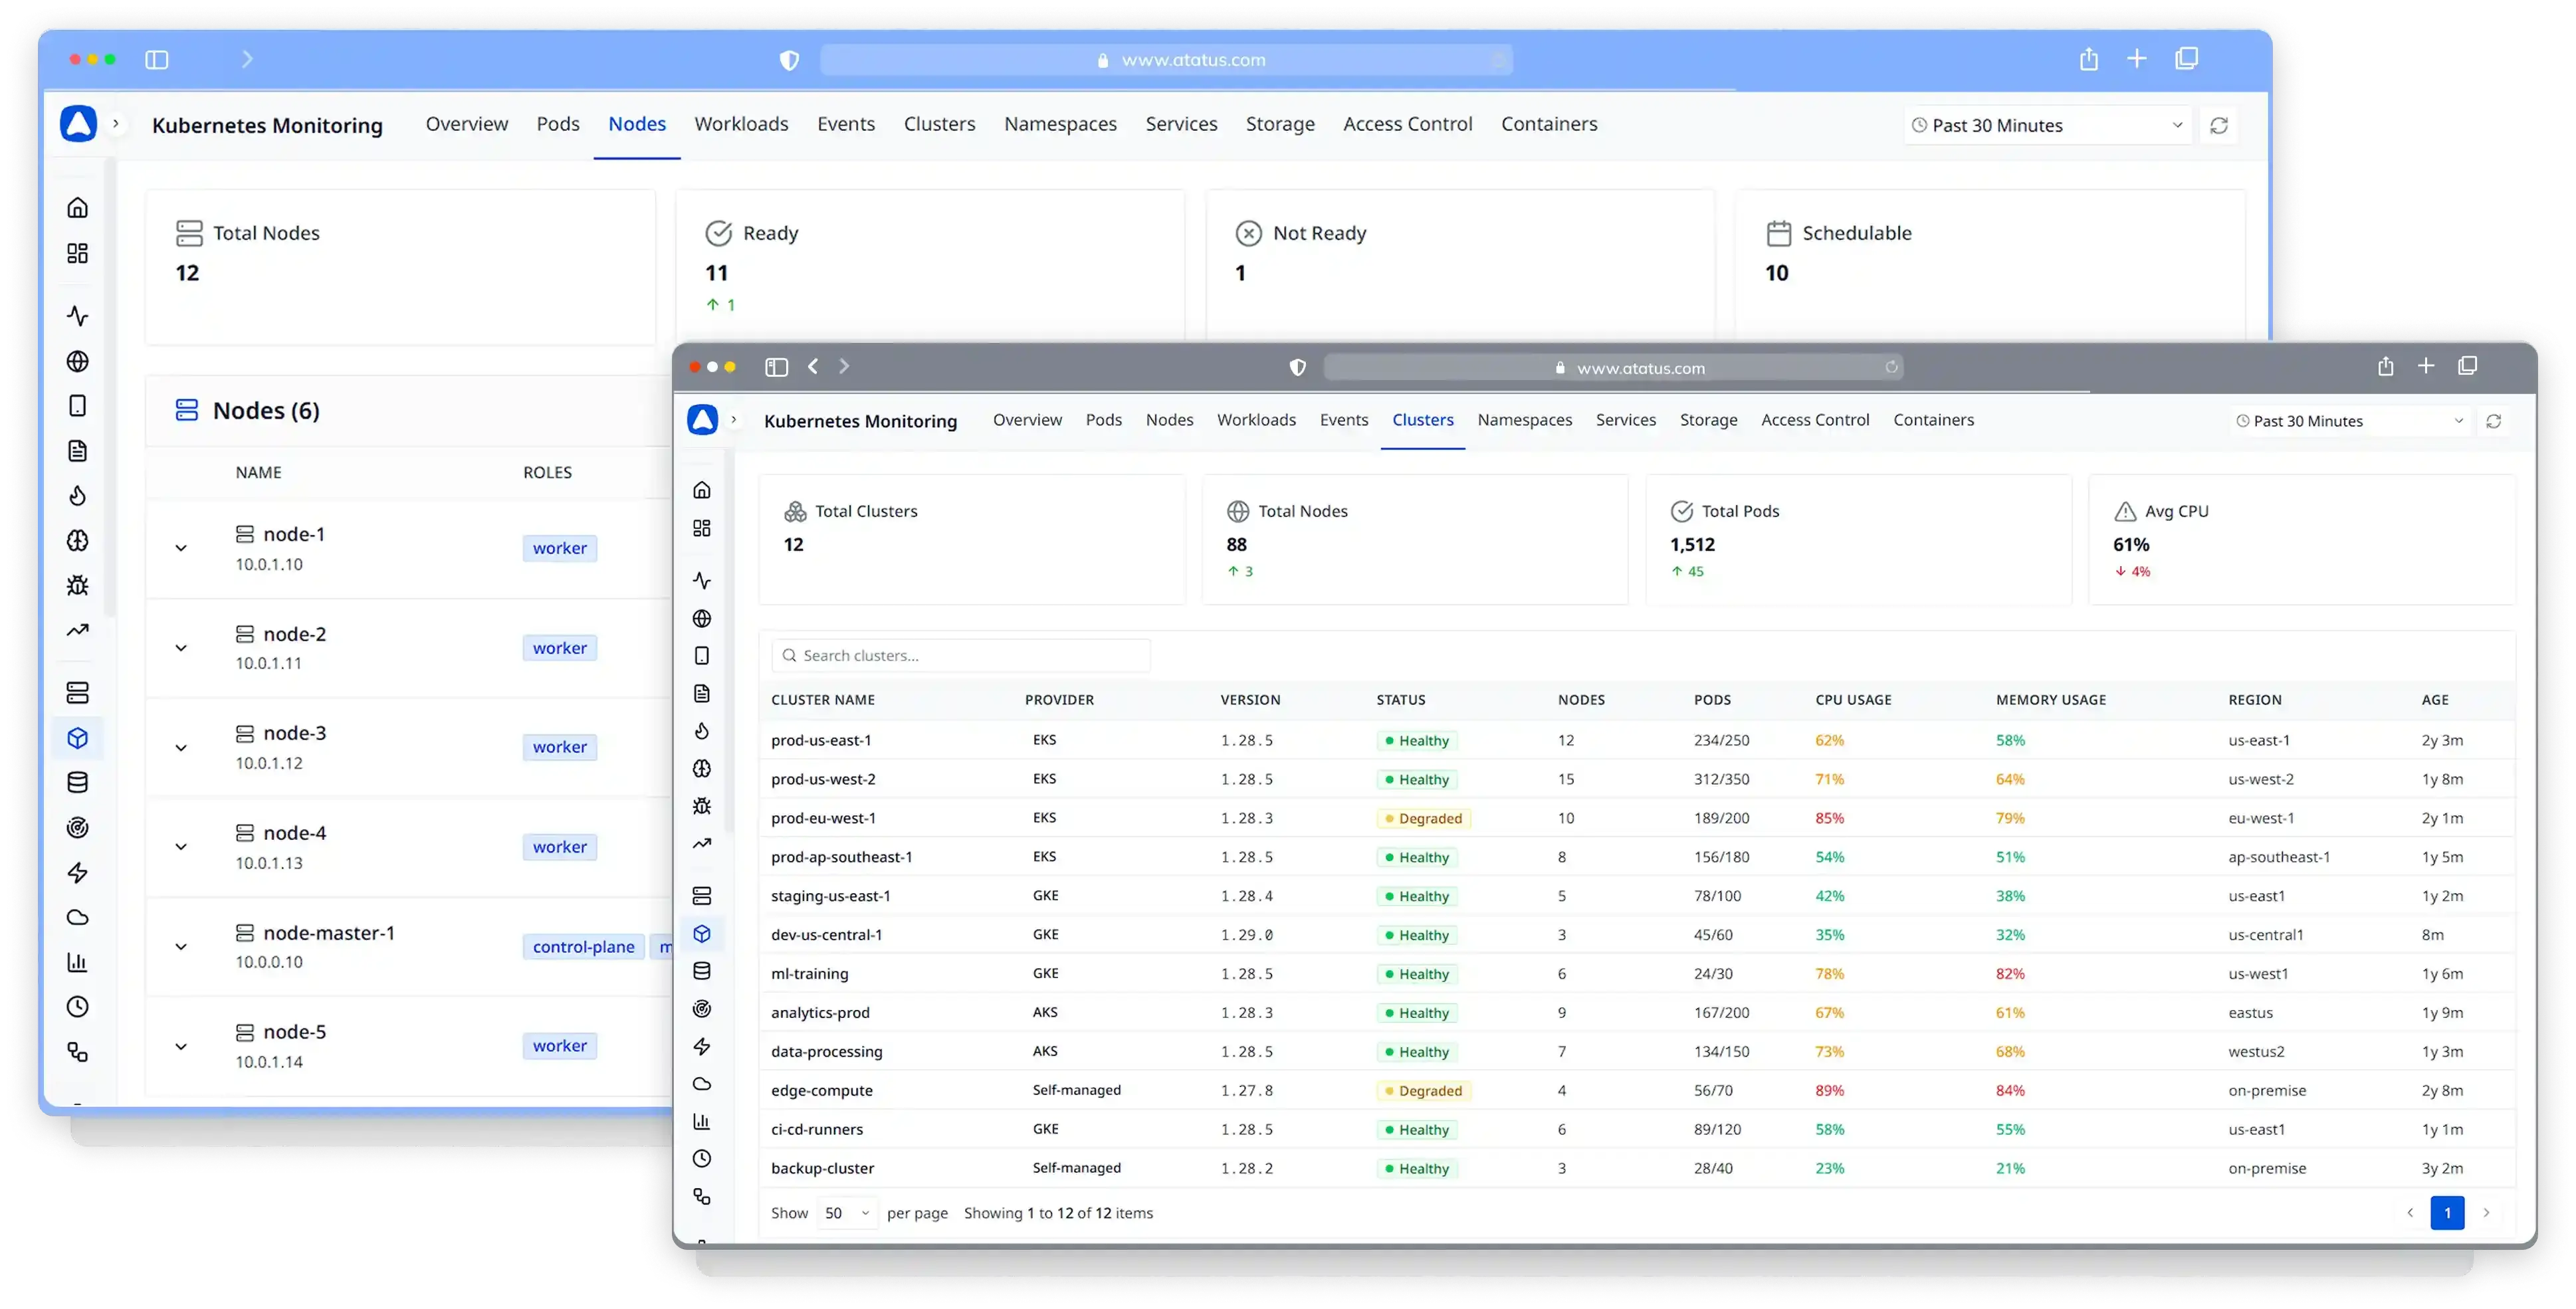
Cluster and Node Health Visibility
See the health of every Kubernetes node, workload, and control-plane component in one place. When infrastructure issues occur, Atatus shows what failed, which workloads were impacted, and the events that led to the outage.
- Node-level CPU, memory, and disk utilization metrics
- Pod scheduling failures and eviction events correlated automatically
- Control-plane health monitoring for cluster stability
- Full failure timeline without switching between tools
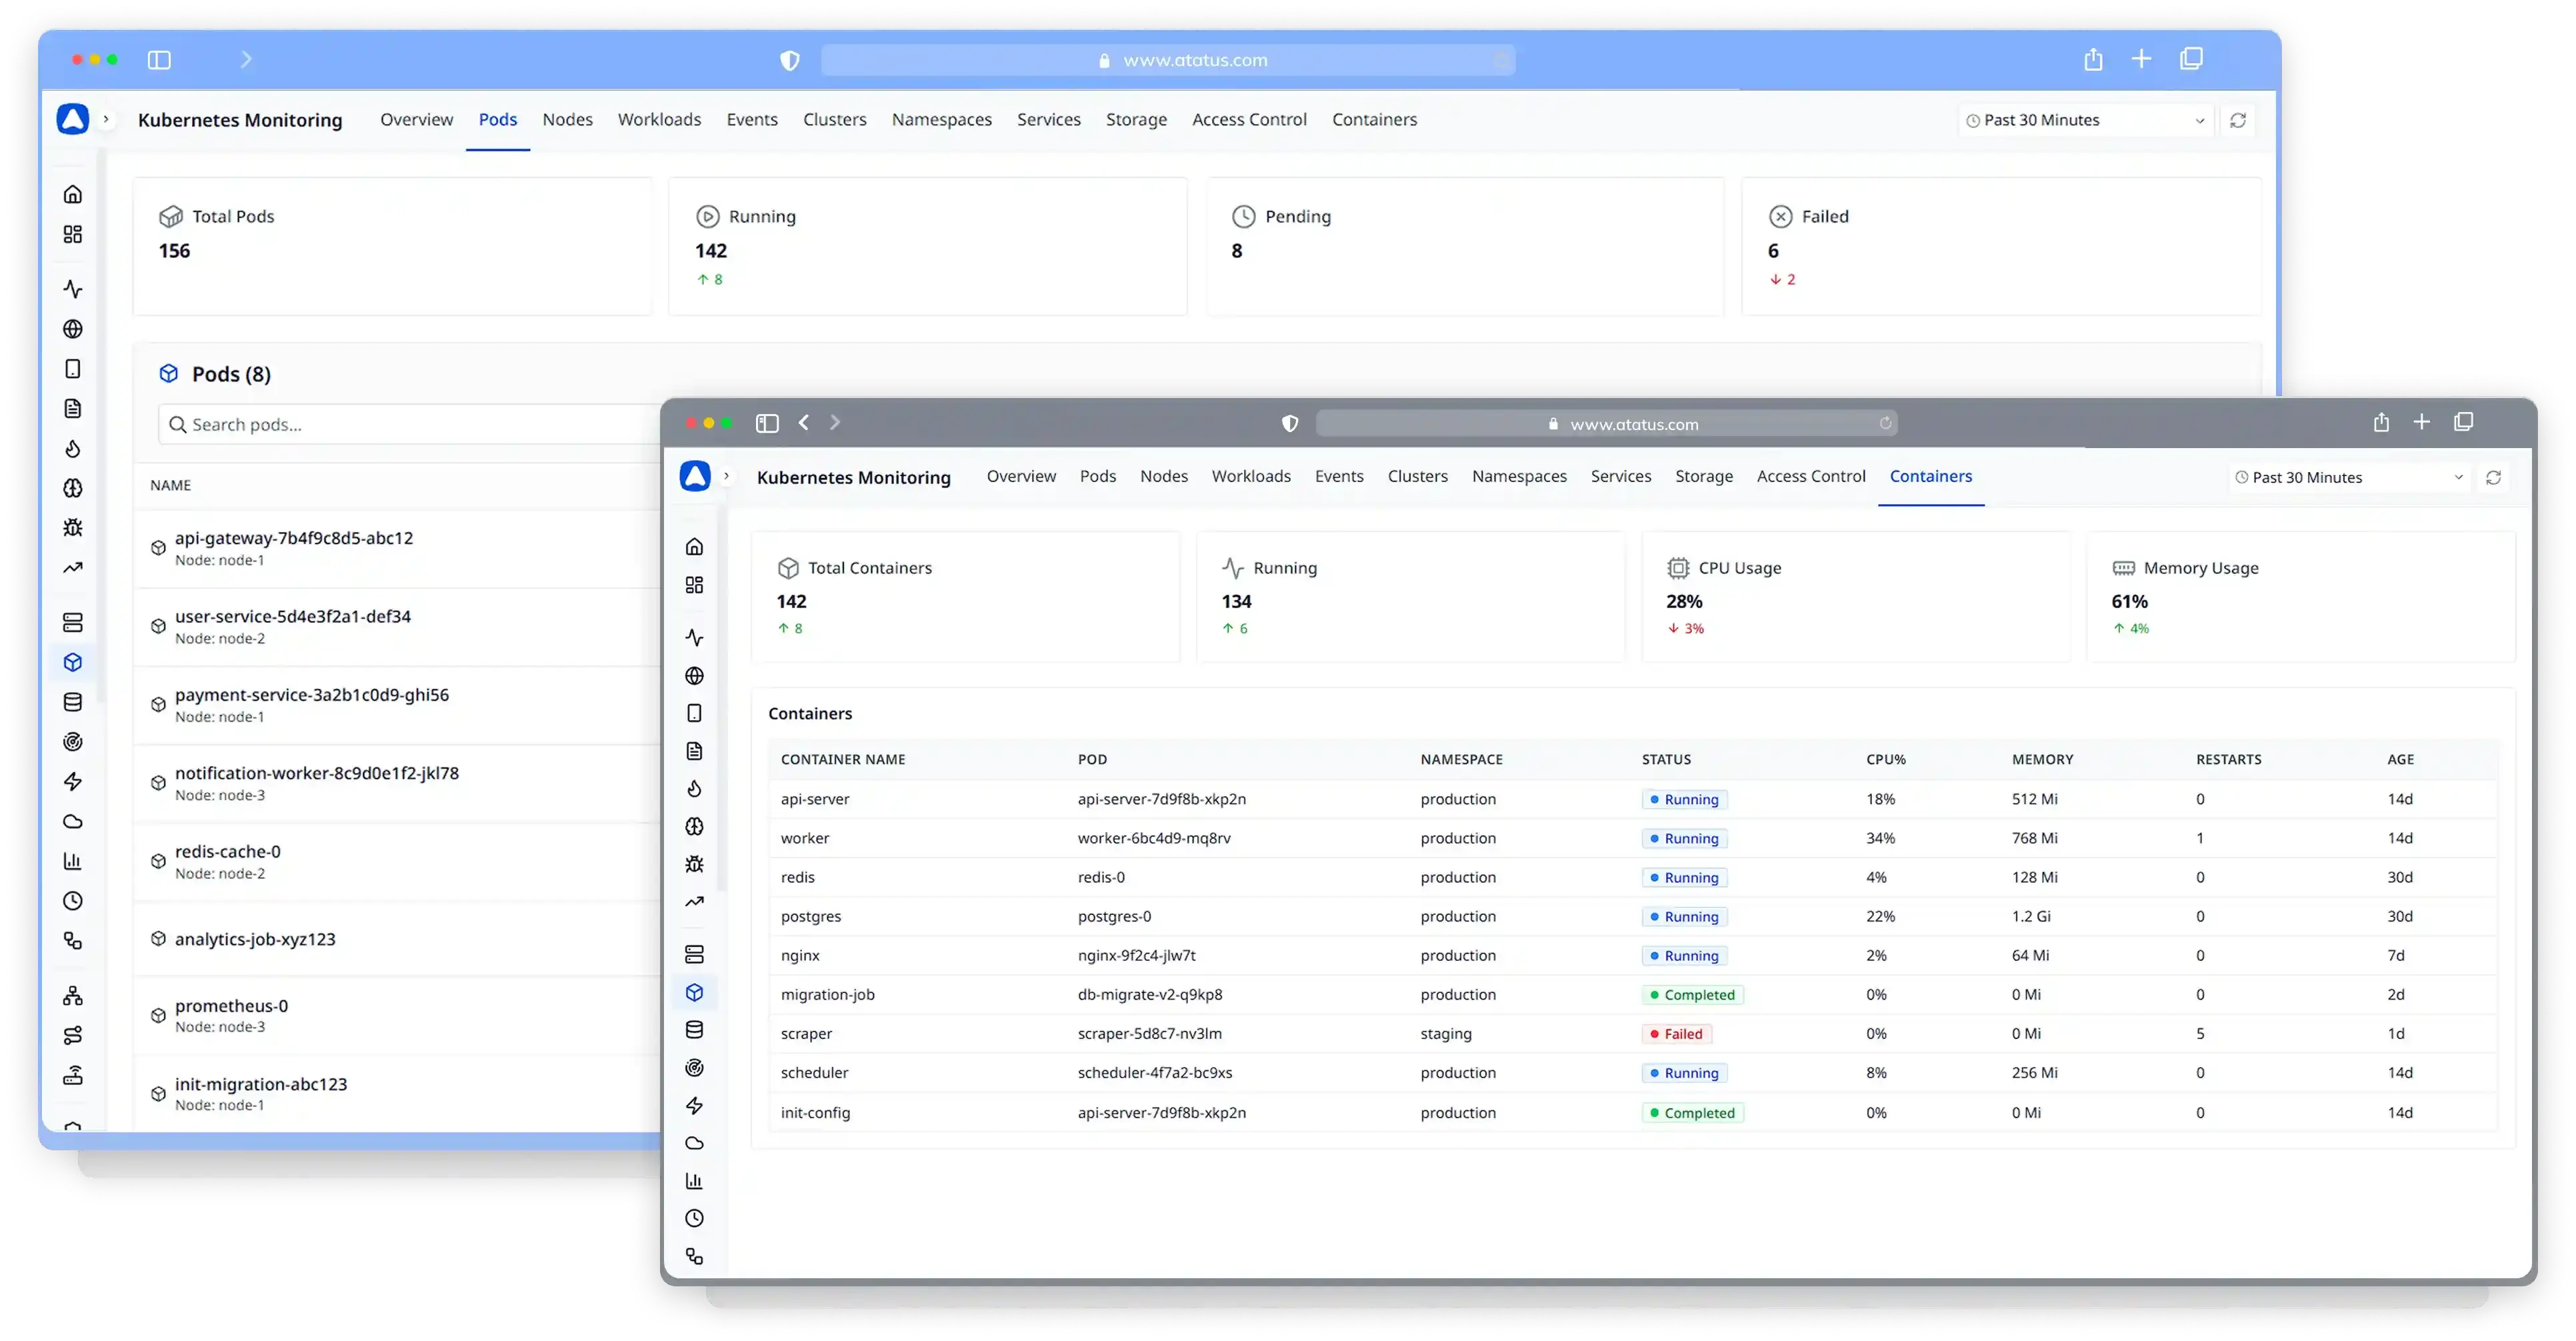
Pod and Container Performance Insights
Track every pod and container from deployment to termination. Atatus helps you identify resource bottlenecks, performance degradation, and workload inefficiencies before they impact application reliability.
- Monitor pod lifecycle events from Pending to CrashLoopBackOff
- Detect CPU throttling, memory pressure, and OOMKill events
- Analyze restart patterns and resource consumption trends
- Right-size workloads using real usage data and recommendations
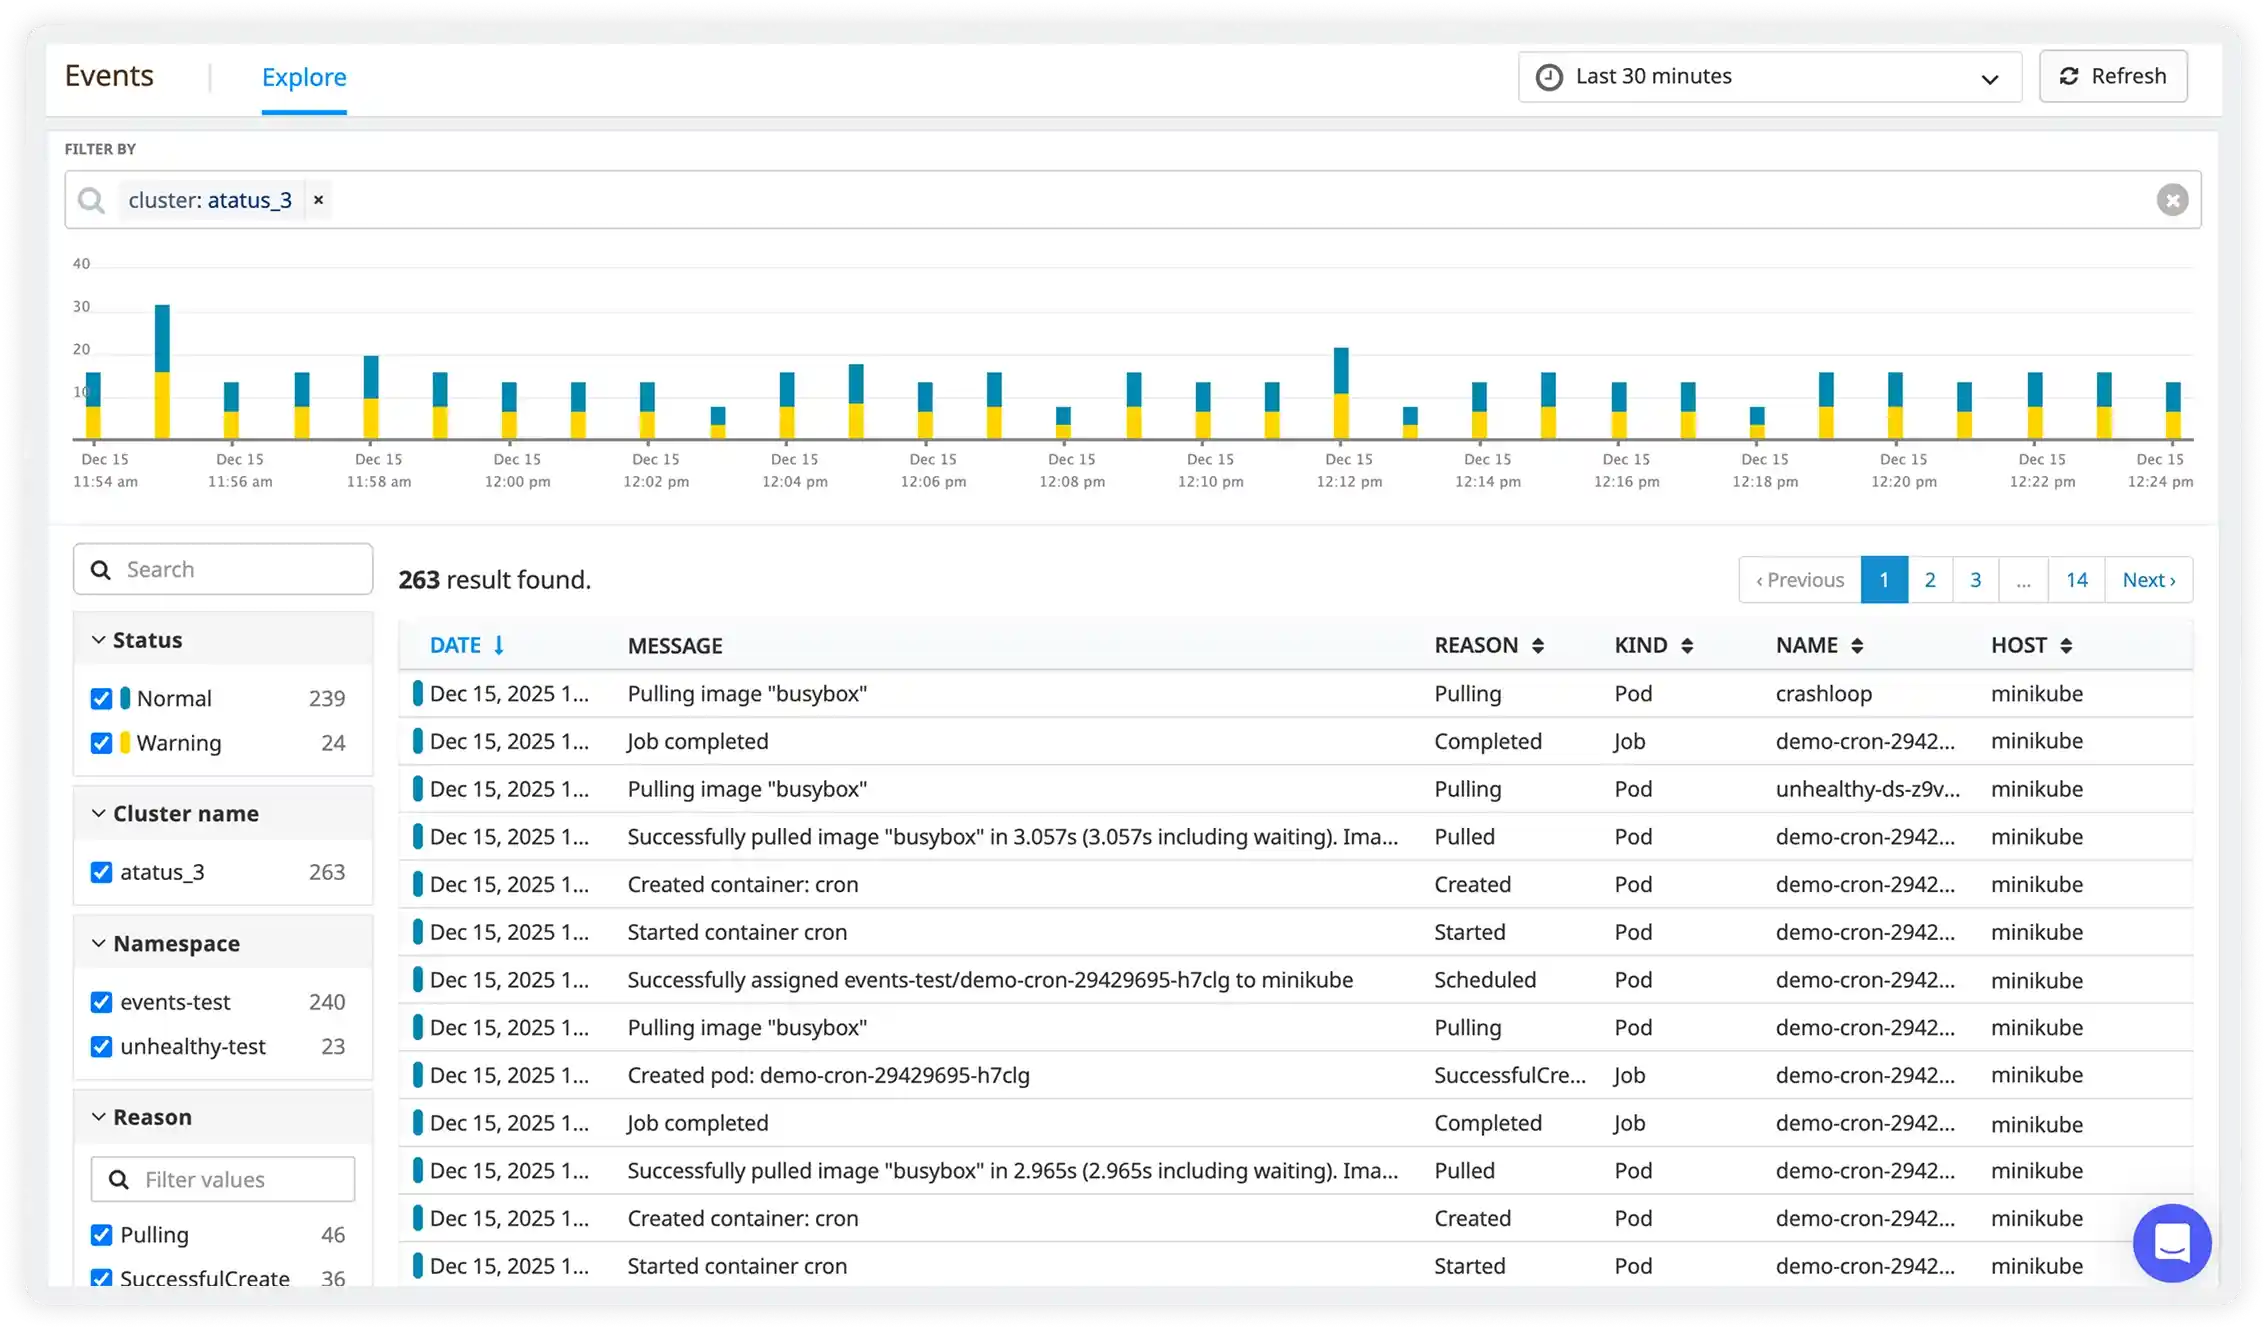
Kubernetes Events and Deployment Visibility
Never lose critical Kubernetes events or deployment context. Atatus captures and retains cluster events, helping teams understand exactly what changed, when it changed, and how it impacted application performance.
- Persist Kubernetes events beyond the default retention window
- Capture scheduling failures, image pull errors, and node pressure warnings
- Correlate incidents with deployment and rollout history
- Quickly determine whether a release introduced the issue or exposed an existing problem
Purpose-Built
Kubernetes Observability
Atatus is designed around how Kubernetes actually works like auto-discovering resources, tracking pod lifecycles, and connecting infrastructure data with application telemetry. When your cluster has a problem, you shouldn't need a monitoring expert to find it.
Namespace and Workload-Level Root Cause Analysis
Drill from a cluster-level anomaly down to a specific container within a specific pod within a specific namespace in a single investigation flow without switching tools or writing PromQL.
Complete Kubernetes Observability, Zero Configuration
Deploy the Atatus agent via Helm and auto-discovery handles the rest. No manual service definitions. No custom scrape configs. Kubernetes resources appear in your dashboards within minutes of installation.
On-Premises Deployment and Data Sovereignty
For teams with compliance requirements, Atatus supports on-premises deployment so your Kubernetes telemetry never leaves your infrastructure. Full observability without compromising data residency policies.
Built for Teams Who Run Kubernetes and Care About Reliability
Atatus helps engineering teams move from alert to resolution faster whether you're managing a single cluster or a multi-cloud Kubernetes fleet.
Prevent CrashLoopBackOff Failures From Reaching Users
Detect pods entering restart loops before they exhaust restart budgets. Atatus correlates crash events with container logs and recent deployment changes, giving on-call engineers the context to determine whether to roll back, adjust resource limits, or fix application-level errors. Persistent crash data survives pod deletion, unlike native Kubernetes events.
Know Which Workloads Are Actually Using Their Resources
Kubernetes clusters routinely overprovision resources because teams set conservative requests and limits and never revisit them. Atatus tracks actual vs. requested CPU and memory across every workload over time, making it straightforward to identify idle deployments, right-size resource allocations, and reduce monthly cloud spend without risking stability.
Stop Cascading Failures Across Distributed Services
In a microservices architecture, a single overloaded pod can cascade into a cluster-wide incident. Atatus maps service-to-service dependencies and tracks error rates, latency, and throughput at each hop, so teams can isolate the source of a cascading failure before it triggers SLA breaches or user-visible outages.
Catch Performance Regressions Before They Reach Production
New deployments are the leading cause of Kubernetes performance incidents. Atatus automatically correlates deployment events with performance metrics, surfacing latency increases, error rate changes, and resource consumption spikes that appeared after a rollout. Teams can confirm a deployment is healthy or trigger a rollback before monitoring escalates to an incident.









Start Monitoring in Under 5 Minutes
Three simple steps to complete observability. No credit card required.
Deploy the Agent
Install Atatus K8s agent via Helm chart or YAML manifests. Auto-discovers all clusters, nodes, pods, and services within minutes.
Auto-Collect K8s Metrics
Automatically captures cluster health, pod metrics, container logs, and Kubernetes events without manual configuration.
Monitor & Optimize Clusters
Access real-time K8s dashboards. Optimize resource usage, troubleshoot pod issues, and reduce cloud costs with actionable insights.