ORM Execution Opacity
Complex query generation and lazy evaluation obscure actual database behavior, making runtime cost hard to predict under load.
Get end-to-end visibility into your Django performance with application monitoring tools. Gain insightful metrics on performance bottlenecks with Python monitoring to optimize your application.
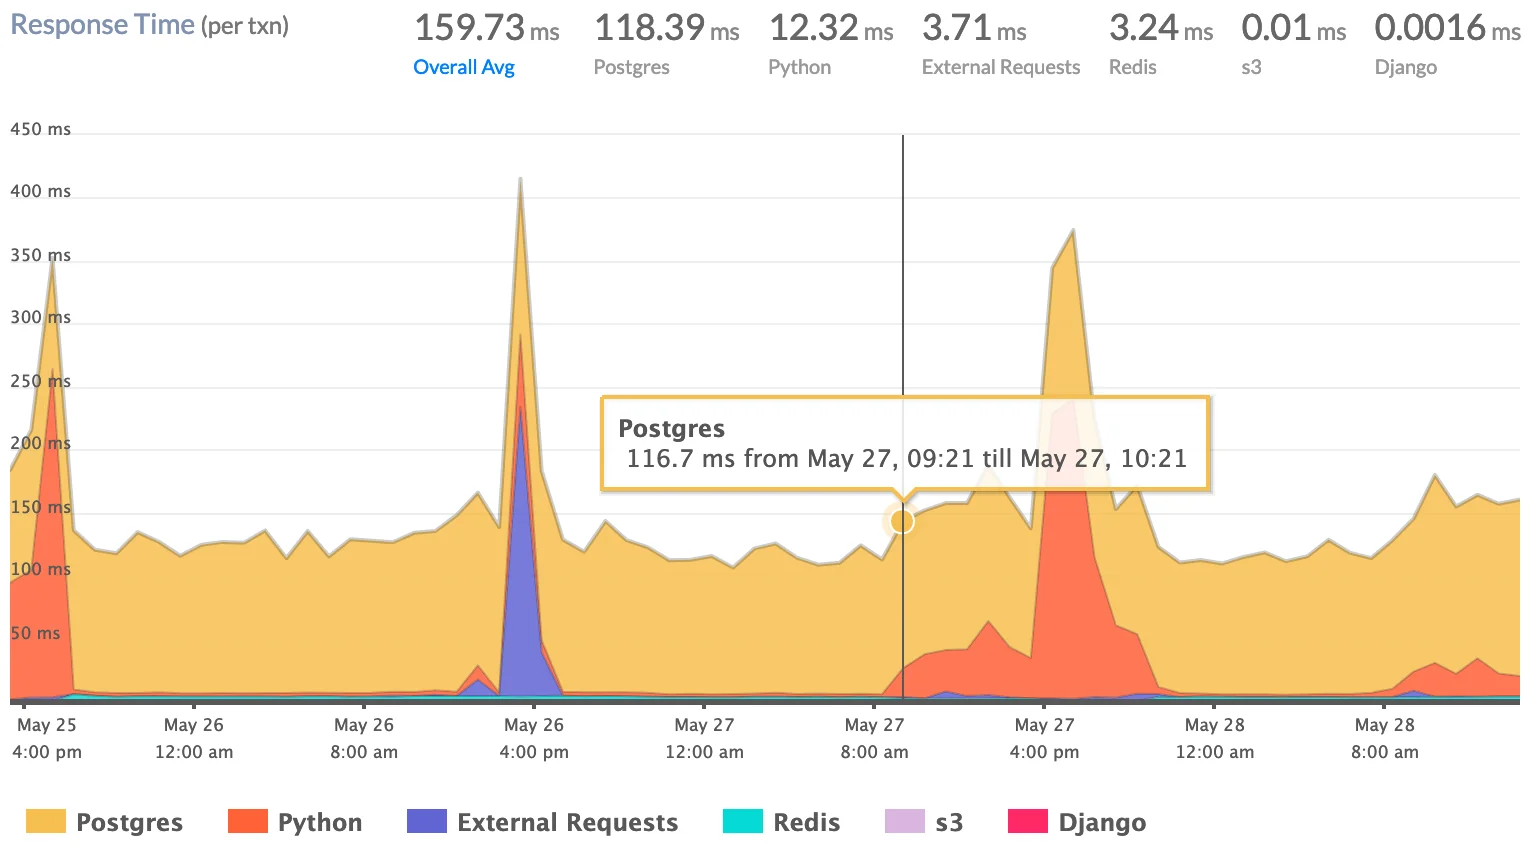
Complex query generation and lazy evaluation obscure actual database behavior, making runtime cost hard to predict under load.
Requests flow through a processing pipeline that hides where time and resources are actually consumed.
Blocking I/O and CPU-heavy logic stall request threads silently, causing throughput collapse during traffic spikes.
Object retention and cache growth increase gradually. Memory pressure builds without clear thresholds or early warnings.
When errors or latency emerge, isolating the responsible execution segment takes too long during incidents.
Architectural choices that worked at low traffic fail unpredictably as concurrency and data volume increase.
Teams investigate after user impact. Root causes remain ambiguous, increasing the likelihood of repeat failures.
Request handling passes through multiple lifecycle hooks, obscuring where execution time and resources are actually consumed.
Real-time observability for Django workloads that helps teams understand request behavior, optimize performance, and resolve production issues faster.
Track how long each request takes across middleware, views, and internal processing layers. Quickly uncover slow execution paths affecting response times.
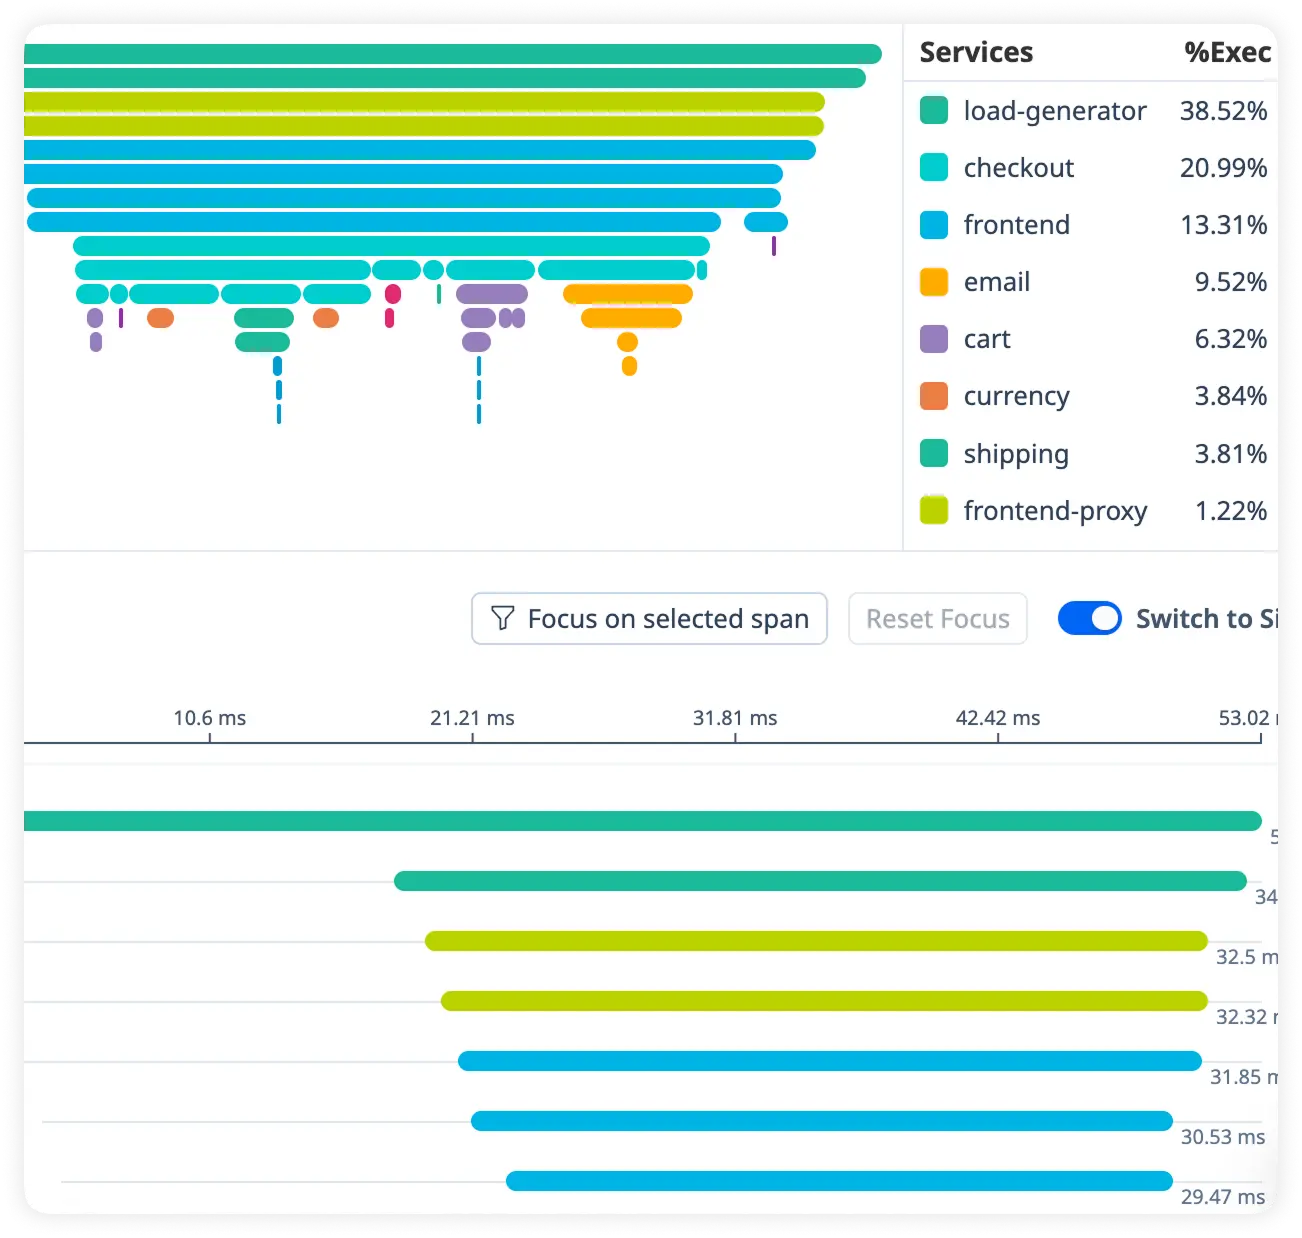
Monitor database query execution time and load in real time through Django’s ORM. Eliminate inefficient queries that slow application performance.
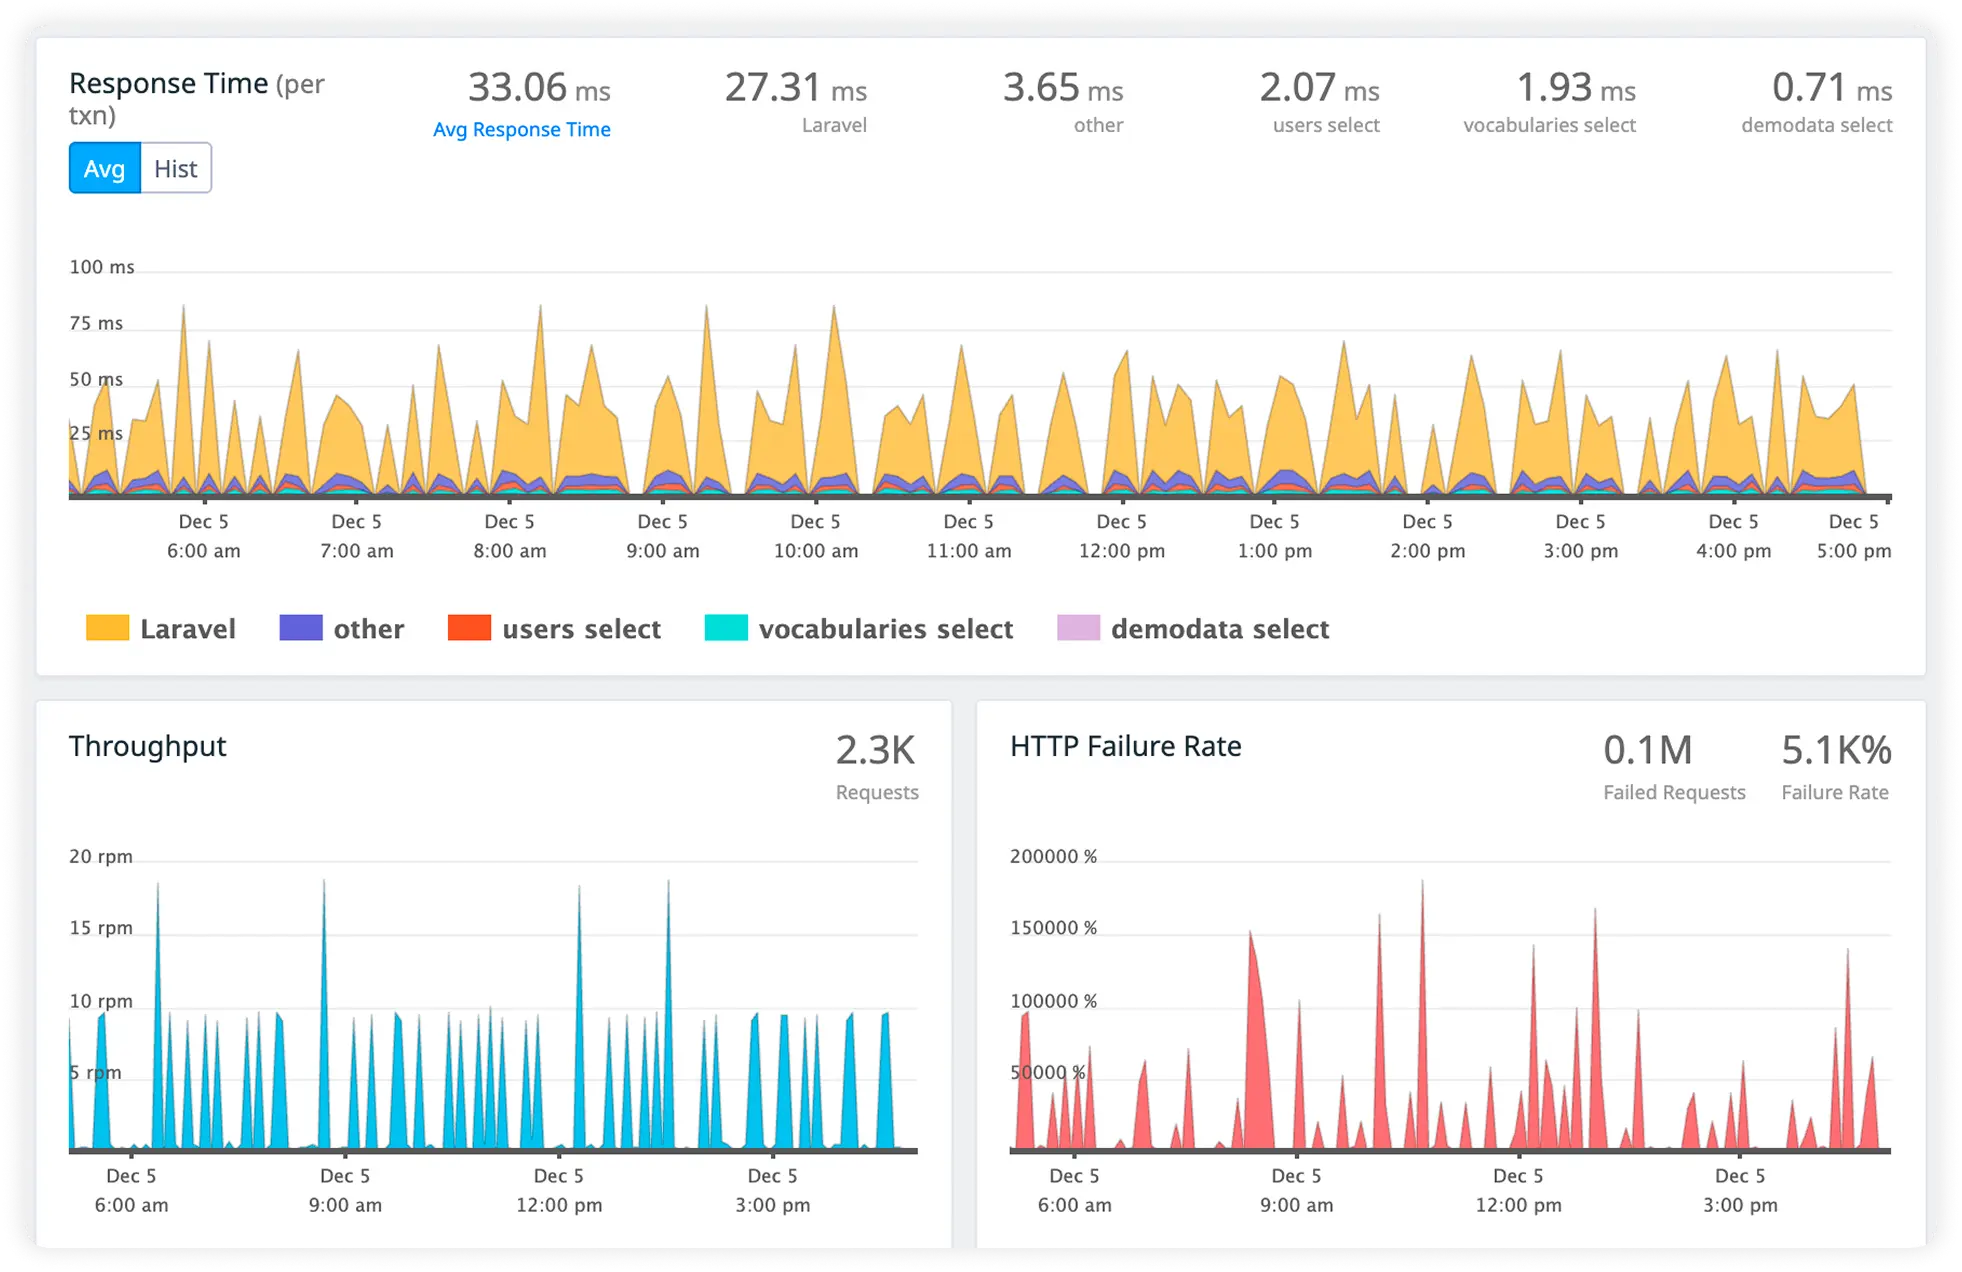
Measure how caching layers affect request speed and system load. Identify cache misses and performance gaps impacting responsiveness.
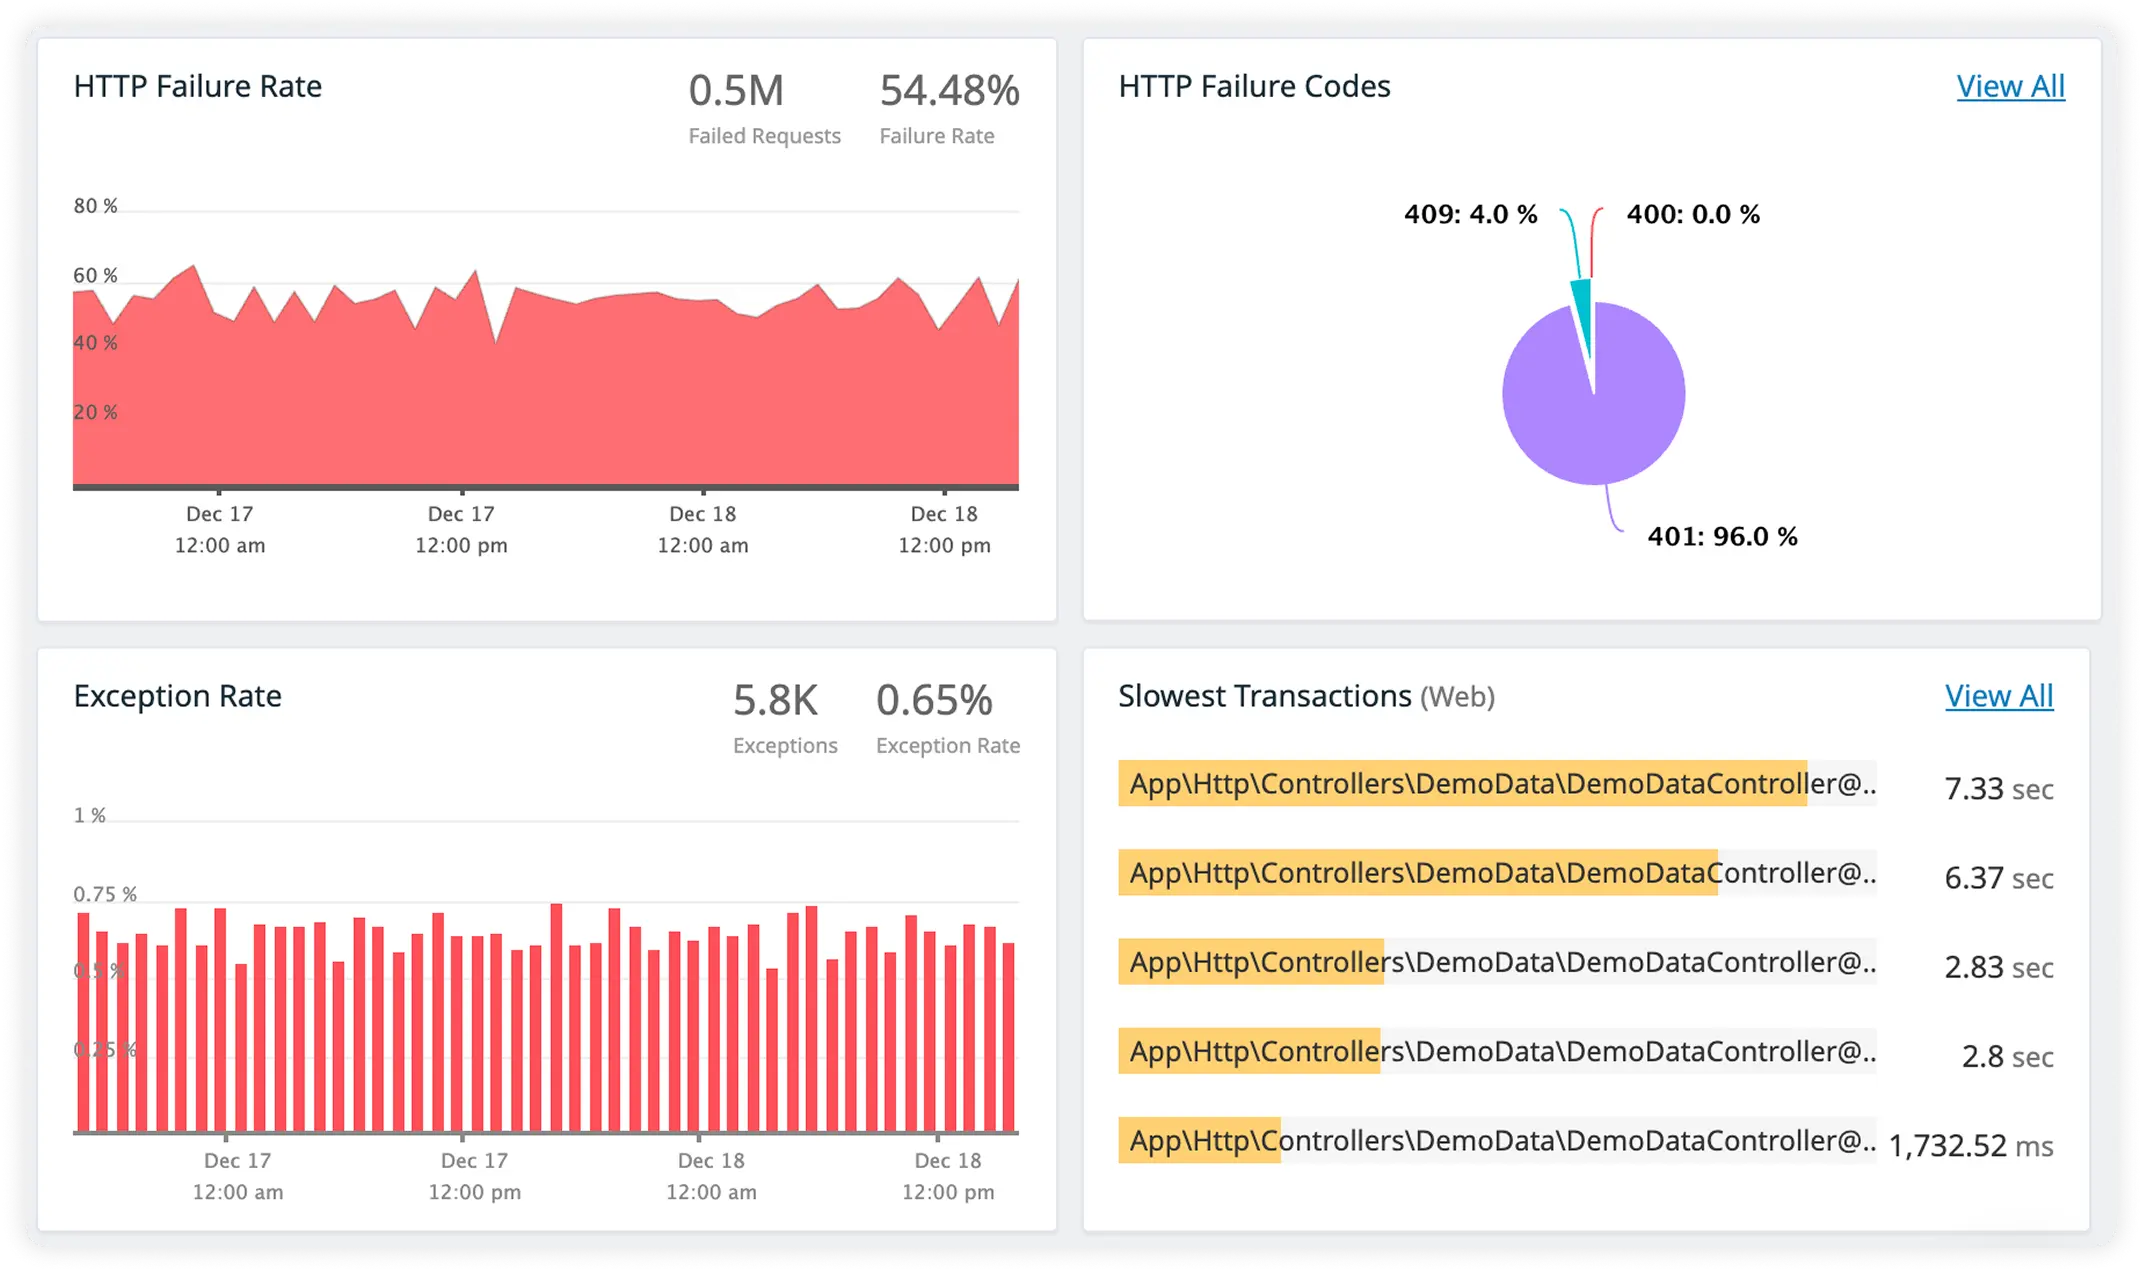
Track response times for third-party APIs while correlating metrics with request traces. Understand how external dependencies influence overall application performance.
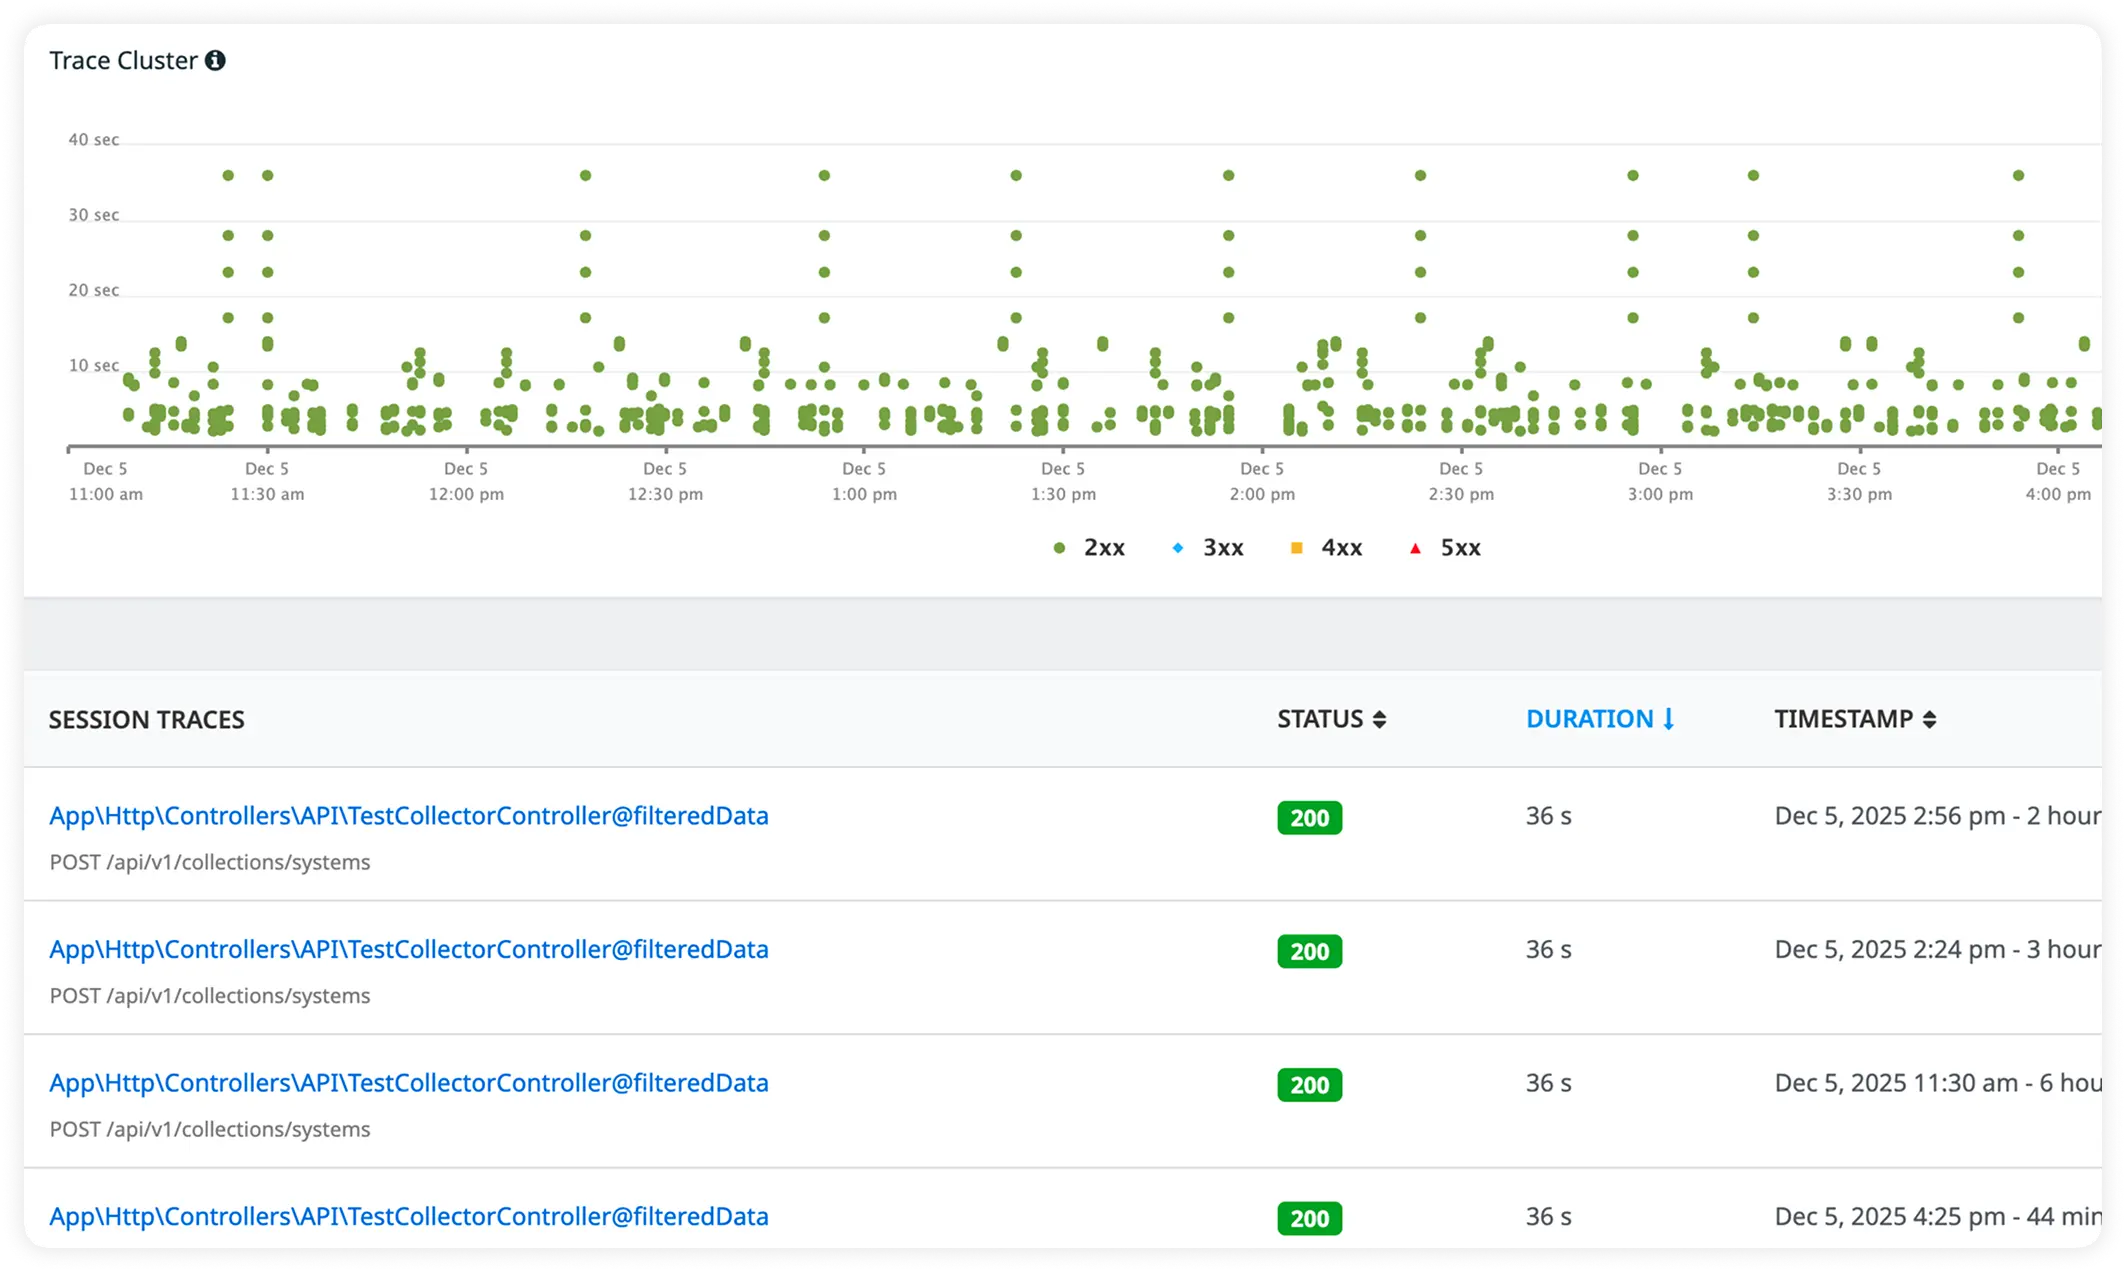
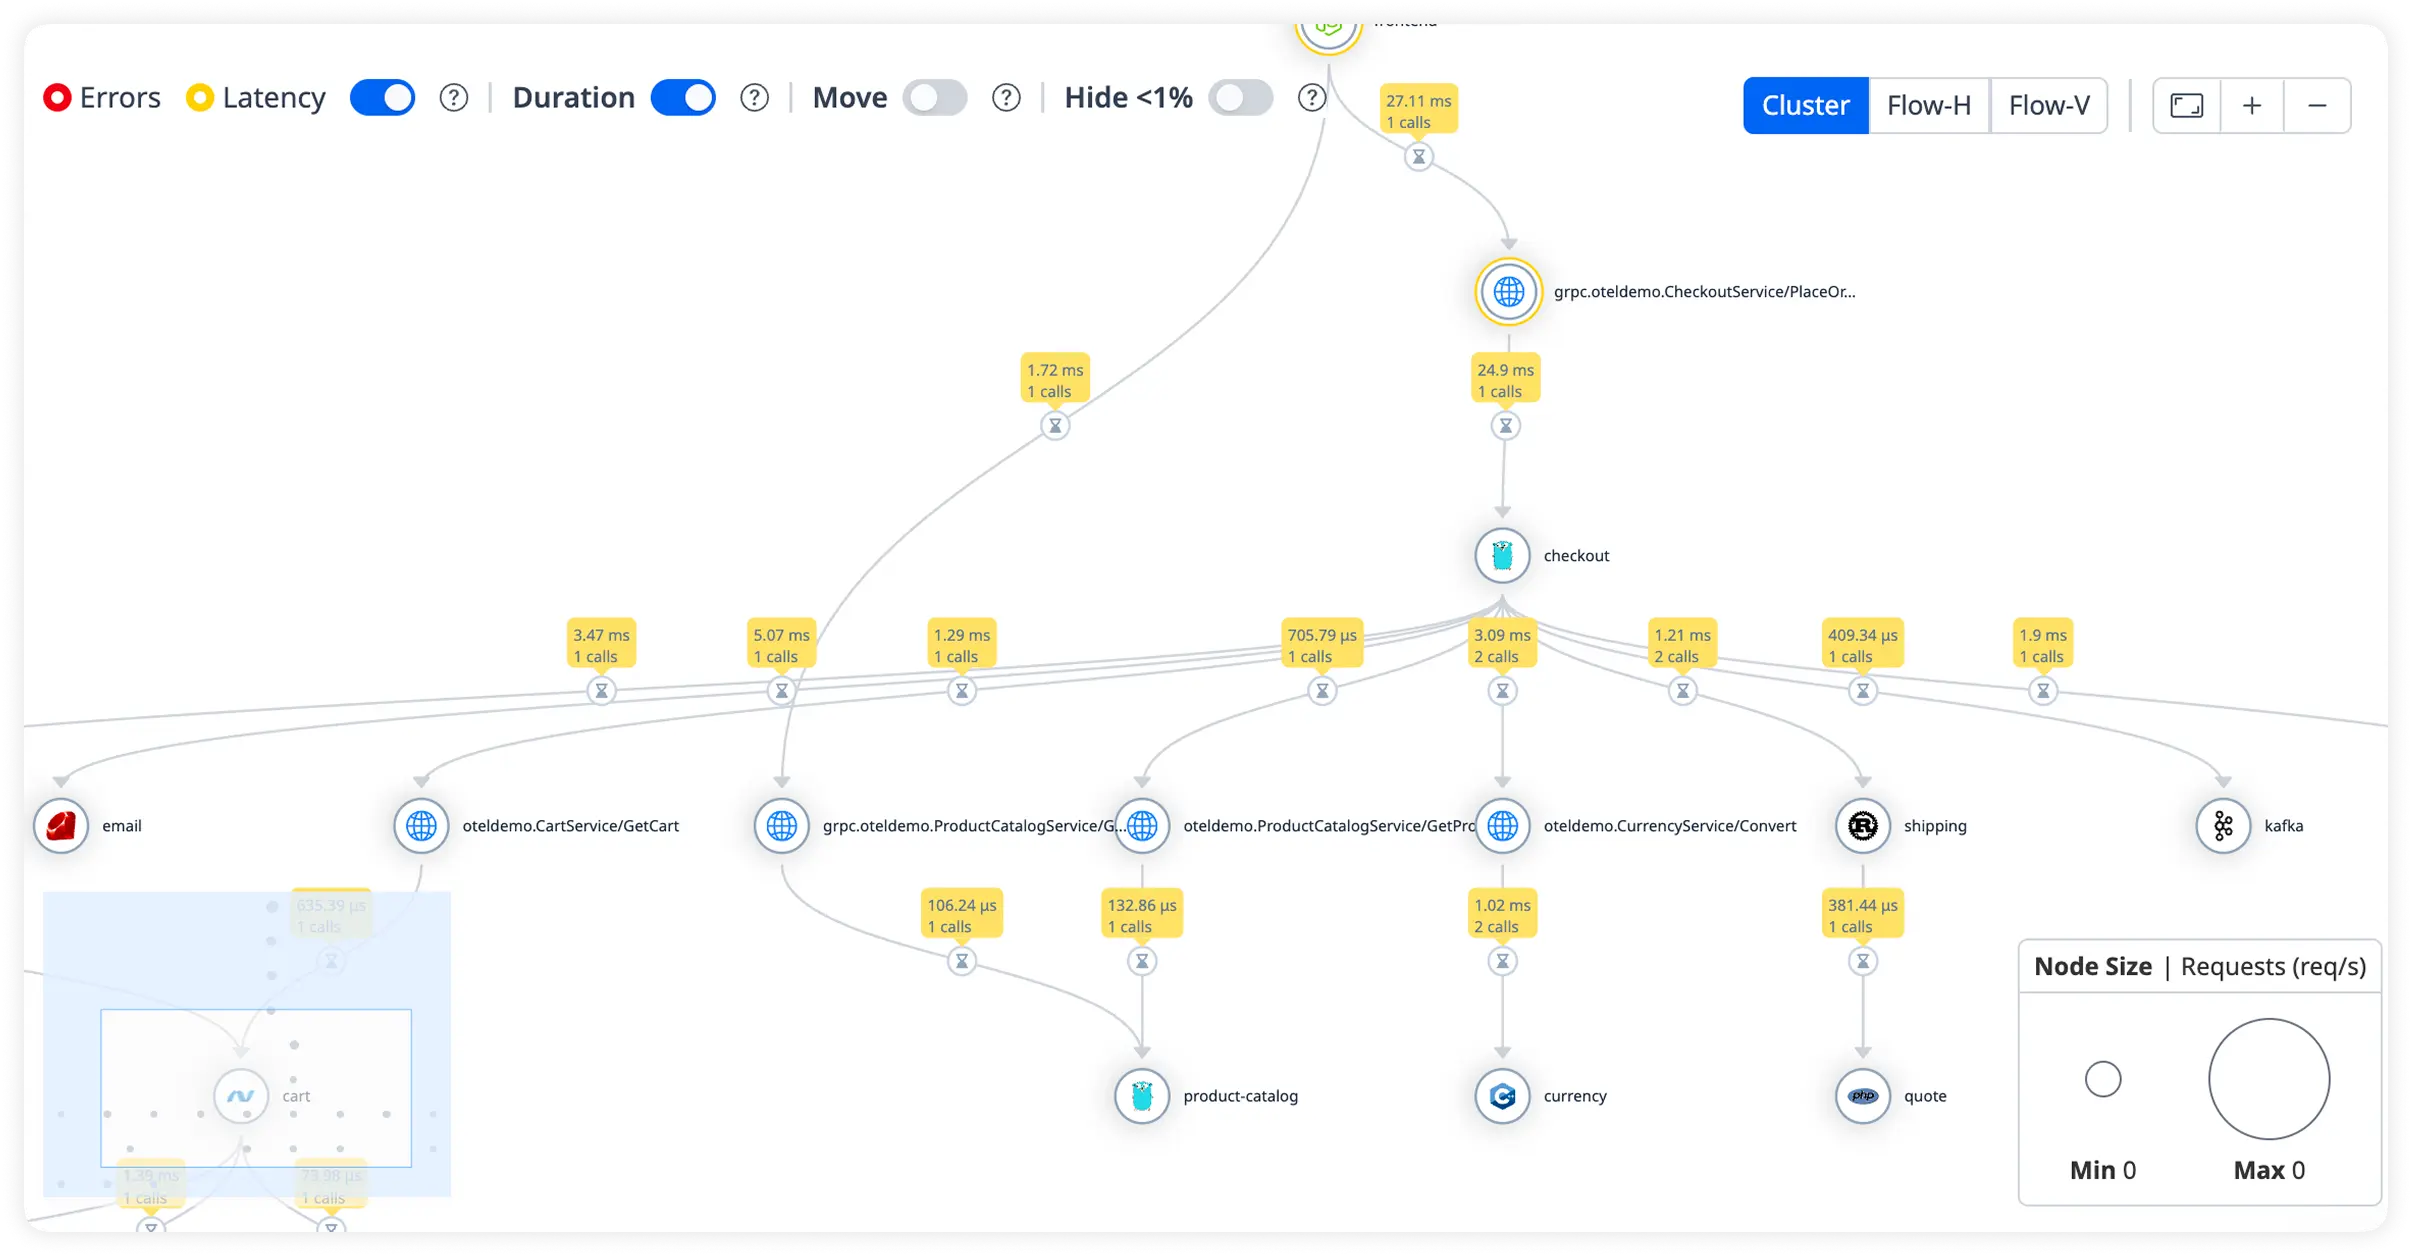
Engineering teams choose Atatus when Django systems evolve into business-critical infrastructure. It supports how Django applications behave under real concurrency, load, and failure conditions.
Teams gain an accurate understanding of execution behavior across request handling, database interaction, and background work.
Production insight becomes usable quickly, without extended rollout or complex operational changes.
The runtime data aligns with code behavior, allowing engineers to debug confidently without second-guessing instrumentation accuracy.
Runs alongside live Django workloads without introducing instability or request handling risk.
During outages, teams analyze execution-level evidence rather than guessing from surface symptoms.
As concurrency and request volume grow, runtime understanding remains consistent instead of degrading under load.
Platform and SRE teams avoid managing heavy monitoring stacks for services designed to stay minimal.
Backend, SRE, and platform teams work from the same execution reality, reducing friction during incidents.
Teams validate the runtime impact of code and configuration changes with clarity, lowering deployment risk.
Atatus adapts to how engineering teams work across development, operations, and reliability.
Debug errors and slow paths with the full context of what happened.
Atatus for developersTrack deployments and see how each release affects stability.
Atatus for DevOpsWatch latency and error rates to ship with less production risk.
Atatus for release engineersPricing, deployment, data and the agent. If something is missing, a person will answer it on a demo call.
Django performance monitoring involves using various Django monitoring tools to track, analyze, and optimize the performance of a Django application. This includes measuring response times and identifying bottlenecks, as well as monitoring database performance, error tracking, resource usage, request throughput, and application logs.
Application Performance Metrics:
Database Metrics:
Resource Usage Metrics:
Network Metrics:
Yes, Atatus can integrate with popular frameworks and libraries, such as Flask and Python which works best with Django.
To implement Django performance monitoring you need a Django application performance monitoring tools like Atatus. First, install the Atatus APM client in your Django project. Next, configure Atatus in your settings file. Then, set up the Django monitoring dashboard in Atatus to visualize metrics and Django network monitoring data. This will provide comprehensive insights into your application's performance.

