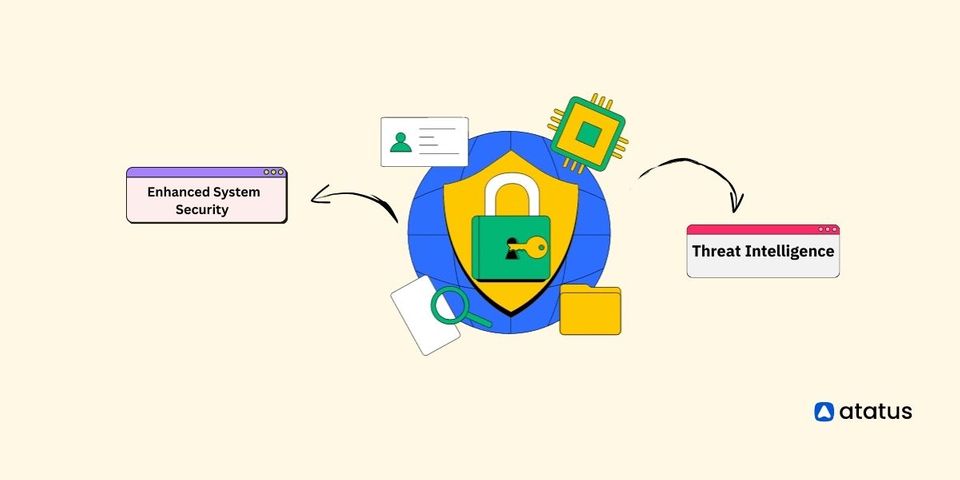
Although microservices have been such a blessing, they have certainly complicated the monitoring process. It is difficult to ascertain what component faulted, at what time, and where. Then maybe it is the right time to discuss Distributed Tracing!
Time-series Monitoring is a game changer in the Analytics world. In this blog, we explore how Prometheus and Influx DB fare against each other in their Monitoring prowess.
Uptime is the time period when your website and all of its contents are fully functional and accessible. This post will cover some of the top website uptime monitoring tools to help you get started.
Learn how to monitor AWS Lambda functions in real-time using a Node.js application with OpenTelemetry integrated. Tack insights everytime the function is invoked.
Explore Grafana vs Splunk in this blog. Uncover a game-changer - Atatus, offering comprehensive solutions. Elevate decision-making with this comparison.
To analyze Redis instances and clusters, you need to understand key metrics. Check out these key Redis metrics for improving Redis database management.
Compare New Relic and Kibana to choose the best observability and log visualization tool for your needs. Learn about key features, and how each platform handles monitoring, log management, and data visualization.
Monitor your entire software stack
Gain end-to-end visibility of every business transaction and see how each layer of your software stack affects your customer experience.