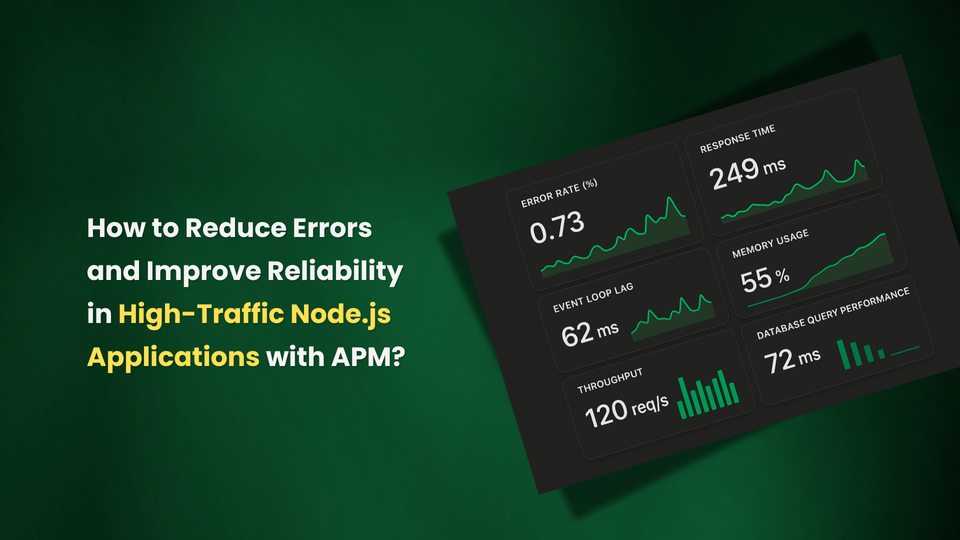
High-traffic Node.js apps face bottlenecks, memory leaks, and errors. Learn why they fail at scale and how Atatus APM helps DevOps cut errors and keep apps reliable.
From SQL injection and memory leaks to inefficient queries, PHP apps face many challenges. Learn how monitoring tools solve these issues and why Atatus is the most effective APM for modern teams.
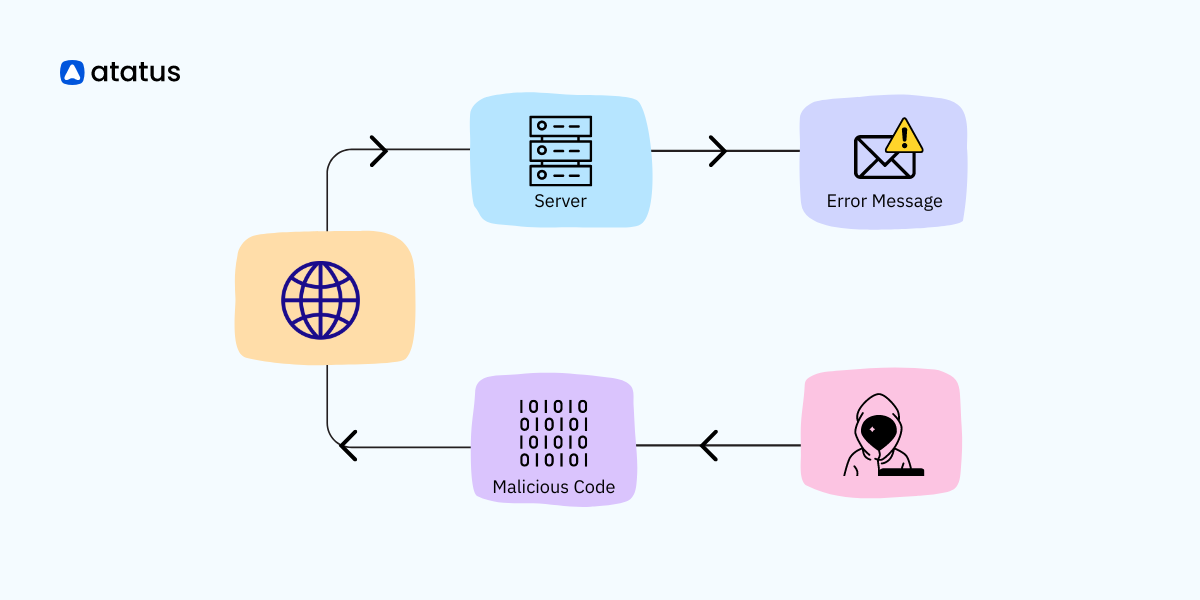
Protect your website from PHP vulnerabilities. Prevent SQL injection, XSS, and more. Follow best practices, update PHP, and use firewalls for security.