Continuous Profiling Explained: CPU, Memory, and Flame Graphs in Production
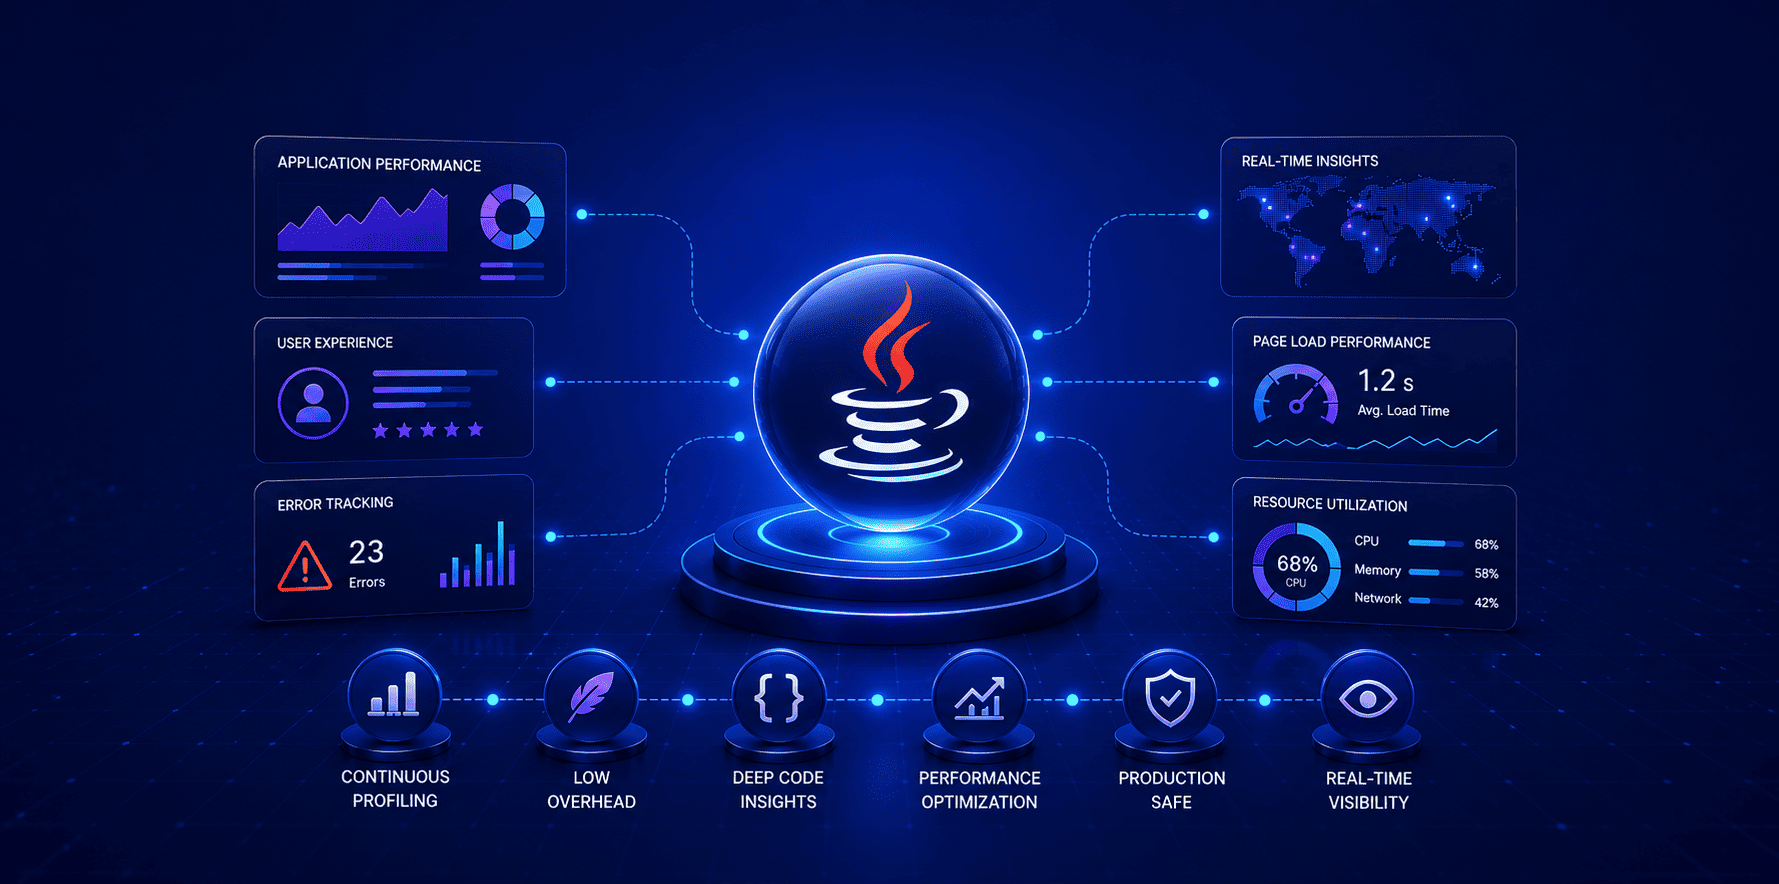
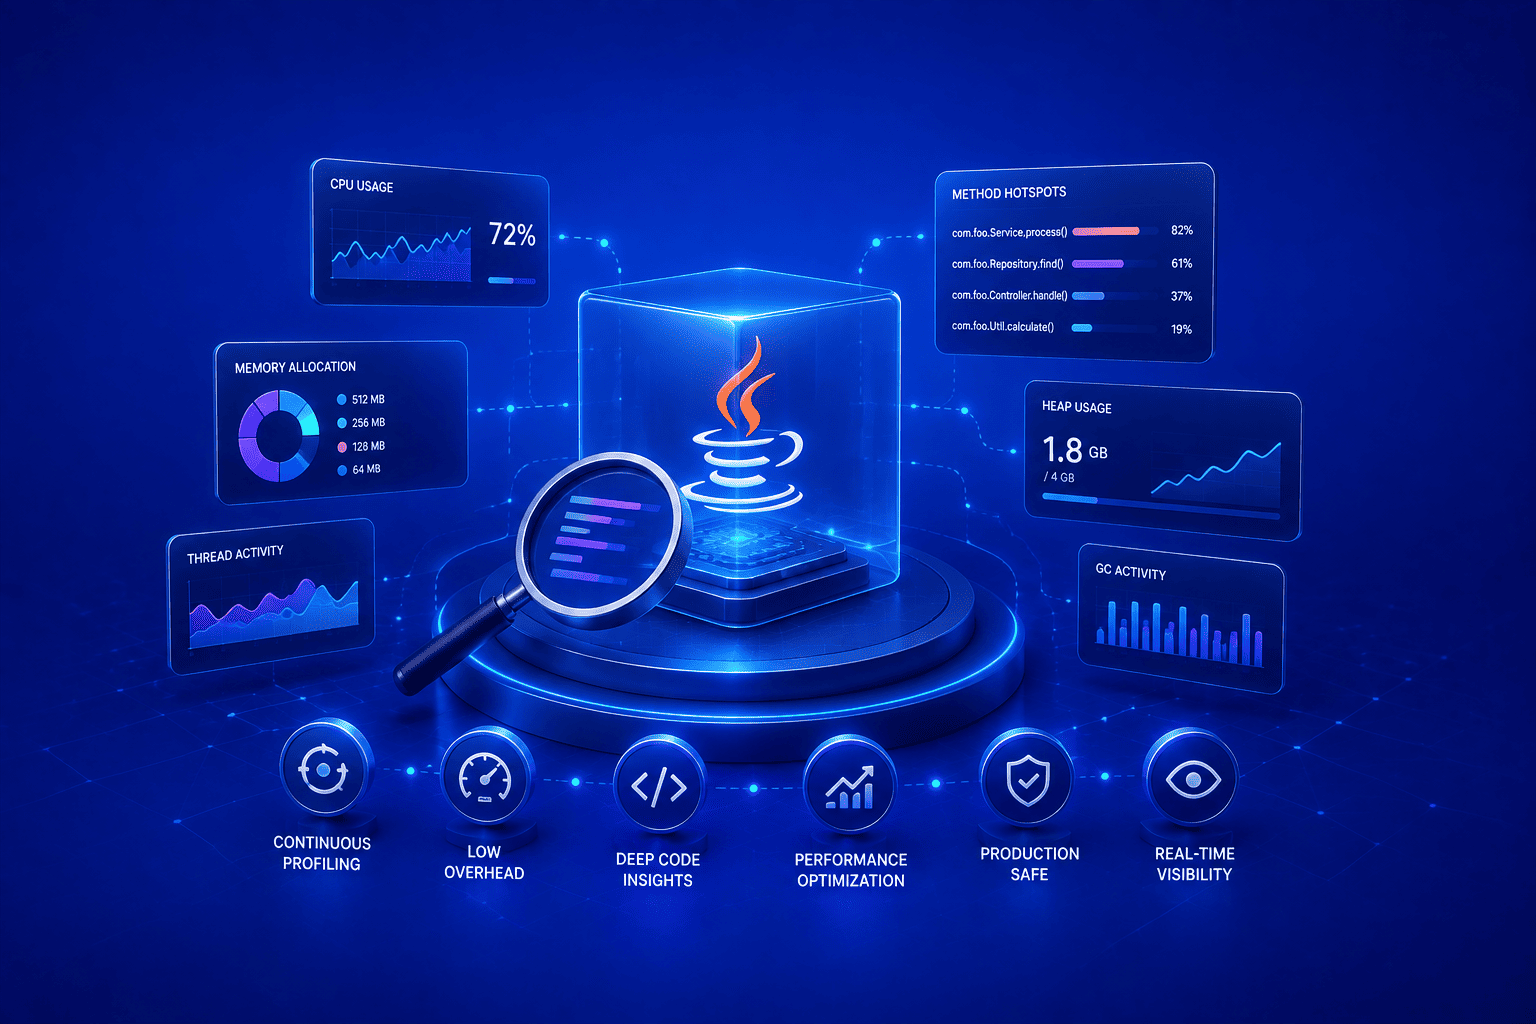
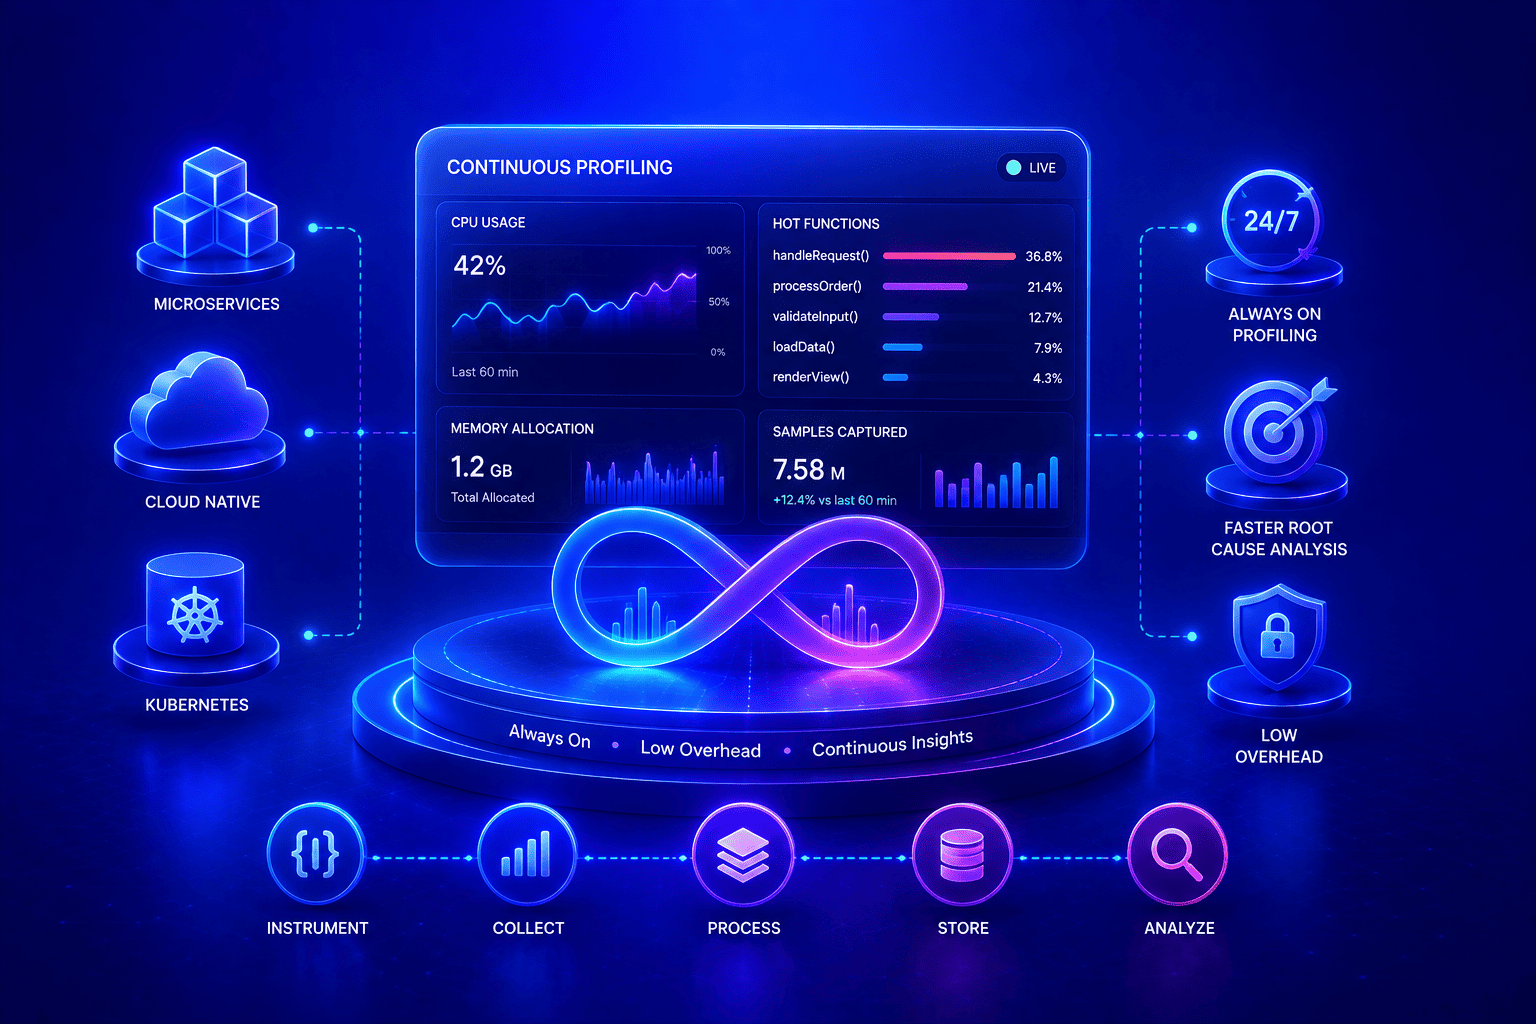
Continuous profiling reveals where your code actually spends CPU, memory, and time in production, not just where requests are slow. Here's how it works and how to set it up with Atatus.