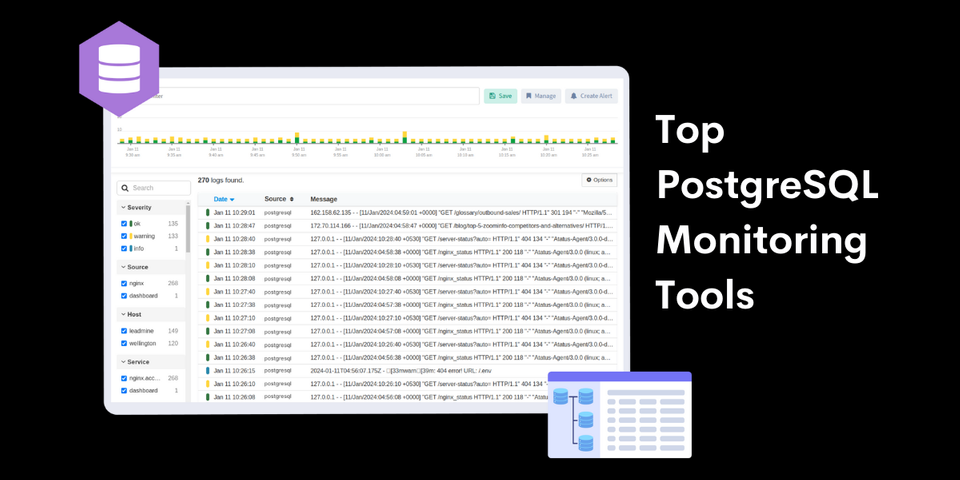
Here are the top PostgreSQL monitoring tools: Atatus, pganalyze, Datadog, Nagios Core, pgDash, Sematext, AppDynamics, pgAdmin, pgBadger, Percona Monitoring and Management, Prometheus, Zabbix
Discover the best AppDynamics alternatives for application and infrastructure monitoring. Explore top 7 AppDynamics competitors that offer better scalability, ease of use, and cost-effective solutions.
Both TypeScript and JavaScript are two exceptional Scripting languages. Although JavaScript is easy to use when building a small-scale application, TypeScript has its pros when designing a heavier program.
New DevOps tools and technology have a significant impact on cultural change. And, with the right DevOps automation tools, you can quickly achieve business transformation!
SQL query optimization is a never-ending journey. We'll go through a few SQL query optimization best practices to use when writing SQL queries in this article.
Java logs are the best source for locating application issues. You can use these best practices in Java logging to troubleshoot before your users are affected.
Learn how PromQL facets enhance metrics analysis by enabling granular insights, custom aggregations, and multi-dimensional visualizations. Discover use cases, best practices, and advanced techniques to elevate your monitoring with Prometheus.
PHP is one of the most used programming languages in website development and applications. Choosing the right framework makes a huge difference in your product. Here is the list of most popular frameworks in PHP.
Monitor your entire software stack
Gain end-to-end visibility of every business transaction and see how each layer of your software stack affects your customer experience.