10 Best Log Management Tools
Logs are imperative for troubleshooting, performance analysis, health monitoring, and application integrity and security. Log management tools clearly understand how users interact with apps and systems and provide insight into improving software reliability, increasing productivity, reducing risks, and ultimately improving the user experience.
Through log management tools, users can further integrate and enrich all of their logs, making queries quicker and more effective. Along with crucial information on the application's overall health, logs offer a wealth of additional data that is not otherwise available.
Every application should check its logs, but creating a website requires special attention. Here's where Atatus comes into play, bestowing you with exceptional log monitoring features so that you can manage logs and work on errors.
Even though modern architecture creates an infinite stream of logs, many log management and aggregation tools could be helpful. By employing these log tools, you can retain a detailed picture of what the software delivers.
Table of contents
- What is Log Management?
- Atatus
- ManageEngine
- LogicMonitor
- Fluentd
- Graylog
- Coralogix
- Sumo Logic
- Mezmo (LogDNA)
- Datadog
- Splunk
What is Log Management?
Log management has become increasingly significant since businesses have focused more on software and frameworks, which further build up massive amounts of data to strengthen the security and conformity of applications and IT systems.
The term "log management" pertains to a broad aspect where it may be further cracked into several subsets, which would include collection and transport, storing, indexing and searching, analysis, monitoring, designed to alert, and reporting.
Log collection and transportation signifies sending logs either via API or implementing individual logging to send logs directly to the unified log manager. The process of storing logs involves arranging them in a reliable, safe storage system. It is important to integrate alerting with incident management tools
Log analysis implies organizing, visualizing, and sorting out correlations and even the latest developments. The process of monitoring involves defining thresholds and analyzing software behavior.
Log management initiatives equip users to browse through their logs and initiate about there own analysis. As part of reporting, stakeholders/businesses receive comprehensive reports about the project's progress. Let's take a closer look at some of the top log monitoring tools in this article that are best to manage logs.
Atatus
Atatus offers a completely managed cloud solution for log management, allowing organizations to focus on their core competencies rather than on data pipeline maintenance. Additionally, Atatus assists you in managing your website logs to ensure optimal performance.
Atatus is a scalable, cost-effective approach to centralized logging that collects logs from all systems and applications and aggregates them into a centralized, user-friendly interface. Process all logs, generate metrics, and visualize data from one central location.
Also, it provides API Logs Monitoring through which you can monitor API logs that contain information about the requests and responses sent between an API and its clients, including information about request parameters, response codes, response times, and error messages.
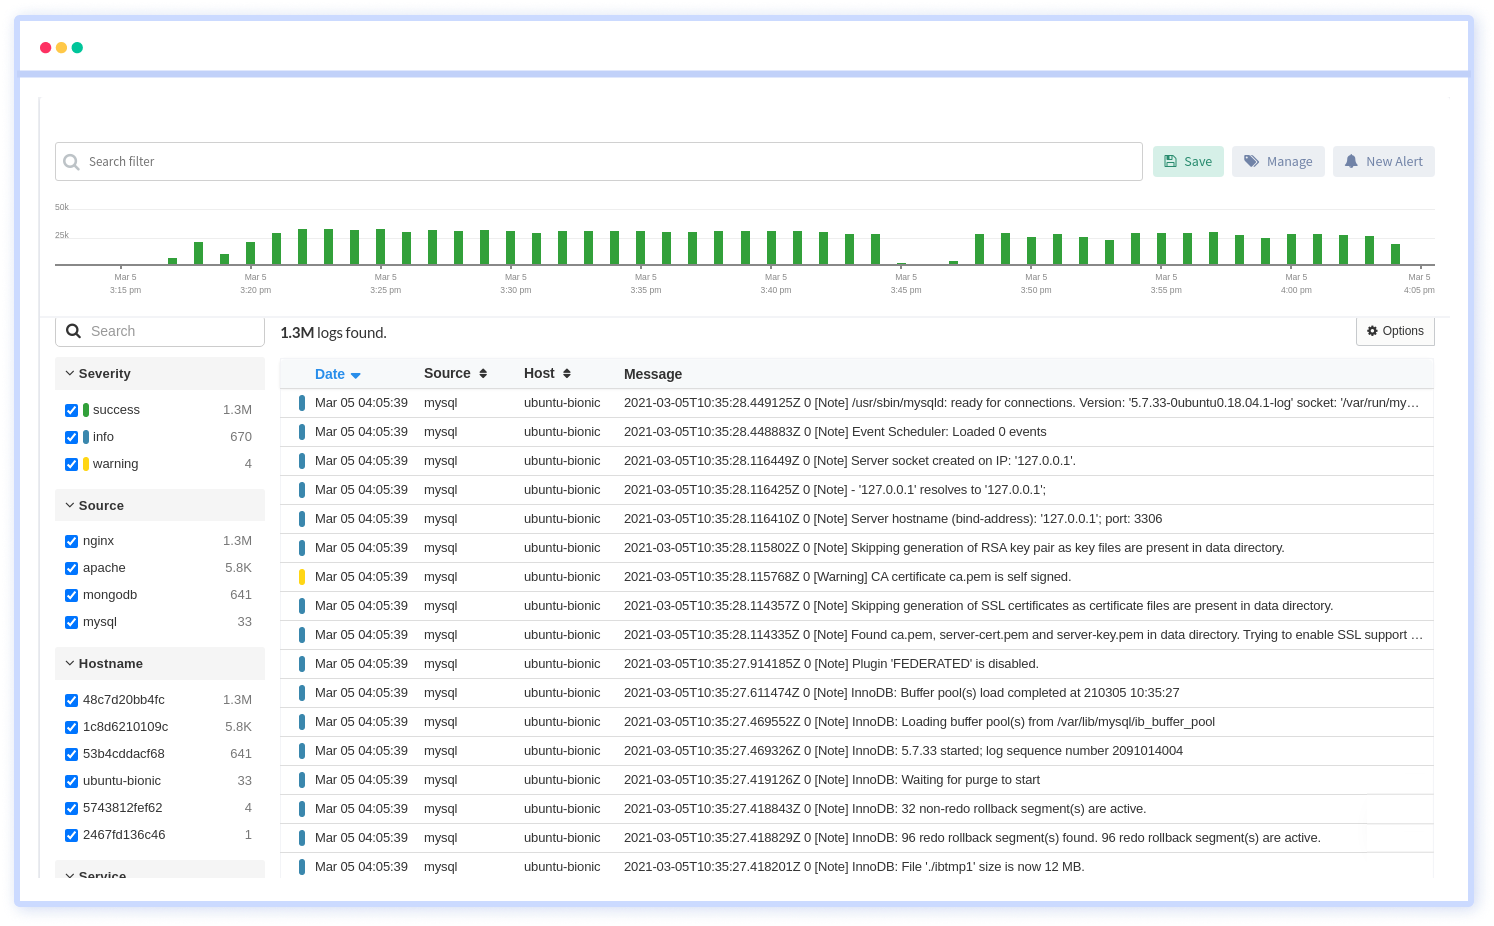
Troubleshooting logs in the production environment requires searching, filtering, and analyzing logs on the fly. Tailing across systems from a single UI assists in the correlation of log events with APM slow traces and errors, allowing for greater insights and faster resolution of issues.
Slice and dice data across log events with easy-to-use filters. Find the logs by hostname, service, source, messages, and more to focus on the critical events. Control the retention of the log messages and move older logs to more cost-effective storage tiers.
Atatus provides a quick visualization of log data to help identify trends, analyze messages, and troubleshoot issues. Atatus automatically archive logs in a predefined JSON format and import them back to analyze them again.
Feature highlights:
- Log events can be monitored in real-time
- Decide what to log and control
- Check logs against APM traces and errors
- Long-term storage of logs
- Alerts in real-time
ManageEngine
ManageEngine's EventLog Analyzer is a versatile SIEM log management tool. The ManageEngine’s EventLog Analyzer is a great investment for companies looking to standardize their compliance and security procedures because it is simple to set up and integrate.
ManageEngine is a pioneer amongst evaluating experts, with the capability to collect, organize, scrutinize, correlate, and find across 700 sources of log data and process up to 25,000 messages per second.
It comes preconfigured with almost 30 rules to define brute force threats, account lockouts, data breaches, web server exploits, and more; it's rather configurable.
ManageEngine EventLog Analyzer delivers robust log management features, including agent-based as well as agentless log collections, real-time activity tracking, and conformity reporting toolkits. It has the power to detect and combat vulnerabilities in business applications.
ManageEngine EventLog Analyzer is a Windows-based on-premises log management software that upholds logs from Windows and UNIX sources. By tracking and analyzing user activity and behavior in real-time, it offers SIEM capabilities, particularly for Windows, and can identify sophisticated attacks.
Feature highlights:
- A detailed analysis of the logs
- Instantly receive alerts if confidential files or folders have been changed.
- Analyze real-time event logs to mitigate cybersecurity threats.
- Keeping track of network devices
- Simplify system administration and eliminate system downtime by centralizing your syslogs.
LogicMonitor
With a focus on data hygiene and compliance, LogicMonitor features log intelligence at scale for both hybrid and multi-cloud frameworks. It enables users to unify monitoring, associate pertinent logs, and rationalize data into a single platform.
LogicMonitor has almost 2,000 interfaces, extensions, and pre-built layouts for on-premises and cloud architectures, and clientele may retrieve raw data up to a year old.
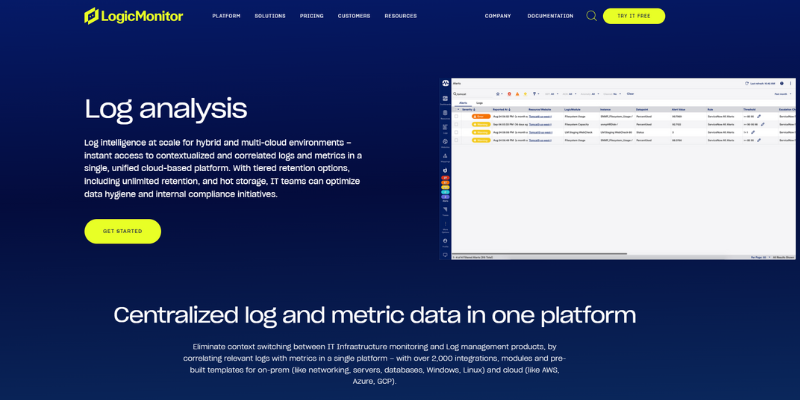
LogicMonitor employs machine learning to mitigate troubleshooting delays and optimize productivity by discerning abnormalities and clarifying them for enhanced root cause analysis.
With LogicMonitor, businesses can better understand their infrastructure within minutes, allowing them to achieve better optimization. It integrates infrastructure performance and analytics to enable organizations to optimize websites from scratch.
Feature highlights:
- Analyzing and learning about anomalies and AIOps
- Dashboards that can be customized and pre-built
- Monitor the performance of hybrid infrastructures
- Filtering and searching are customizable
- Boost control and downsize risk
Fluentd
Fluentd's efforts to format data as JSON as frequently as possible allow it to simplify all aspects of log data processing. Because JSON contains ample structure to be accessible whilst retaining flexible schemas, downstream data processing is standardized.
JSON can also be easily parsed by most computer languages, allowing for simpler integration with various applications. With Fluentd, you can unify the data collection and consumption processes, which will help you understand and use the data better.

With the community's help, Fluentd's capabilities may be expanded by linking many data sources and outputs, thanks to its adaptable plugin architecture. Fluentd streamlines and simplifies data connectivity with JSON. Fluentd offers memory and file-based filtering to preclude inter-node data loss.
Fluentd even supports robust failover and may be interfaced for high reliability. Over 2,000 data-driven firms employ Fluentd to enhance their products and solutions via healthier log data usage and analysis.
Feature highlights:
- Using JSON to unify logging
- A pluggable architecture
- Obtaining the minimum resources
- A built-in reliability feature
- Flexible and Simple
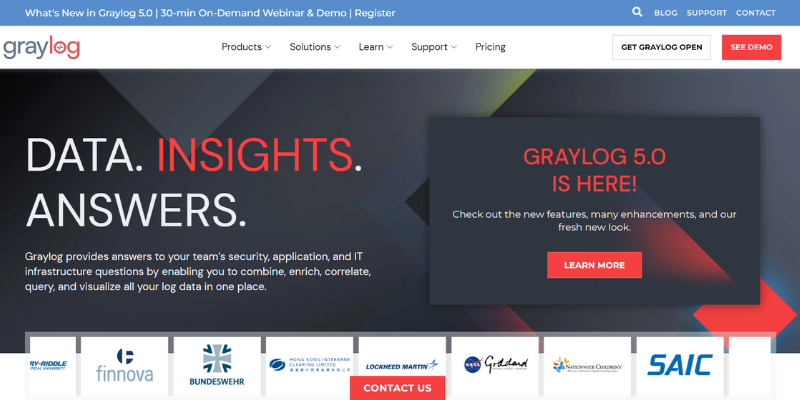
Graylog
Graylog employs Elasticsearch, MongoDB, and the Graylog Server, making it as complicated as ELK but with alerting, streaming, message rewriting, and geolocation.
Graylog is an open-source log management tool that ensures in-depth log collection and analysis. It is applied for Network Security, IT Operations, and DevOps teams to detect potential risks, abide by compliance regulations, and figure out the root cause of issues or errors.
Streaming enables data to be passed in real-time to specific streams and enables users to scrutinize database and web server failures in a single stream. These streams can be used to trigger alerts when new items are included or thresholds are exceeded.
Streams nullify latency, which is a key concern for log aggregation systems. With Drools, incoming messages can be added, removed, updated, or dropped after being assessed against a user-defined rules file.
Feature highlights:
- Analyze trends and anomalies
- Be alerted and act promptly
- Management and compliance can be automated
- Improved visibility across your IT infrastructure
Coralogix
Coralogix offers real-time predictive analysis and advanced algorithms to better serve enterprises in obtaining deep insights into their procurements and better perceiving user behavior.
Parsing rules are useful for transforming data and extracting relevant information, structuring unstructured logs, masking fields, and fixing formatting issues. Keep up with critical events using dynamic alerting and automatic detection.
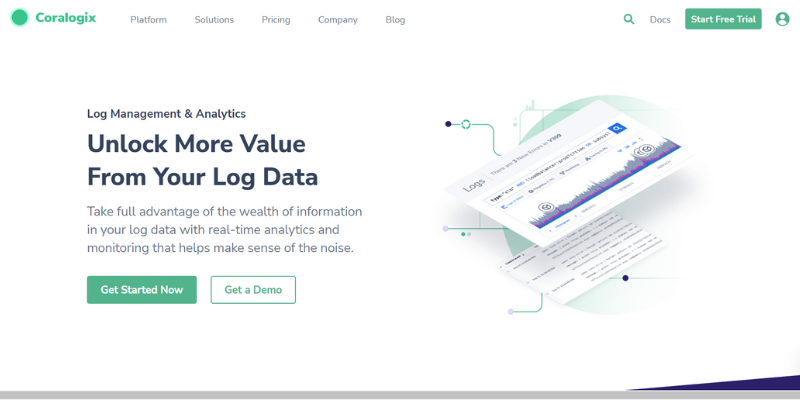
Log aggregation with Coralogix instantaneously clusters millions of unique logs into layouts for elevated analytics and evaluation. Elasticsearch syntax can be used directly to query archived data without affecting your daily quota. Coralogix can be used to reindex data for further analysis.
Feature highlights:
- Monitoring and storing logs more efficiently
- Dynamic alerting and anomaly detection reduce false positives
- Query Archive & Reindexing Provide Infinite Retention
- Streamline the process of parsing, transforming, and enriching your logs
Sumo Logic
Sumo Logic is a platform that upholds logs and metrics and applies machine learning to interpret real-time data. It may be configured to monitor what is occurring to apps constantly and rapidly illustrate the actual problem of any specific issue or occurrence.
Its key strength is its quick data processing, which eliminates the need for additional data management and analysis tools. Sumo Logic provides a whole stack of log management technologies, including centralized data visualization, anomaly detection, outlier detection, and predictive analytics.
Furthermore, it gives users visibility into Amazon web services, Microsoft, or even GCP cloud-based services and operations, along with over 150 apps and native web services for proactive visibility into third-party platforms.
A live dashboard and an interactive dashboard are both available in Sumo Logic. The live dashboard displays a plethora of real-time data in chronological order. However, it doesn't offer a choice for accessing older data.
The interactive dashboard fills that role. Using the interactive dashboard, you can analyze events and trends, zoom in on graphs, and identify rare events. To focus solely on them in the future, users can filter for systematic errors and exceptions.
Feature highlights:
- An efficient query language
- Algorithms and machine learning are used for advanced analytics.
- A centrally managed agent management system
- Provides high-resolution metrics.
- REST APIs are also available through the application.
Mezmo (LogDNA)
Mezmo (LogDNA) is a log management platform that permits users to search for logs and receive alerts whenever anything unusual happens. Mezmo is one of the recent entrants into the log management market, offering inexpensive agent-based and agentless log collection, search, and visual analytics.
Mezmo effortlessly evaluates major log line types and offers custom parsing layouts. Mezmo offers various pricing options depending on retention length and the number of clients. For instance, Mezmo is applicable to one user for free, including unlimited saved views and no log retention requirements.
Users can browse log data from any source, search logs centered on an app, host, or cluster, and simulate searches on them with keywords, exclusion words, chained expressions, or even data ranges. Users can save views to access common filters and searches, and alerts are set off counting on inclusion or exclusion.
Mezmo is a web-based interface for indexing and filtering logs. Agentless log collection via Syslog and HTTP(s) with full-text search and visual analytics is possible, besides the availability of visualizations and configurable dashboards.
Feature highlights:
- Real-time monitoring, analysis, and aggregation of logs are all possible with Mezmo.
- Archive, create real-time alerts, and parse fields automatically.
- It is capable of handling any data volume.
- It parses a wide variety of log formats automatically
- Provides your team with role-based control.
Datadog
Datadog Log Collection & Management is a cloud-based system for collecting and centralizing logs across an organization's systems. In addition to Sylog and Windows Events messages from operating systems, it can collect application logs.
Additionally, it has the ability to spot potential threats, find configuration errors, and monitor logs using threshold and anomaly detection. Using Datadog's log management system, users can isolate log accumulation from querying for optimum parsing, archiving, and tracking by accumulating log messages and merging them into an unbiased layout.
Aside from metrics management, application analysis, synthetic monitoring, and a separate monitoring service for role-based devices on-premise, these features are also included.
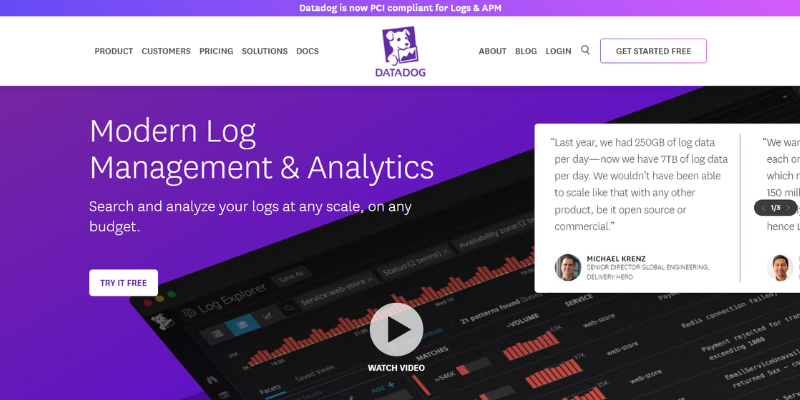
Datadog's APM users praise the platform for its ability to collect and ingest a wide range of data sources and generate intuitive dashboards. It has a SaaS dashboard that encompasses a log file viewer, monitoring tools, live log & archive storage, and an archive access utility.
It is a user-friendly tool that enables users to correlate individual logs and discover patterns. It can aggregate metrics and events from over 500 integrated technologies, tag and store them, and collect, search, and analyze logs to correlate them using specific traces, metric spikes, or security signals.
Feature highlights:
- The goal of full observability can be achieved
- Integrated log collection across multiple sites
- Analyzes log patterns automatically
- An easy-to-use search tool is included
- Retrieval and archiving
Splunk
Splunk's log management tool is intended for enterprise customers who require quick access to tools for searching, diagnosing, and reporting on data logs. In addition to Splunk Infrastructure Monitoring, the platform combines Splunk RUM, APM, and On-Call functionality.
A cloud-based log observers solution with enterprise billing options is an enterprise-ready solution. Splunk's log management tool is highly extensible and devised to cater to the needs of businesses with even a great deal of data logs.
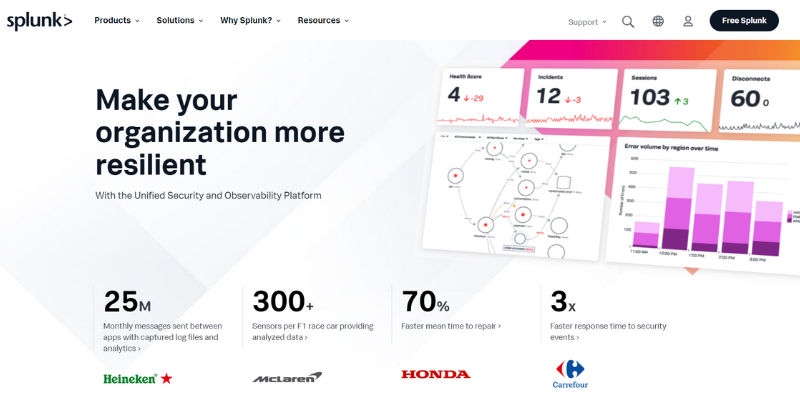
Splunk's Log Observer is a log monitoring solution designed for DevOps. It allows you to integrate with the most popular data sources and offers a point-and-click interface for rapid investigation of logs.
It also offers Live Tail features, allowing you to observe and filter logs in real time. Splunk is fast when searching for short-time data, but it stays behind when getting data from a longer period of time or when identifying trends.
Feature highlights:
- An alert and monitoring system to keep track of important events.
- A solution tailored for enterprises
- Integrated search, analysis, and visualization of data in real-time.
- Analyzing and searching with a profound query language
- Automated dashboard output for visual reporting.
Conclusion
Logs contain unique data on the software's overall state and reliability but also a bunch of irrelevant data. There can be countless Log management and aggregation tools to help with the complex data extraction task from countless log files.
These tools can assist organizations in gathering log data, eliminating unnecessary data, and fixing priorities. These tools play a key role in the diagnosis of security vulnerabilities. Consequently, log management has the ability to boost performance and receive updates
Log management software aids in the prevention of IT problems, the oversight of file integrity, and the enhancement of business productivity. It gathers, organizes, and analyzes data in a user-friendly environment.
Log management and aggregation tools combined with predictive analytics may give the organization access to IT operations and help them anticipate problems before they happen.
Log management is indispensable for evaluating problems and failures since it permits system administrators to set up regulations and layouts to start sorting, finding, and analyzing preceding log operations.
Logs Monitoring made easy with Atatus
With the Atatus Logs Monitoring platform's cost-effective, scalable approach to centralized logging, you can gain complete visibility across your entire architecture. All log data is processed in one place and can be visualized.
All high-priority incidents are reported immediately by endowing Atatus. Using error logs, custom queries, or trigger conditions, you can configure advanced alerts.

Depending on your log analysis, you may receive notifications of certain events. Logging events and slow traces can be correlated with APM errors and slow traces to simplify troubleshooting. Discover more and resolve problems faster.
Analyze, search, and filter your logs on the fly in your production environment to troubleshoot problems. From a single interface, tail across systems similar to "tail -f".
Atatus offers a free 14-day trial to streamline your log management!
#1 Solution for Logs, Traces & Metrics
![]() APM
APM
![]() Kubernetes
Kubernetes
![]() Logs
Logs
![]() Synthetics
Synthetics
![]() RUM
RUM
![]() Serverless
Serverless
![]() Security
Security
![]() More
More

![New Relic vs Splunk - In-depth Comparison [2026]](/blog/content/images/size/w960/2024/10/Datadog-vs-sentry--19-.png)
![Splunk vs Prometheus: A Side-by-Side Comparison [2025 Guide]](/blog/content/images/size/w960/2024/08/Datadog-vs-sentry--13-.png)