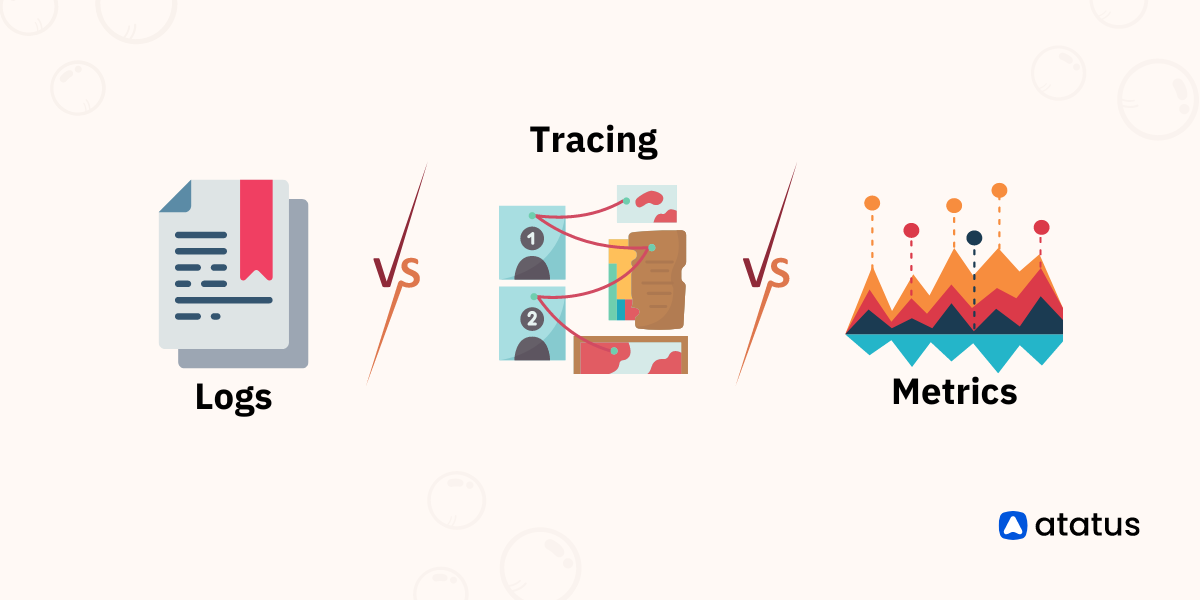
Metrics tell you what broke, logs tell you why, traces tell you where. A practical guide to the three pillars of observability, with real incident examples and OpenTelemetry.
One Java application can generate up to hundreds of metrics. There are a few crucial indicators for monitoring that you should pay attention to thread counts, garbage collection, and memory usage. These metrics are accessible via JMX.
OpenTelemetry and OpenTracing are open-source projects to enhance observability in distributed systems, but they serve distinct purposes. Take a look at their key differences and how to migrate from OpenTracing to OpenTelemetry.
Monitor your entire software stack
Gain end-to-end visibility of every business transaction and see how each layer of your software stack affects your customer experience.