Optimize Java Application Performance by Monitoring JVM Metrics

Although Java has been around for 27 years, enterprise applications still favor it as one of their preferred platforms.
Java's functionality and programming flexibility increased concurrently with technological advancement, keeping it a useful language for more than 25 years. Outstanding examples of this progression include new garbage collection algorithms and memory management systems.
Even though Java has advanced and now contains more complex algorithms that are compatible with modern applications, you might still need to adjust the Java virtual machine's (JVM) speed to meet your application’s demands.
Applications have different needs and requirements in terms of scalability and performance. You must therefore constantly keep an eye on the JVM's performance.
Here's how it is done:
One Java application can generate up to hundreds of metrics, but not all of them are necessary for monitoring availability and performance. In fact, you'll likely use more once you're ready to figure out what's wrong with the application.
However, there are a few crucial indicators for monitoring that you should pay attention to thread counts, garbage collection, and memory usage. These metrics are accessible via JMX.
Additionally, as monitoring and tuning go hand in hand, knowing how these particular metrics function will help in optimizing JVM performance.
#1 Garbage Collection
Due to the strong connection between garbage collection (GC) and heap memory availability, it is essential to monitor GC overhead as well. When JVM has to clear out space for an application to use, it performs a garbage collection operation.
In fact, the garbage collector will be active regularly to remove both transient and permanent things. When determining which memory to release, this procedure might consume a lot of computer resources, which can cause overhead and poor JVM performance.

In this situation, you must keep an eye on how frequently and for how long the GC cycles. In the old generation space, in particular, frequent and prolonged GC cycles are an indicator of poor performance or can mask Java memory leaks.
Likewise, monitoring will enable you to adjust the GC by the varying GC pause times that different applications require, whether they are longer or shorter.
It is also important to point out that relying on JVM metrics for your logs is one thing, but if you require more in-depth knowledge of what is occurring inside your Java Virtual Machine, we highly recommend gathering and analyzing garbage collection logs for fine granularity data.
You will learn about the various trash collection steps, how much memory was freed up as a result of the garbage collection, and what precipitated it. A good JVM-based system won't typically spend more than a few percent of its total resources on trash collection.
If you notice a lot of garbage collector activity, one of the first things to check is whether your application is close to running out of memory. One of the most frequent problems with heavy garbage collection that we run into during consulting projects is a lack of heap memory.
#2 JVM Threads
JVM thread monitoring is crucial for ensuring optimal application performance.
Using threads, your Java application executes code. They are to JVM what operating system processes are to those systems.
Also read: Multi-Thread in Node.js
Similar to when you have too many processes running, having too many active threads will increase CPU utilization, which will slow down servers and even applications.
In addition, more active threads result in more context switching between CPUs, which uses up more resources on your system.
A backend that responds slowly or not at all can also be indicated by an excessive number of active threads. Setting a thread limit is the obvious approach.

To keep the response time as short as possible, you'll need to adapt your architecture or add more threads if you anticipate receiving a lot of concurrent requests.
Serving user requests is the responsibility of threads. To finish a request and submit the response, they execute all the necessary code. To accommodate all user requests, there must be enough open threads.
A user request will take longer to process if you don't have enough threads, which will slow down the application's response time.
A thread keeps the referred objects in the heap memory for a longer time when processing user requests more slowly. This has an impact on the memory space and may cause OOM or GC problems.
As you can see, it's important to keep track of how many active and idle threads there are. It's crucial to keep track of how much time the thread has been using the CPU.
#3 Memory Usage
One of the most crucial Java resources to monitor is memory usage if you want to stop leaks and solve unforeseen problems.
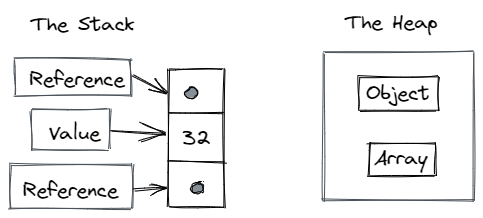
A heap is a reserved area of physical memory that is reserved when a JVM-based application starts. When you create objects, the JVM makes use of that space.
To give you a few examples, creating an HTTP connection, reading data from a file, and executing a loop all use memory. Up until the object is accessed from the code, the memory is used.
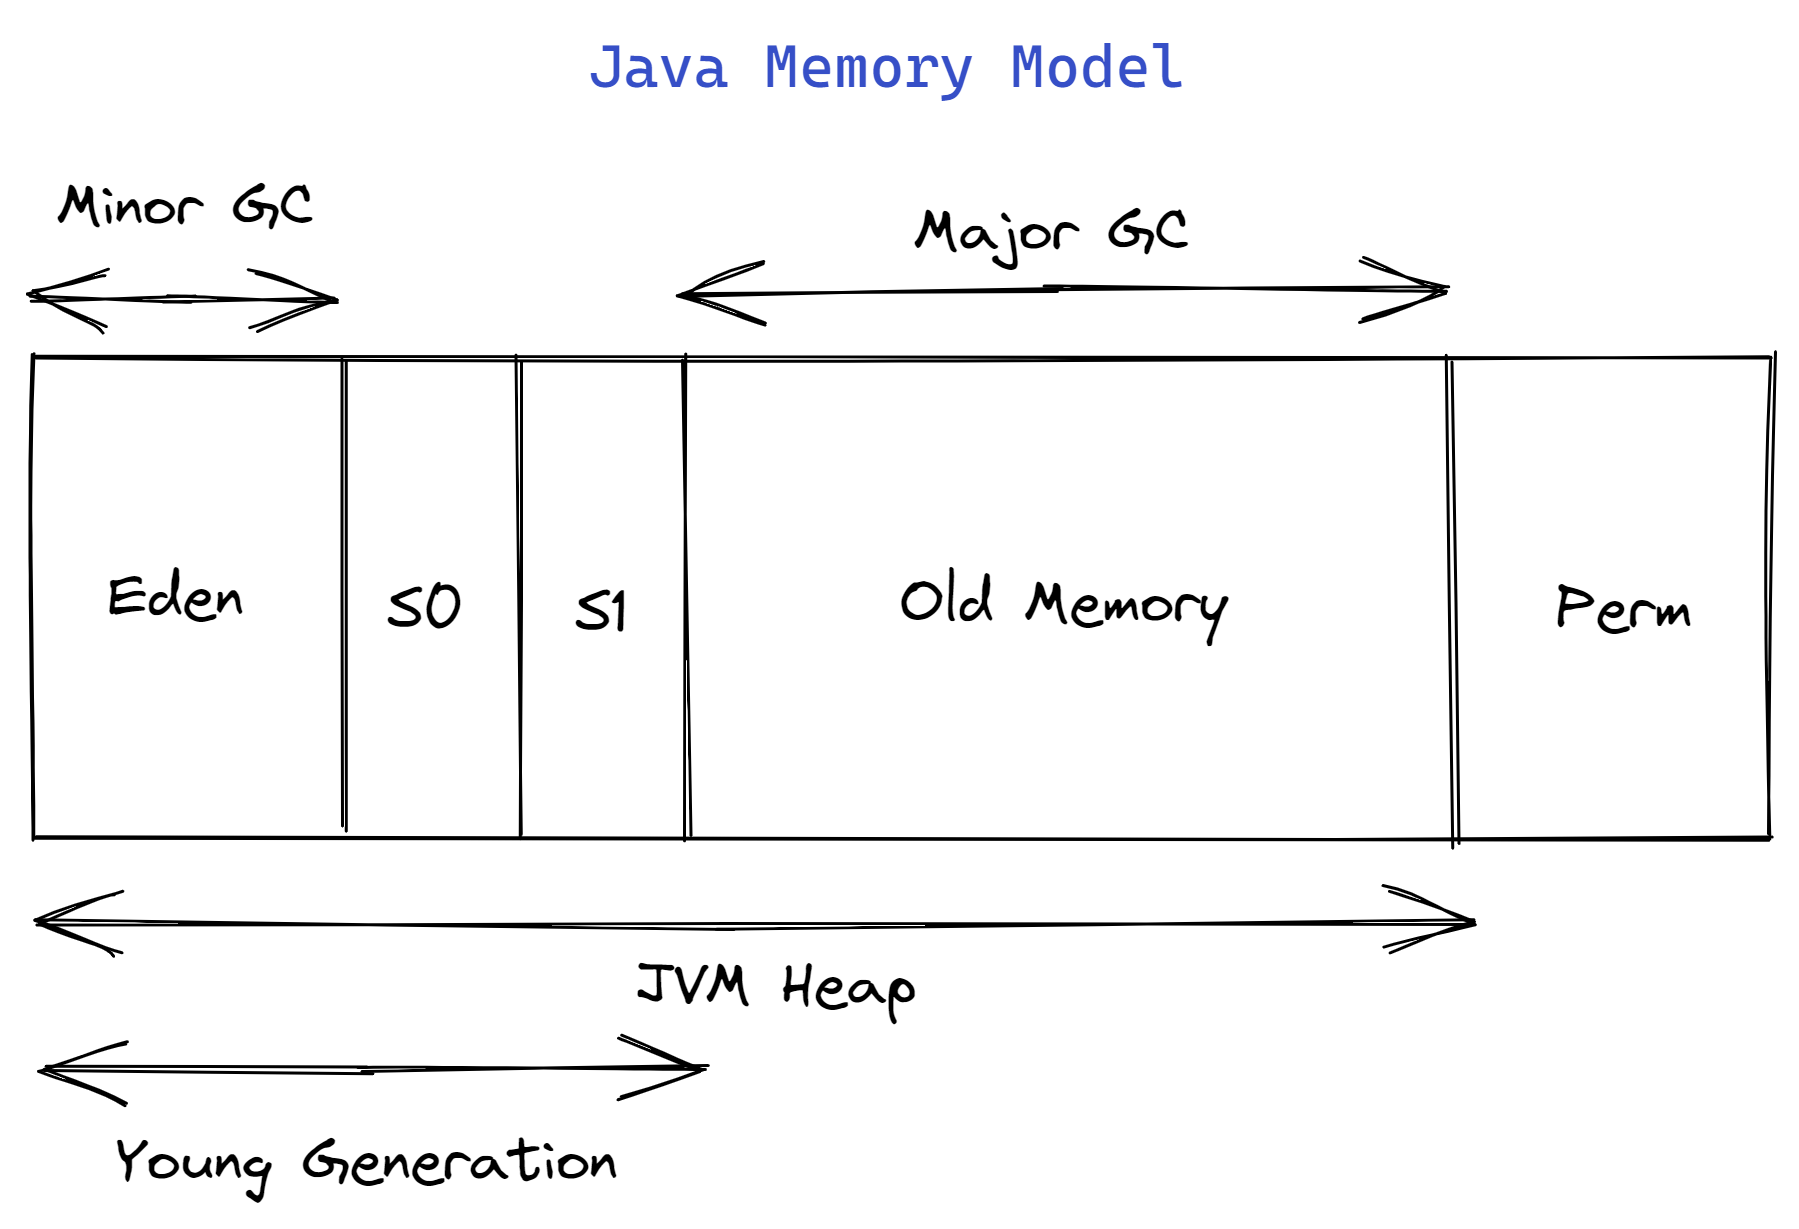
When it is no longer required, it will be treated like trash, and when the time is right, the garbage collector will collect it. The trash itself is separated into many areas.
For instance, there is a location called the young generation that houses recently formed, transient items; the old generation, which houses persistent objects; a specific location in memory for the code itself; and so forth. The garbage collector algorithm you select determines how the memory space is organized.
The most important thing to remember when working with memory and JVM-based applications is that your code requires memory to function. More memory will be required as the more data you handle and the more intricate your algorithms are.
The Java Virtual Machine will throw an OutOfMemory error if there is not enough contiguous space to assign objects and you do not have enough memory to create new objects.
Even though you could have enough room, it might not be sufficient to place a single, large object. It could signify that some functionality isn't working or even that the entire application crashed, depending on how the application was created.
If the memory is leaking, the same thing can occur. The garbage collector will be unable to remove objects from memory when an application maintains references to objects even after those objects are no longer required.
The JVM heap size will then become insufficient due to the increased memory usage, and you will experience an OutOfMemory error.
The OutOfMemory issue typically occurs when the JVM garbage collector attempts to clean up the memory but fails after extensive work. This may consume a lot of resources, which will slow down or even halt the operation of your application.
We refer to an occurrence that causes the garbage collector to stop the world as a stop-the-world event. Keep in mind that one of the frequent issues with the performance of JVM-based applications is the problems with memory and excessive garbage collection.
Another temptation is to bring a huge pile, just in case. However, that is also a bad idea. The garbage collector may have to work harder to clean up your JVM process's heap area the more of it there is.
Additionally, some systems have the ability to share OS-level caches like the I/O cache. Two of them are Apache Solr and Elasticsearch. In such circumstances, allowing the operating system to use additional memory will improve the performance of the JVM as a whole.
The heap is obviously not everything. The JVM-based application has access to heap memory as well. It can be used to decrease the amount of heap memory used and works in tandem with the memory used as the heap.
You should be able to access all the essential JVM metrics for heap and off-heap memory use through your Java monitoring tools. Each memory pool's utilization, including that of the Eden space, the survivor space, and the old generation space, ought to be visible.
These measurements enable you to determine if the heap capacity is being approached. To determine if there is any free memory, it is also necessary to look at the operating system's overall memory usage.
Finally, while monitoring is a tool that can assist with heap setup, there is no one value that will do so. Nevertheless, a decent starting point is to limit your Java's peak heap utilization between 70 and 80 percent, depending on your garbage collector settings.
Conclusion
The secret to getting the best performance out of your applications is to use JVM metrics. You can use the appropriate observability tools for both post-mortem analysis and your daily activities.
You can rely on the observability platform to inform you as soon as things start to go wrong by giving you the ability to slice and dice the metrics, connect them with logs and traces, and establish alerts on the important JVM metrics.
Even the best tools won't be of much use to you if you don't understand the fundamentals of what the metrics imply and what to expect from them. Hopefully, this blog post helped you grasp the essential JVM metrics a little bit better.
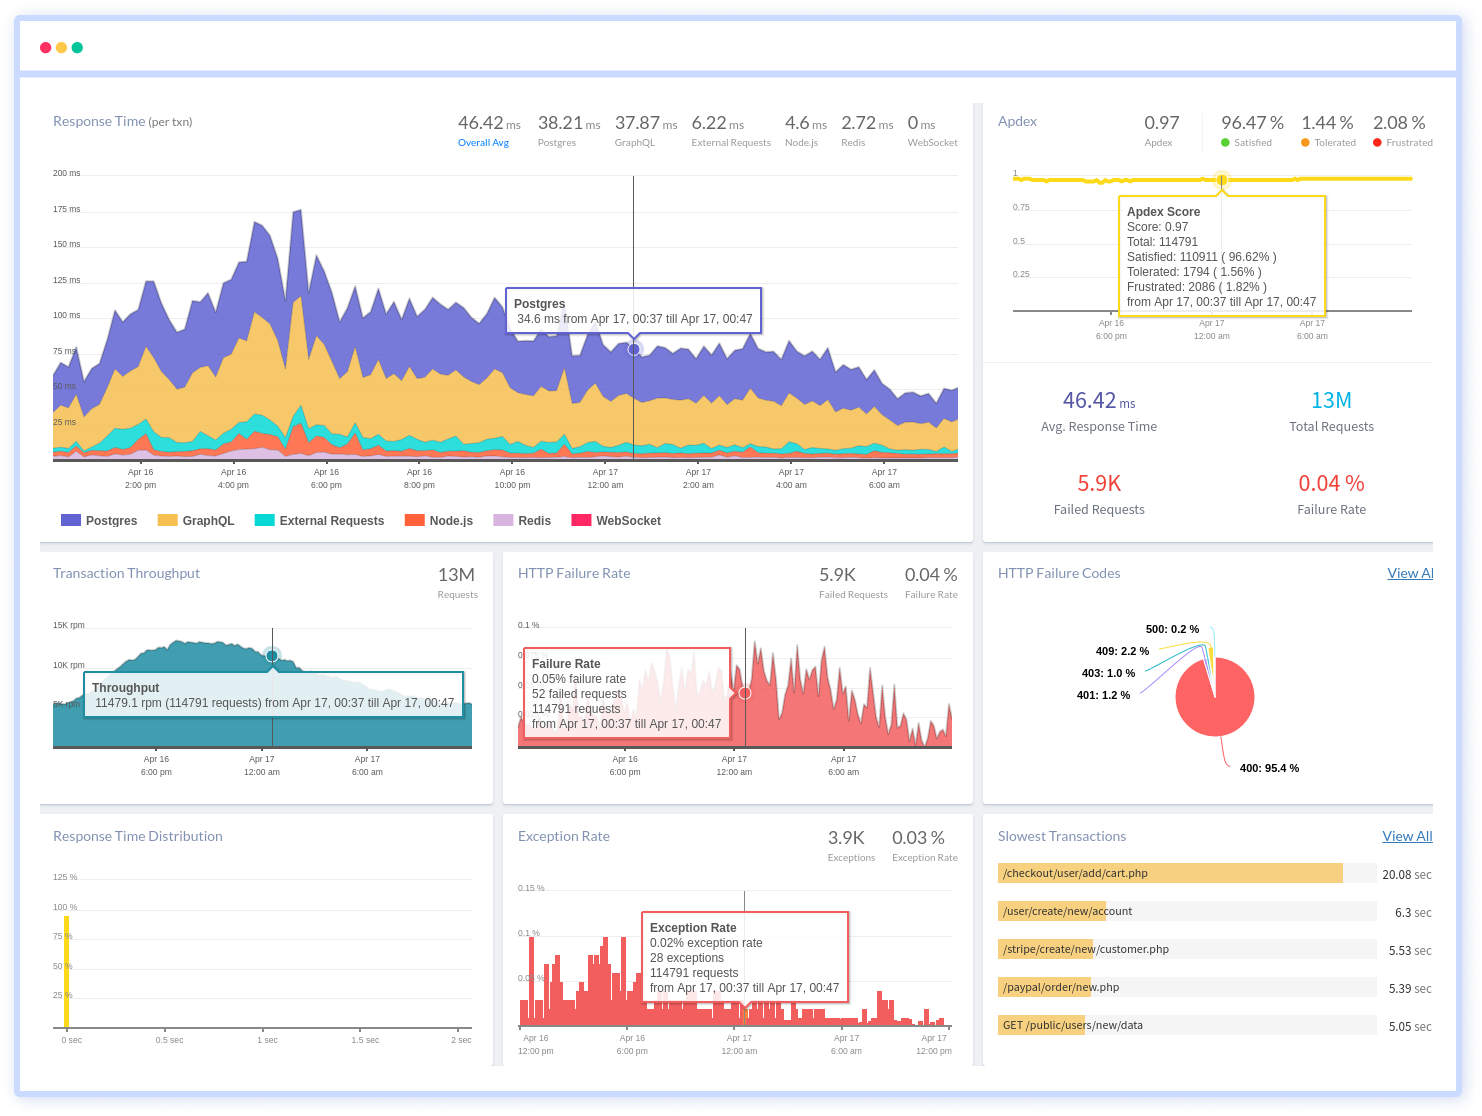
Monitor Your Java Applications with Atatus
Atatus keeps track of your Java application to give you a complete picture of your clients' end-user experience. You can determine the source of delayed response times, database queries, and other issues by identifying backend performance bottlenecks for each API request.
Atatus Java performance monitoring made bug fixing easier, every Java error is captured with a full stack trace and the specific line of source code marked. To assist you in resolving the Java error, look at the user activities, console logs, and all Java requests that occurred at the moment. Error and exception alerts can be sent by email, Slack, PagerDuty, or webhooks.
#1 Solution for Logs, Traces & Metrics
![]() APM
APM
![]() Kubernetes
Kubernetes
![]() Logs
Logs
![]() Synthetics
Synthetics
![]() RUM
RUM
![]() Serverless
Serverless
![]() Security
Security
![]() More
More