Compare Splunk vs Dynatrace in Log Management, Infrastructure Monitoring, Application Performance Monitoring (APM), Pricing to determine the best solution.
New Relic and Grafana were compared using evaluation of their features. Explore their performance in APM, log management, application security, and more.
I have compared New Relic and Prometheus across key aspects like data collection, storage, visualization, and pricing to help you choose the right tool.
I have compared Splunk and Prometheus across log management, metrics monitoring, pricing, and more. See their differences to understand their strengths.
Dynatrace and New Relic are top monitoring tools. Explore Dynatrace vs New Relic across key aspects like APM, log management, and pricing to find the best fit
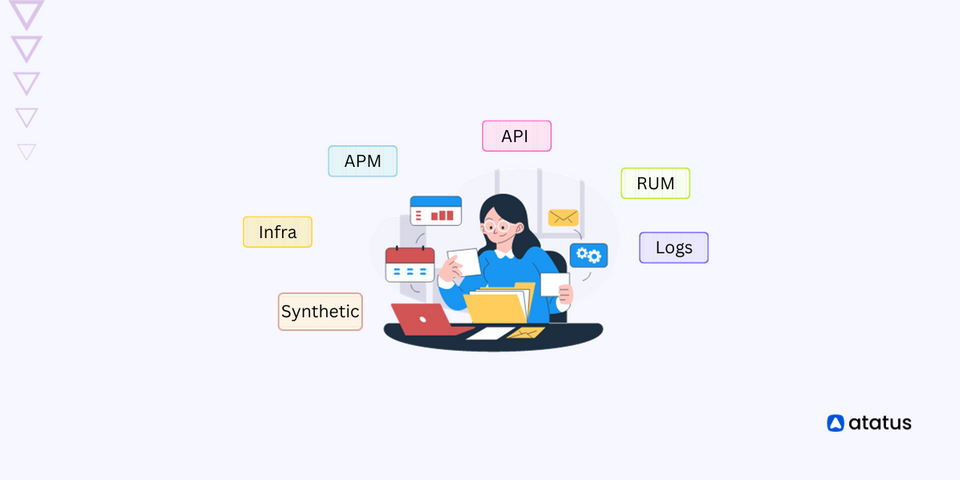
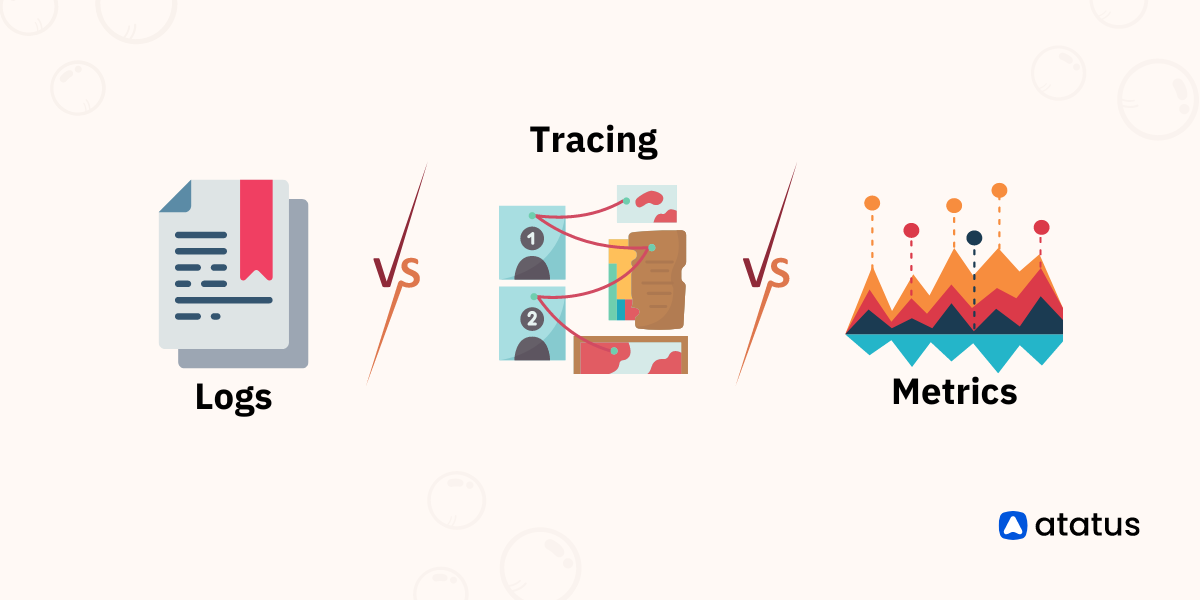
Unlock the power of unified observability with Atatus and stay ahead of the game with this comprehensive guide on observability in the modern digital landscape.
If you are a developer or system administrator, you might already know how important monitoring your applications are. Focussed monitoring tools help a long way in tackling performance bottlenecks.
Monitor your entire software stack
Gain end-to-end visibility of every business transaction and see how each layer of your software stack affects your customer experience.
![Splunk vs Dynatrace - In-Depth Comparison [2025]](/blog/content/images/size/w960/2024/09/Datadog-vs-sentry--17-.png)
![Splunk vs Prometheus: A Side-by-Side Comparison [2025 Guide]](/blog/content/images/size/w960/2024/08/Datadog-vs-sentry--13-.png)