Unified Observability: The Right Way Ahead
Observability, in modern software engineering, has evolved into a paramount concept, shedding light on the intricate inner workings of complex systems. Three essential pillars support this quest for clarity: logging, traces, and metrics. These interconnected elements collectively form the backbone of observability, enabling us to understand our software as never before.
Think of a system as a bustling city. Logging would be akin to security cameras capturing events in real-time; traces are the pathways that showcase how data travels from one end to another, much like mapping a courier's journey across the city; and metrics, providing aggregated numerical data like a city's daily footfall or energy consumption.
The union of these three pillars renders us what we call today as Unified Observability. It should not be confused with other market terms. Embracing these tools is not just about troubleshooting; it's about gaining a comprehensive understanding of the systems we build and ensuring they serve their purpose effectively.
If you want to know the difference between each of these, check out this blog:
Logging, Traces, and Metrics: What's the difference?
Table Of Contents:
- What makes Logs, Metrics, and Traces Indispensable?
- Isolated and Unified: What to Choose?
- Atatus: Unified Observability Solution
What makes Logs, Metrics, and Traces Indispensable?
Logs, metrics, and traces are essential components of observability because they serve distinct yet interconnected purposes, Collectively, logs, metrics, and traces create a 360-degree view of software systems.
This comprehensive observability allows organizations to detect, diagnose, and address issues swiftly, leading to improved system reliability, enhanced user experience, and streamlined maintenance and development processes.
Here's what makes each of them vitally important:
Logs
- Logs provide a detailed historical record of events and activities within a system. They capture information such as errors, warnings, user interactions, and more.
- When issues or anomalies occur, logs are invaluable for diagnosing problems, identifying their root causes, and debugging code.
- Logs are crucial for compliance with regulations, security audits, and ensuring that data and activities are tracked and documented.
Metrics
- Metrics offer real-time insights into the performance and behavior of a system. They provide data on resource utilization, response times, throughput, and other critical operational parameters.
- Metrics are used to set up alerts based on predefined thresholds. This proactive monitoring allows teams to respond swiftly to issues before they impact end-users.
- By tracking resource consumption and performance trends over time, metrics aid in capacity planning and scaling infrastructure as needed.
Traces
- Traces provide end-to-end visibility into the flow of requests across various components and services within a distributed system. This is particularly vital in microservices architectures.
- Traces help identify bottlenecks and performance bottlenecks in a distributed system, enabling optimization and better user experience.
- They help in mapping dependencies between services, making it easier to understand how changes or issues in one service can affect the entire system.
Isolated or Unified: What to choose?
The choice between a specialized solution for logs, metrics, or traces, and a unified observability solution that encompasses all three depends on your specific needs, existing infrastructure, and the complexity of your system. There is no one-size-fits-all answer, and the best choice may vary from one organization to another.
Compelling advantages of having a unified solution:
- A unified solution provides a comprehensive, 360-degree view of your system. This means faster and more accurate problem diagnosis as you can correlate data from logs, metrics, and traces seamlessly.
- Managing multiple standalone solutions can introduce overhead both in terms of integration complexity and licensing or usage costs. A unified platform might offer bundled pricing, reducing total cost of ownership.
- Juggling multiple platforms can be a strain on your operations team. A unified platform offers a single source of truth, which can simplify training, onboarding, and daily operations.
- Using a single platform ensures uniformity in data presentation, visualization, and alerting. It also reduces the "context-switching" required when hopping between different tools.
- Teams can collaborate more effectively when they are all using the same platform. For instance, when an anomaly is detected through metrics, it's easier to dive into the relevant logs or traces when everything is accessible within the same environment.
- As your system grows and becomes more complex, the lines between logs, metrics, and traces might blur. Starting with a unified solution prepares you for this complexity.
However, there might be situations where a piecemeal approach makes sense:
- If you've already heavily invested in a logging solution, for instance, and are satisfied with its performance, it might not make sense to immediately migrate to a unified platform.
- Some systems or applications might have very specific requirements that are best met by specialized solutions dedicated to logging, metrics, or tracing.
- Smaller organizations or startups might not have the budget for a comprehensive unified solution and might need to prioritize based on immediate needs.
- An organization might prefer to gradually adopt observability practices, starting with one component and adding others as the need arises.
In many cases, organizations opt for a hybrid approach, combining specialized tools for specific needs with a unified observability solution for cross-domain correlation and insights. This approach provides the flexibility to choose the best tools for the job while still benefiting from an integrated overview of the system.
Ultimately, the choice should be driven by your unique requirements, the size and complexity of your infrastructure, your budget, and your team's expertise. It's essential to evaluate the available options, conduct a thorough needs assessment, and consider your long-term observability strategy to make an informed decision.
Atatus: Unified Observability Solution
Atatus is a full-stack observability platform that provides actionable, real-time insights into your web and backend applications.
It is an all-in-one integrated observability platform that makes application monitoring super easy with transaction monitoring, database monitoring, external requests monitoring, live performance data, smart notifications, compare releases, full-text search, and error tracking.
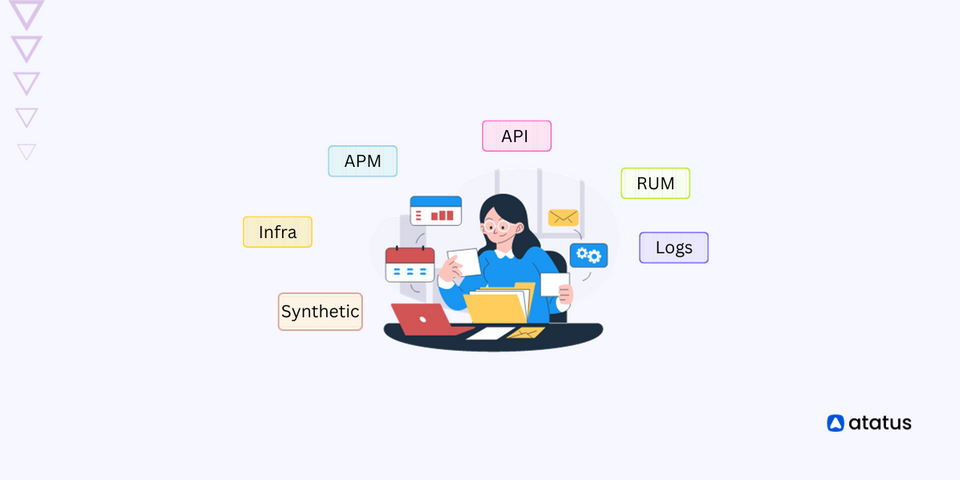
They provide a host of different tools such as:
- Application Performance Monitoring
- Real User Monitoring
- Infrastructure Monitoring
- Log Management and Analytics
- Synthetic Monitoring
- API Analytics
- Kubernetes Monitoring
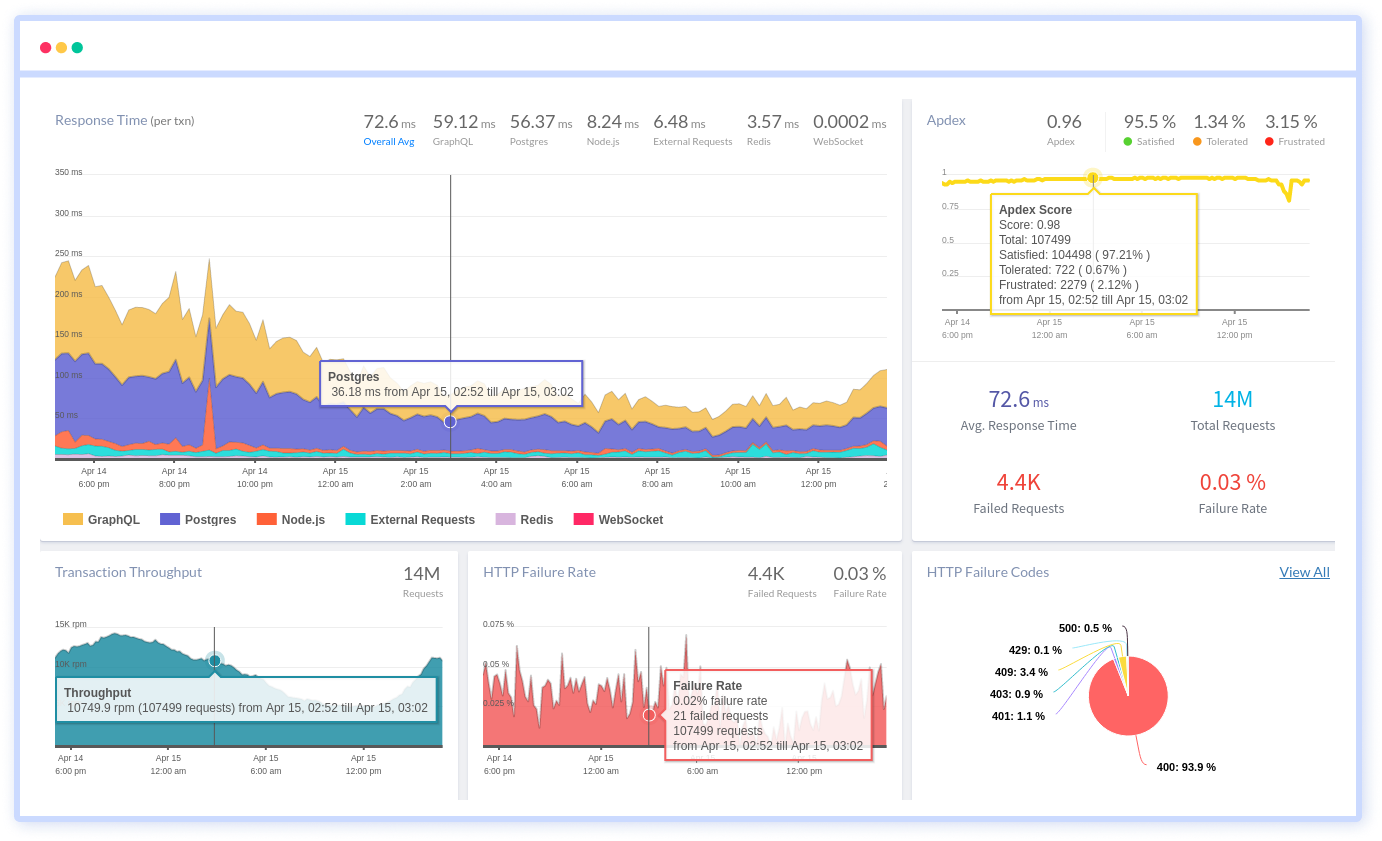
1. Application Performance Monitoring (APM)
With Atatus APM, get the complete picture of all the transactions occurring in the background, which are potentially slowing down your customer’s UX. It keeps a vigilant eye on your software, tracking its health, performance, and responsiveness in real-time. With detailed insights and proactive alerts, you'll always be one step ahead, ensuring a seamless user experience.
Features:
- Track and analyze individual transactions to identify bottlenecks, errors
- Identify slow database queries
- Understand how your third-party API calls are performing
- Get detailed information about errors
- Capture and analyze the detailed execution flow of a specific user session
- View Runtime Metrics
- Deployment Tracking
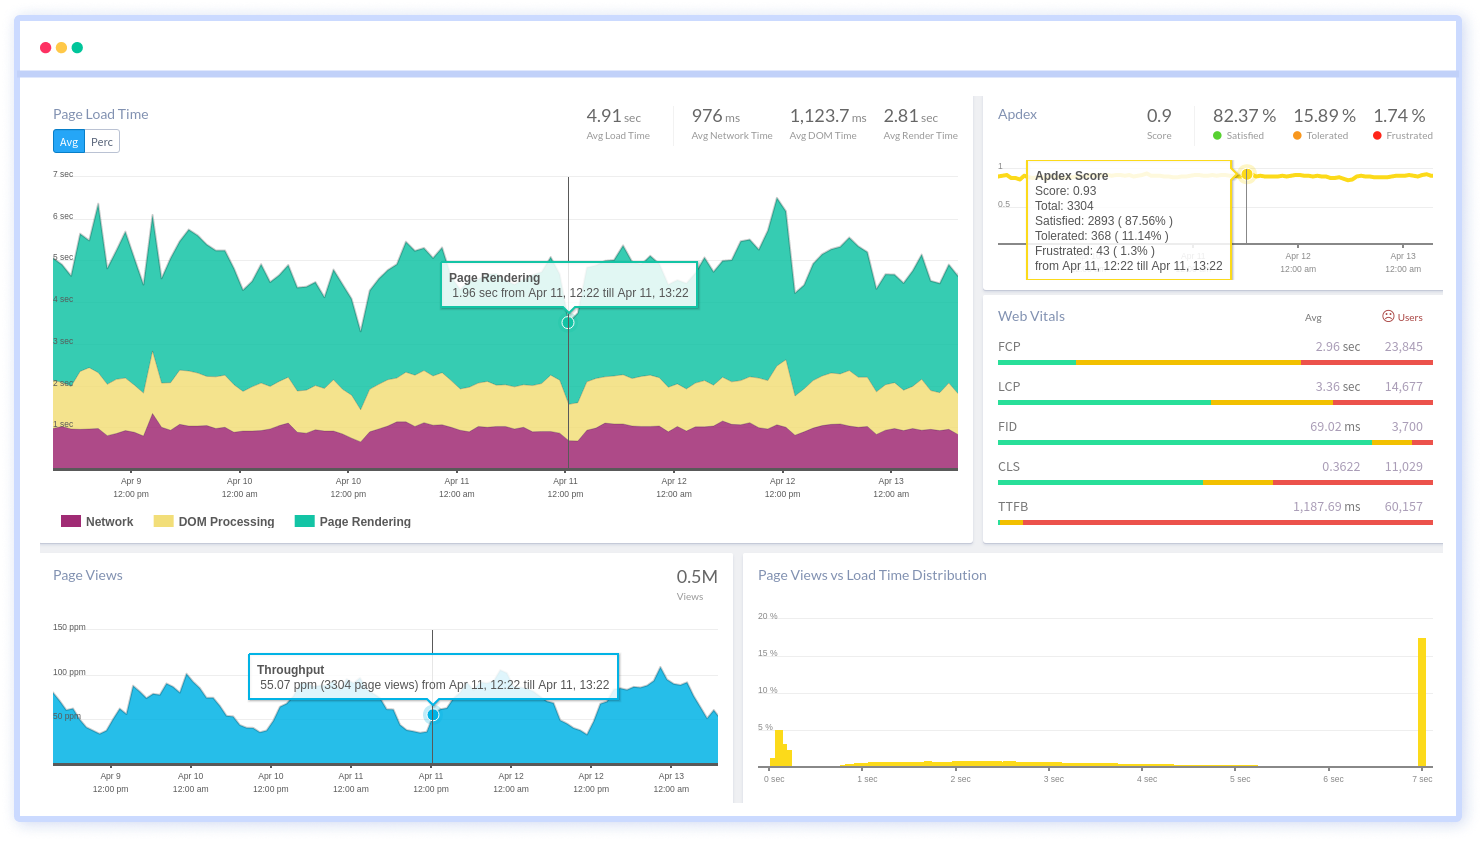
2. Real User Monitoring
Capture the authentic user experience with RUM. Monitor and analyze real-user interactions on your platform, identify areas of improvement, and tailor your solutions to meet genuine user needs, ensuring the most optimal user journey.
Features:
- Monitor slow-loading pages
- Monitor XHR Calls, measure route changes
- Identify and address JavaScript errors proactively
- Track user interactions and engagements on your web pages
- Know how AJAX requests impact the end-user experience
- Measure various aspects of web performance, loading, and interactivity
- View performance metrics broken down by geographic regions
- Set up alerts based on predefined thresholds for critical browser performance metrics
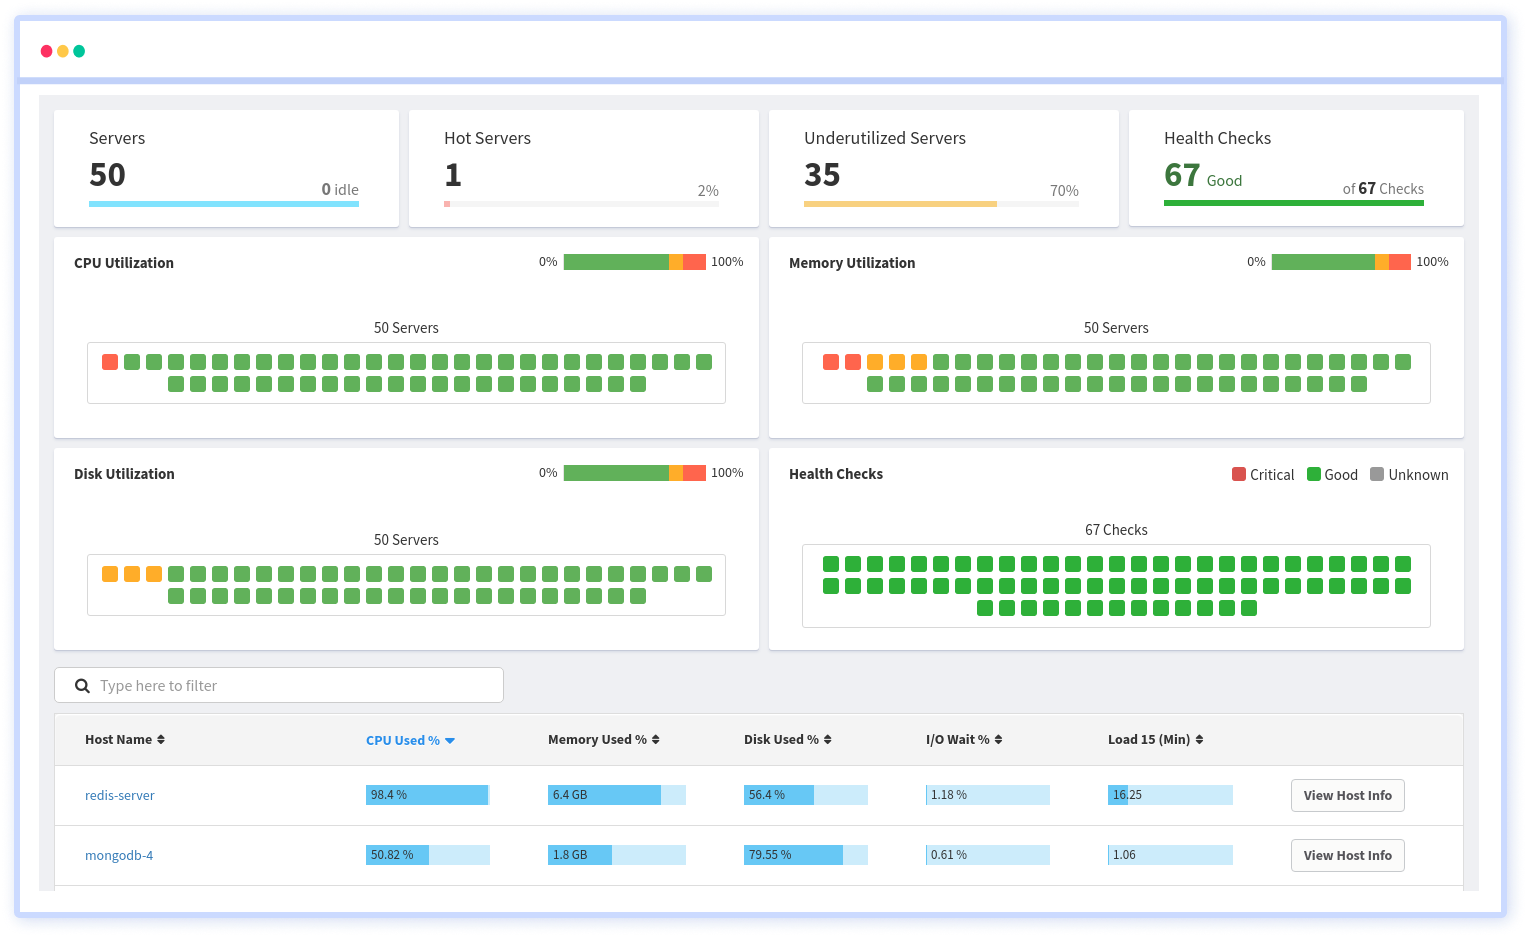
3. Infrastructure Monitoring
Guard the backbone of your digital operations with our Infrastructure Monitoring solution. Track system health, resource utilization, and potential vulnerabilities across all your servers, networks, and hardware. Ensure peak performance and proactive issue resolution.
Features:
- Tracks server-level metrics such as CPU usage, memory usage, disk I/O, and network activity
- Monitors containerized environments, providing insights into the performance of Docker containers and Kubernetes clusters
- Offers support for monitoring infrastructure across various cloud providers (e.g., AWS, Azure, GCP)
- Tracks and manages the inventory of infrastructure components, including servers and containers
- Search, filter and group packages and inventory data
- Correlate application issues with underlying infrastructure problems
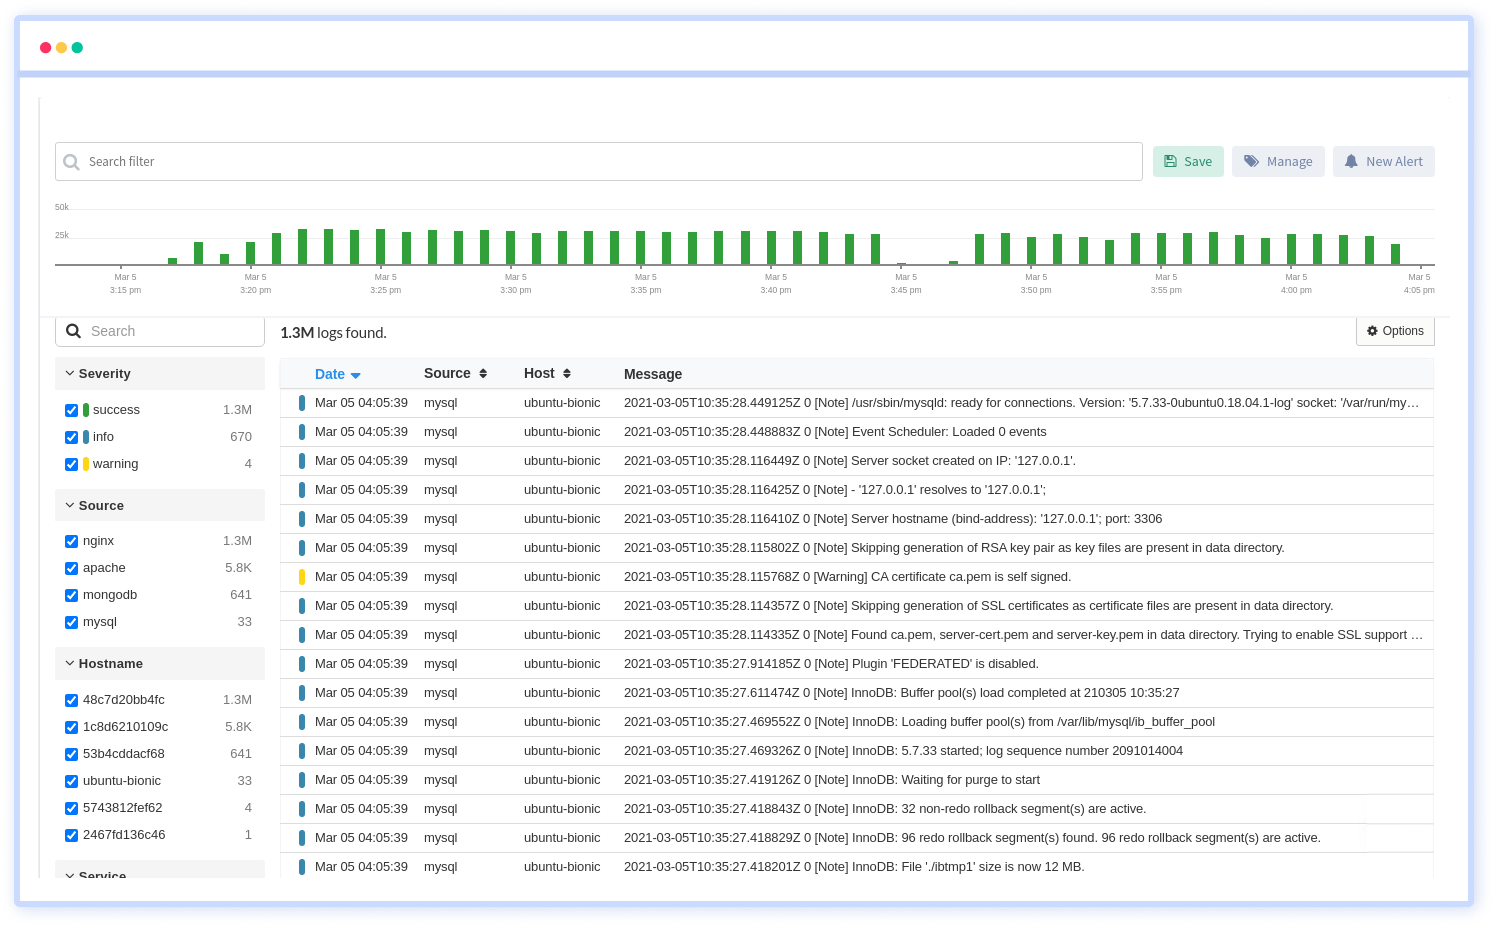
4. Log Management and Analytics
Turn raw data into actionable insights with our Log Management and Analytics service. Aggregate, analyze, and visualize logs from various sources. Diagnose issues, improve system efficiency, and drive decisions powered by in-depth log analysis.
Features:
- Collect logs from a variety of sources, including applications, servers, and cloud platforms
- Parse logs to extract key fields and attributes, making it easier to search and analyze log data
- Correlate logs with APM slow traces and errors
- Provides a powerful search interface for querying logs in real-time
- Aggregates logs from different sources into a centralized location
- Users can configure log retention policies to manage the storage duration of log data
- Enables users to trace the flow of requests across different components
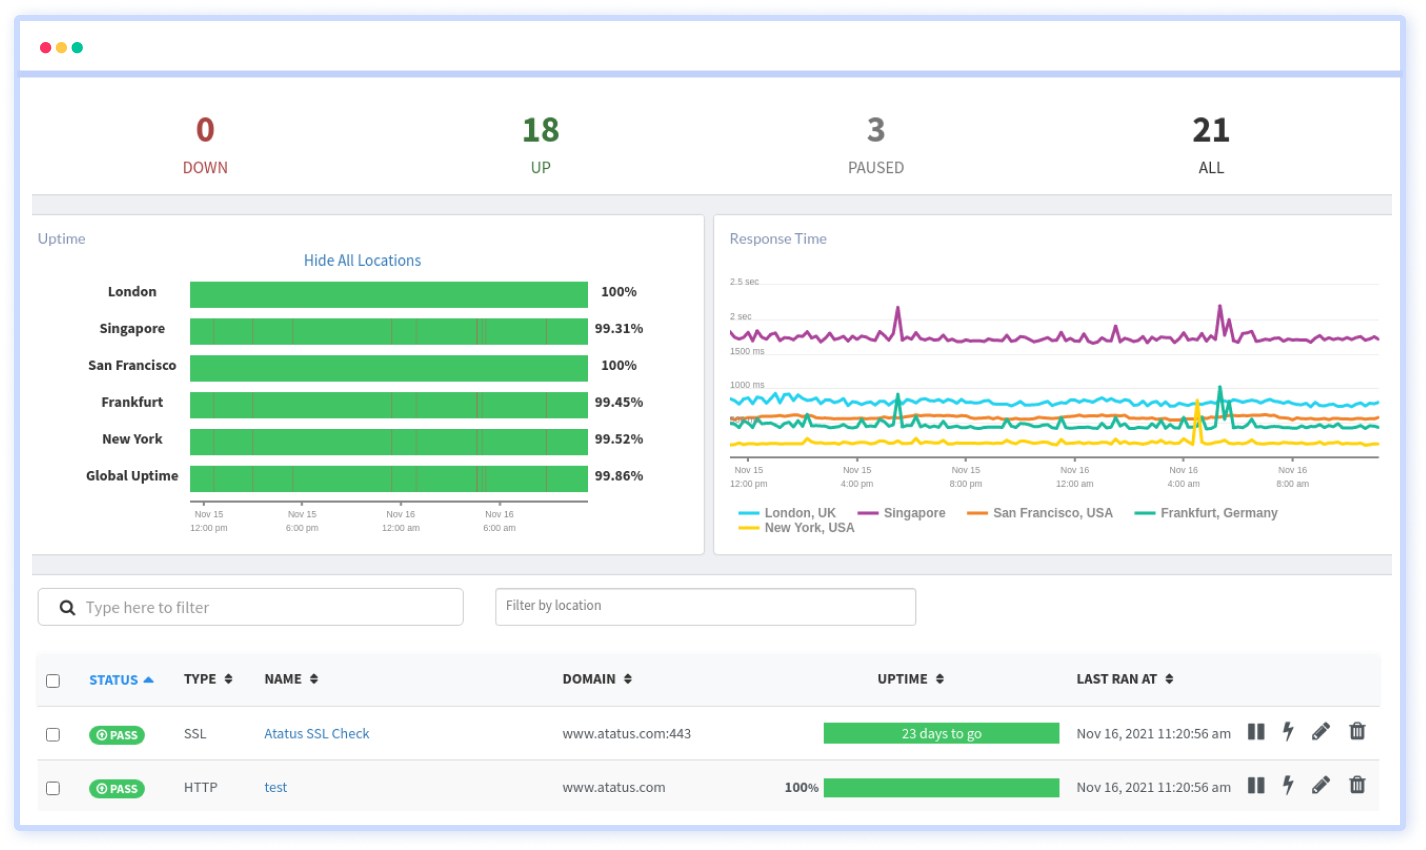
5. Synthetic Monitoring
Ensure 24/7 uptime and performance with our Synthetic Monitoring tool. Simulate user behaviors, run predictive scenarios, and preemptively identify potential issues. Stay one step ahead and guarantee consistent user experience under any circumstance.
Features:
- Constant pinging to detect network outages
- Keep track of the expiry date of your SSL
- Avoid malicious attacks, keep track of your DNS records
- Monitor the availability of HTTP, SSL, TCP and ICMP
- Provides a network of testing locations around the world
- Schedule synthetic tests to run at specific intervals, allowing them to monitor application performance regularly
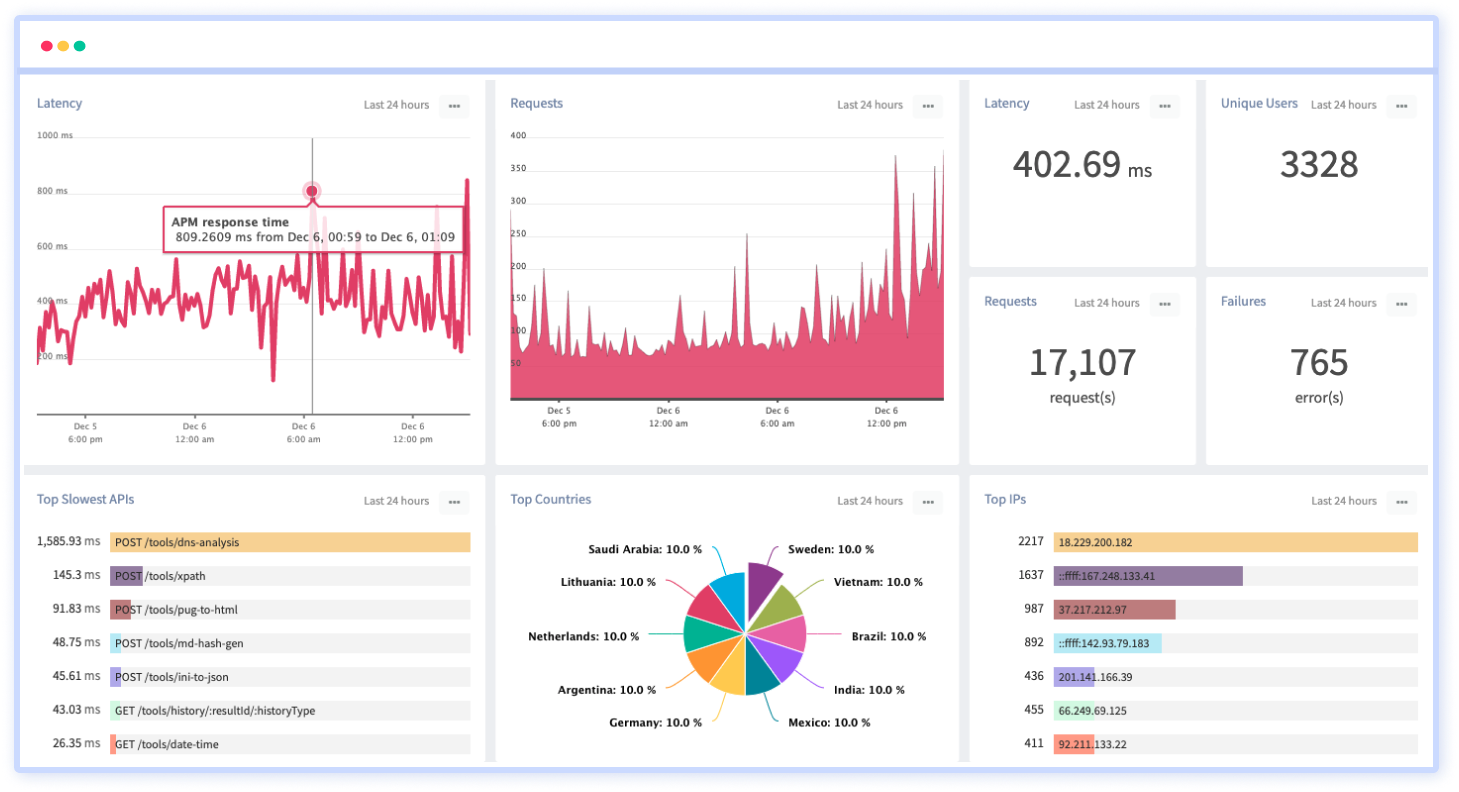
6. API Analytics
Unlock the full potential of your APIs with our dedicated analytics tool. Monitor API calls, response times, and failures. Optimize endpoints, ensure security, and deliver a seamless integration experience to developers and end-users alike. API Analytics is available as part of APM Package, however a dedicated API metric tracker is also serviced to give you better edge.
Features:
- Track API slowdowns and failures
- Real-time monitoring of API endpoints and traffic
- Insights into API usage patterns, including the number of requests, users, and endpoints
- Understanding how different users interact with your API
- Monitoring of user activity and behavior within the API
- Creation of custom dashboards to visualize specific metrics and KPIs
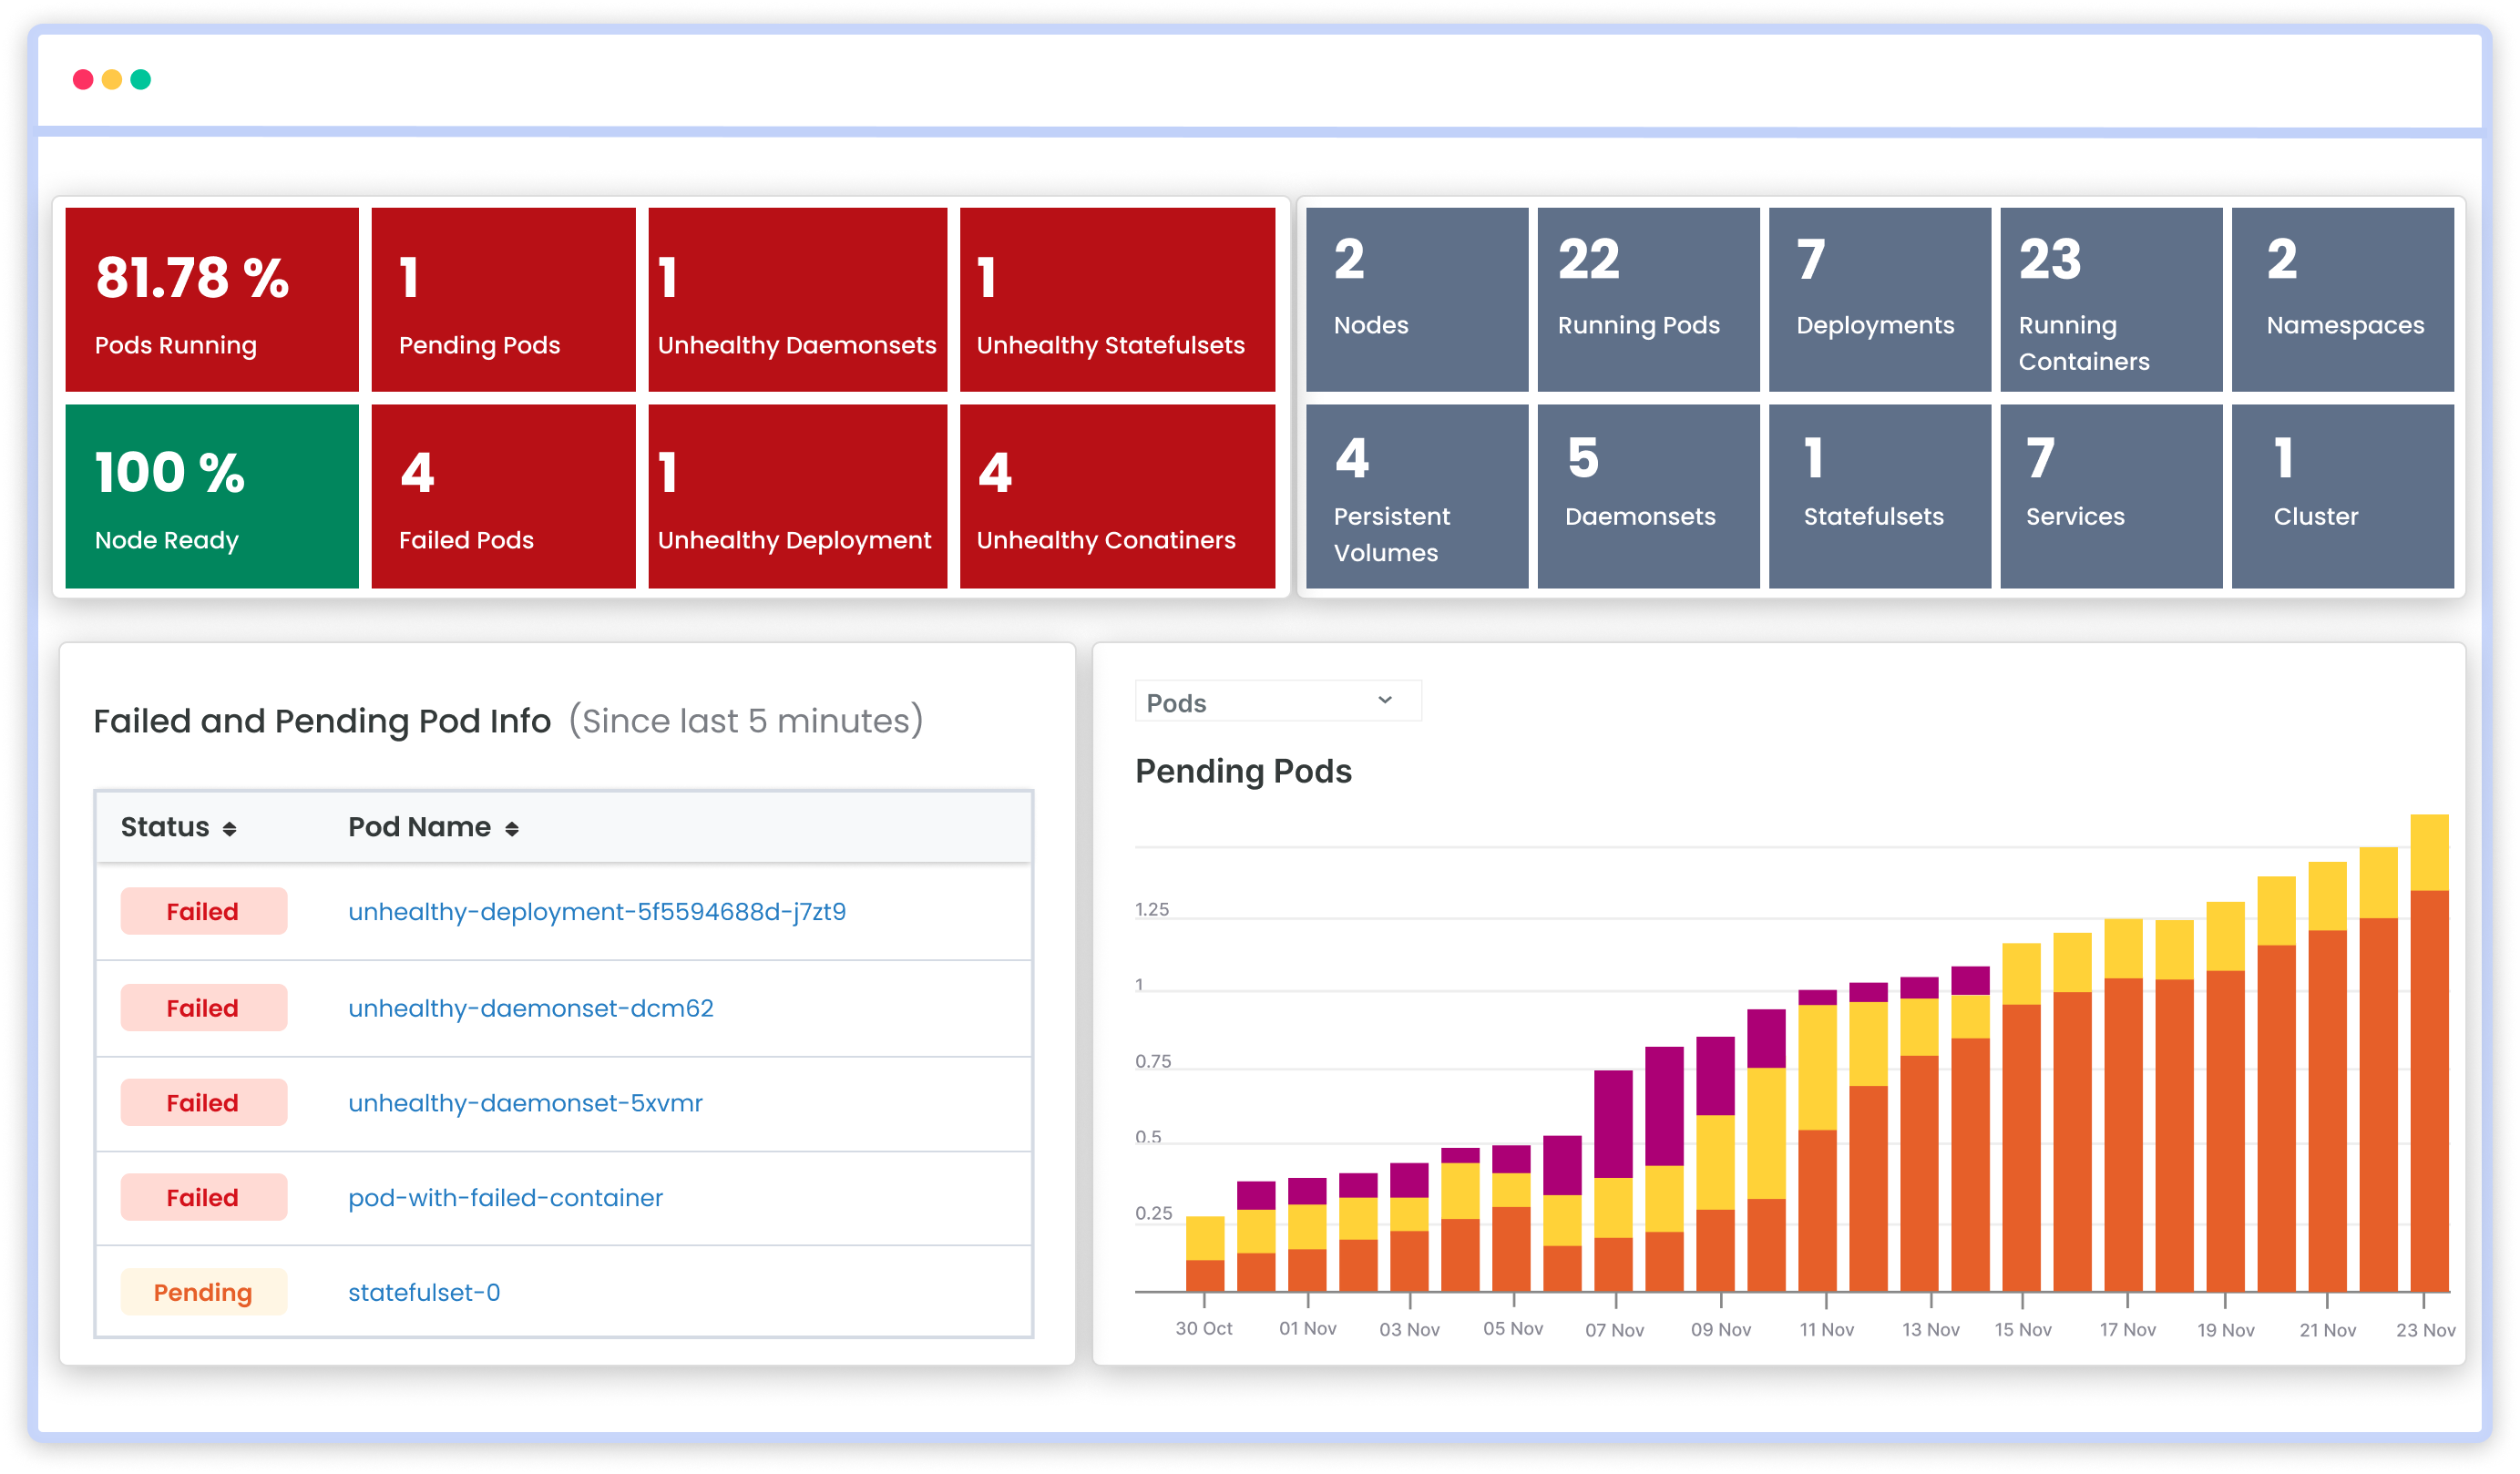
Kubernetes Monitoring
Atatus brings to you the all-in-one comprehensive Kubernetes monitoring tool for a microscale view of all the applications deployed on your Kubernetes cluster. Gain insights into resource allocation within each cluster and their utilization efficiency for improved performance and user experience.
Features:
- Node and Container-level CPU and Memory usage
- Pod and container health - pods running, status, pending, failed etc.
- Overall cluster CPU and Memory utilization
- Disk I/O metrics for persistent volumes
- Analyze log data from our integrated APP, database, and Network logs
- APM driven Kubernetes session traces
Conclusion
Observability empowers us to detect and respond to issues swiftly, optimize performance, and enhance user experiences. Whether through the lens of logs, metrics, traces, or a unified observability solution, the ability to gain deep insights into the inner workings of complex software systems is indispensable.
The choice between specialized tools or a unified approach hinges on the unique needs, resources, and objectives of each organization.
As technology continues to advance, the role of observability will only become more pronounced, guiding us toward a future where digital systems operate seamlessly, transparently, and with a newfound clarity that ensures their success and longevity.
#1 Solution for Logs, Traces & Metrics
![]() APM
APM
![]() Kubernetes
Kubernetes
![]() Logs
Logs
![]() Synthetics
Synthetics
![]() RUM
RUM
![]() Serverless
Serverless
![]() Security
Security
![]() More
More


![New Relic vs Splunk - In-depth Comparison [2026]](/blog/content/images/size/w960/2024/10/Datadog-vs-sentry--19-.png)