I write about application performance, monitoring, and DevOps, sharing insights and tips to help teams build faster, more reliable, and efficient software.
This page compares Datadog and New Relic by analyzing their features, performance, and pricing. Learn which tool is better suited for your specific needs with this guide.
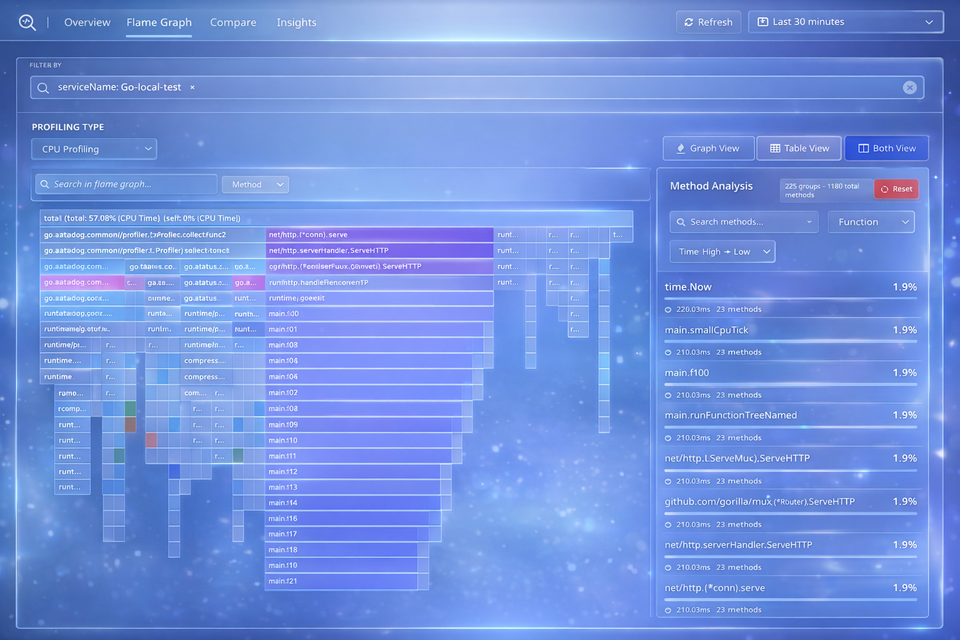
Continuous profiling lets developers track CPU, memory, and execution time in production. Learn how Atatus uncovers performance bottlenecks to optimize apps efficiently.
Teams are moving away from New Relic due to unpredictable pricing and mounting bills. Compare the top New Relic alternatives and choose a monitoring platform built for predictability and performance.
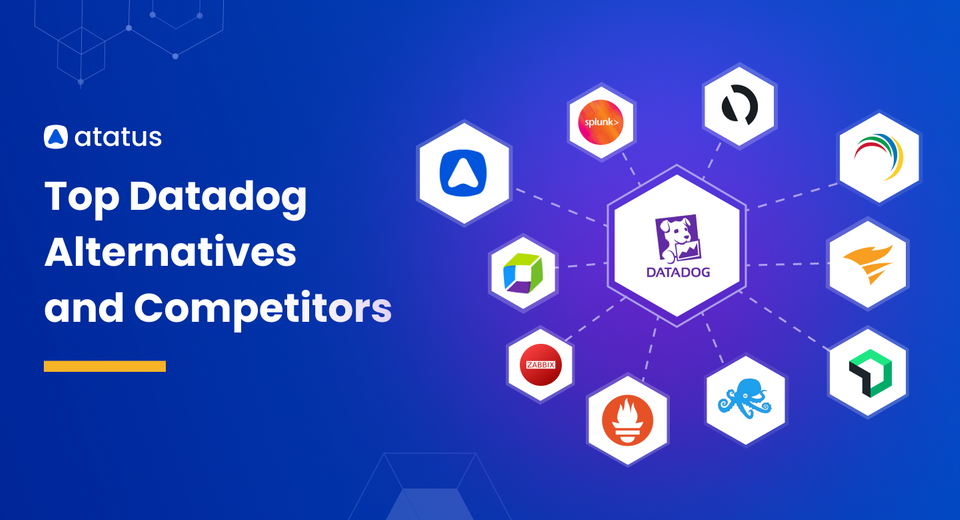
Datadog is a powerful monitoring tool; however, its pricing has been a concern for businesses. Take a look at the top alternatives to Datadog with this comparative guide.
Learn how to monitor, secure, and optimize your CI/CD pipeline with observability. Deliver faster, reliable software while detecting issues early with Atatus.
APM gives gaming experience the edge. Monitor latency, optimize gameplay, and prevent player churn with real-time insights that keep every session fast, stable, and smooth.
Discover the top 15 observability tools for 2026. Get in-depth insights, key features, and pricing and see how Atatus stands out with unified, next-gen observability built for scale.
Explore how fintech teams use APM to maintain flawless transaction flows, detect latency in real time, and deliver performance customers can depend on.
Monitor your entire software stack
Gain end-to-end visibility of every business transaction and see how each layer of your software stack affects your customer experience.