15 Best Observability Tools and Software to Use in 2025
A developer's viewpoint is distinct. It can be difficult to keep track of operations and detect the fault that is causing the software to malfunction when handling numerous sectors.
What if you could detect the issue ahead of time and fix it as soon as possible? The tactics that we concentrate on and put into action are those that assist us in properly managing our tasks.
Knowing about observability makes this possible. Let's take a closer look at it in this blog.
Table of Contents:
- What is observability?
- Observability Pillars
- Observability's Benefits
- Difference between observability and monitoring
- Best Observability Software and Tools
- WindUp
What is Observability?
Observability is a measure of how well you can deduce a system's internal states from its outputs. Its roots can be traced all the way back to control theory. Observability uses instrumentation to give monitoring insights.
When a system becomes observable, you monitor it. Without some measure of observability, monitoring is impossible.
Observable systems aid in understanding system behaviour, especially in complex microservice designs, allowing you to move more quickly from effects to causes. It allows you to find out what service made a request and where performance bottlenecks occurred.
Observability Pillars
The three major pillars of observability are as follows:
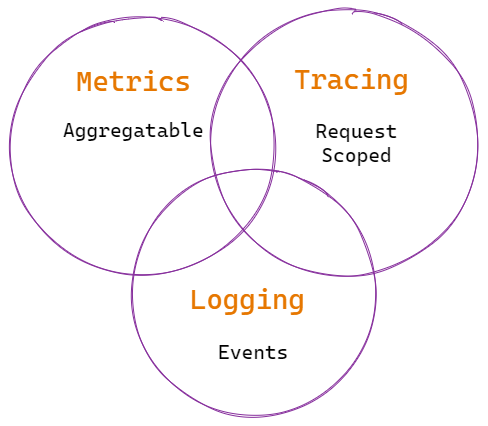
1.Logs:
Logs are permanent records of discrete events that can be used to spot unpredictably undesirable behaviour in a system and provide insight into what went wrong.
It is strongly recommended that logs be ingested in a structured format, such as JSON, so that log visualisation systems can auto-index and make logs easily queryable.
2.Metrics:
Metrics are numerical representations of data that have been gathered over a period of time. They serve as the foundation for monitoring, and they frequently retain information about how much time or memory each activity consumes.
However, they are not the same as event logs, which maintain track of specific events. They're interested in the system's overall performance in order to gain useful information.
3.Traces:
A single trace in a distributed system depicts an operation as it passes from one node to the next for a single transaction or request. Traces allow you to go into the details of single requests to figure out which components cause system failures, follow traffic between modules, and pinpoint performance bottlenecks.
Observability's Benefits
When done properly, observability offers a host of benefits to businesses.
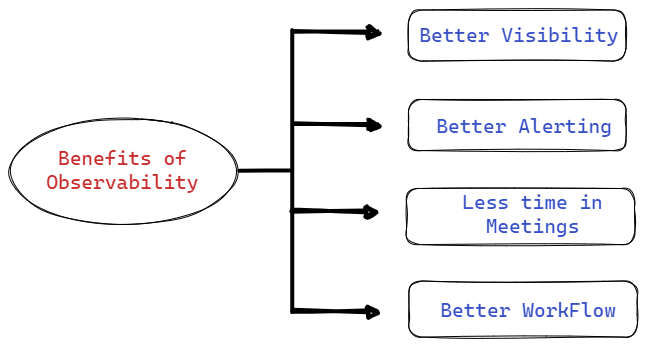
- Increased visibility:
It gives you real-time, end-to-end visibility into your system's performance. It also increases the monitoring's effectiveness.
- Workflow optimization:
DevOps operations can run more efficiently because there are fewer difficulties and outages. In less time, teams can do more.
- Correct perceptions:
As previously said, observability allows you to get a whole picture of your users. This enables you to create and implement customer-centric business strategies that enhance the overall user experience while also increasing consumer trust.
Difference between Monitoring and Observability
- It is something you do to keep an eye on things. You can be seen. In general, you need to know exactly what data to monitor when monitoring something.
- A good monitoring tool notifies you when something goes wrong based on what you're monitoring.
- We employ monitoring to keep track of performance, spot faults and abnormalities, pinpoint the source of issues, and obtain insight into physical and cloud settings.
- You must monitor in order to be visible. Monitoring can view the exterior world, logging can see the outputs through time, and by integrating the two, observability can be obtained by inferring the interior from the past.
Best Observability Software and Tools
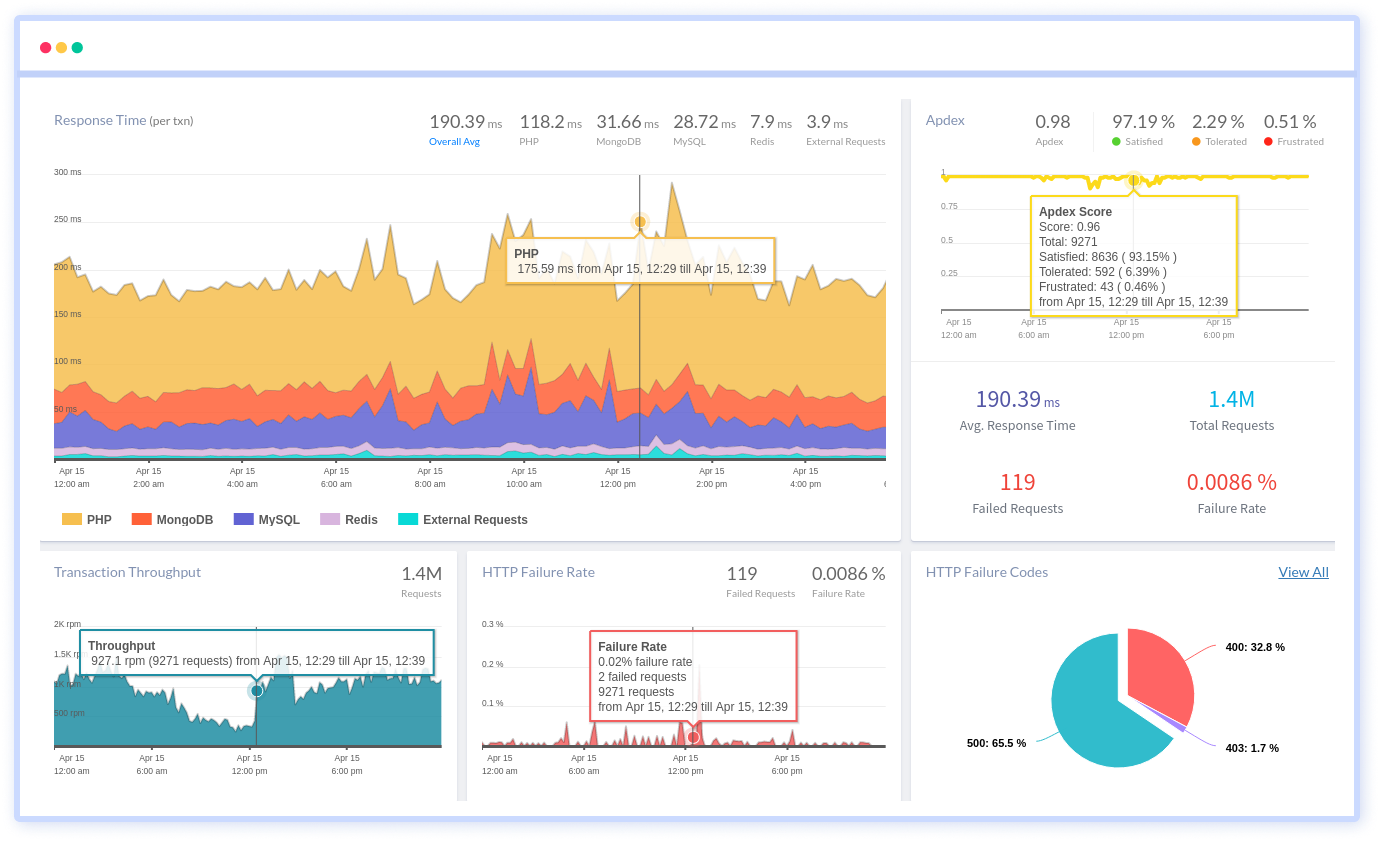
#1 Atatus
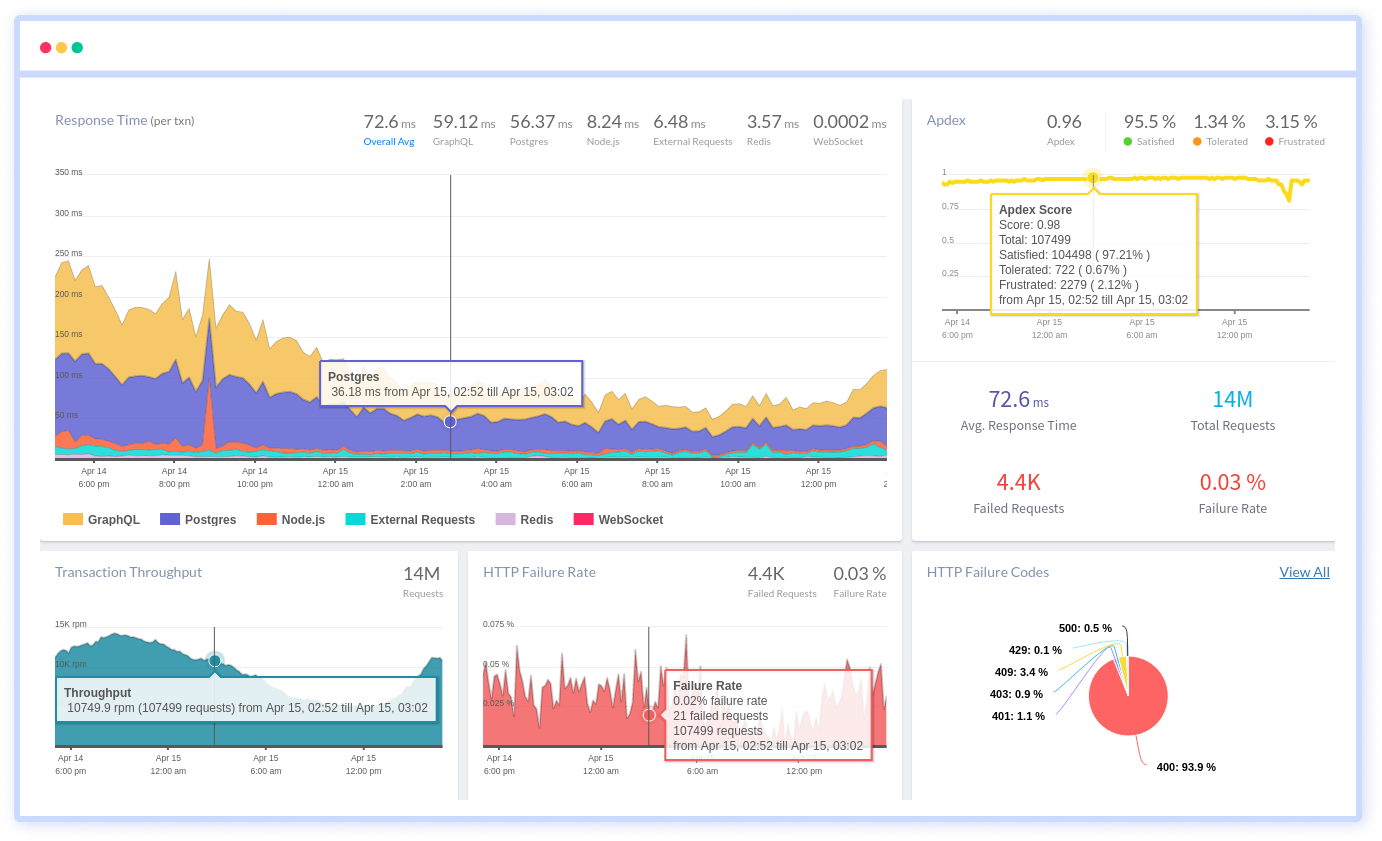
Atatus is an observability platform that improves front-end speed by leveraging real-time user monitoring. It's a full-stack SaaS application with a built-in error tracker. It's one of the top APM software alternatives, and it can be used in the cloud or on-premise.
It allows you to collect millions of performance data points across applications in real time, allowing you to quickly resolve issues and improve digital consumer experiences. Furthermore, due to the flexibility of cloud or on-premise deployment, such events occur in real time.
It provides a comprehensive view of all the application performance indicators you'll need to create high-quality, reliable software. As soon as a problem emerges, you will be contacted. It includes information such as who, when, and what caused the performance drop.
Pricing:
- APM starts from $0.07/month
- RUM starts from $1.96/month
- Infra starts from $0.01/month
- Logging starts from $2/month
#2 Dynatrace
Dynatrace is a comprehensive SaaS enterprise product that caters to a wide range of monitoring requirements for major businesses. It includes a Davis AI engine that automates tasks such as root cause investigation and anomaly detection.
Infrastructure monitoring, application security, and cloud automation are all handled differently by Dynatrace. The cost is determined by the product you choose.
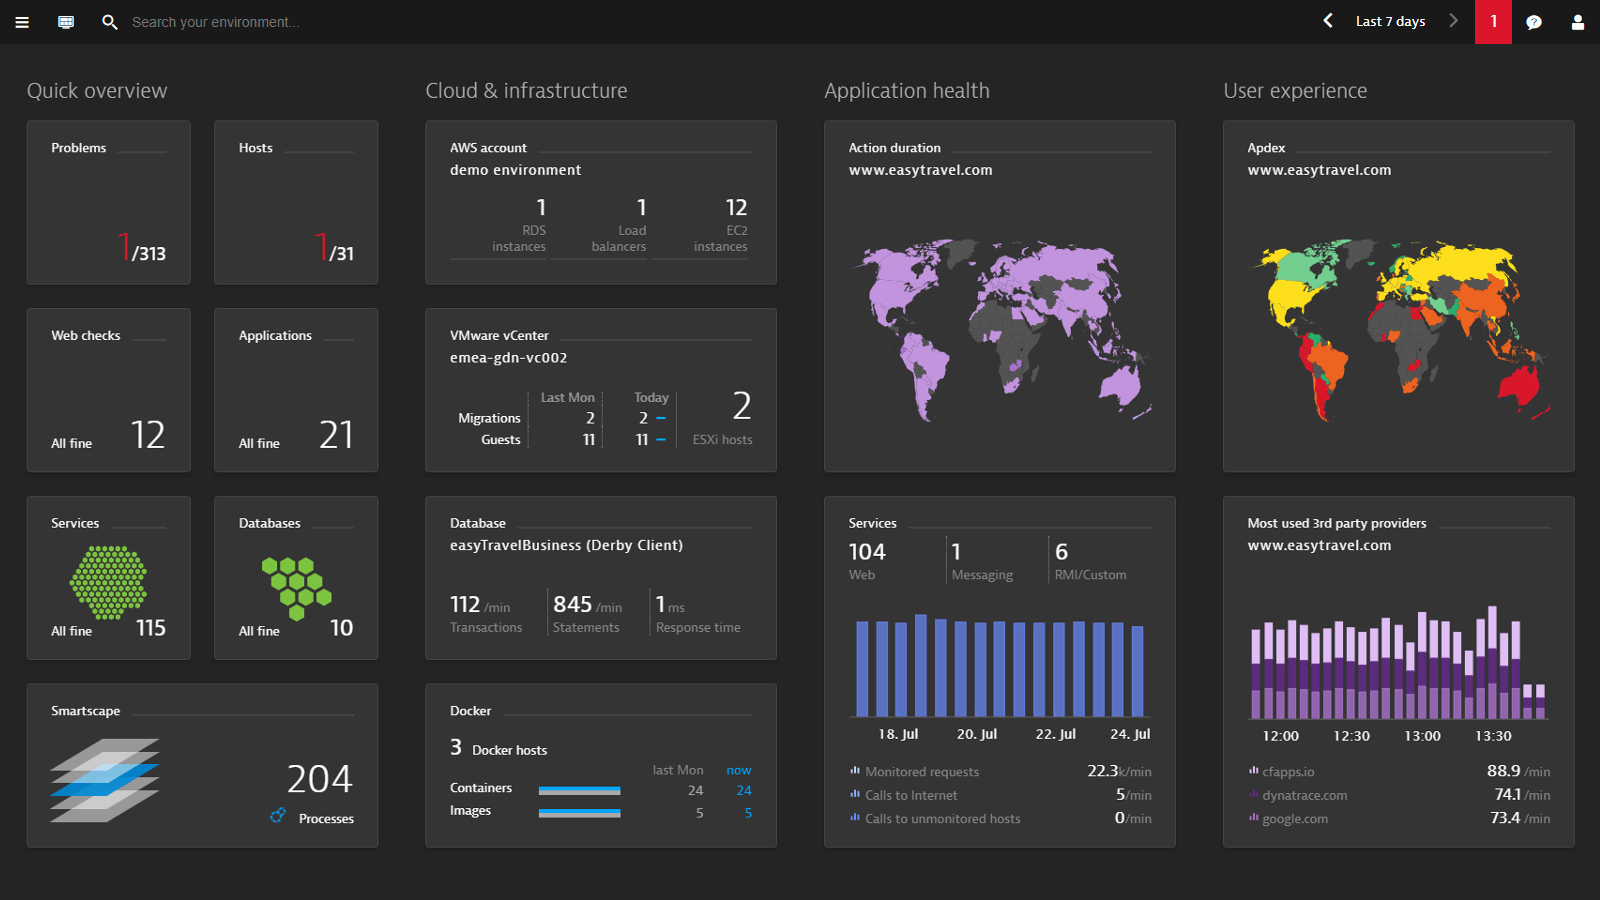
If invoiced annually, full-stack monitoring, a software designed to give app observability, costs $69 per month for 8 GB per host.
#3 Instana
Instana is a technology for enterprise observability and application monitoring. It discovers and monitors components with the help of an agent. Every host that will be watched will require the installation of this agent.
Sensors are used by the agents to collect data from various technologies. Sensors capture settings, updates, measurements, and events automatically.
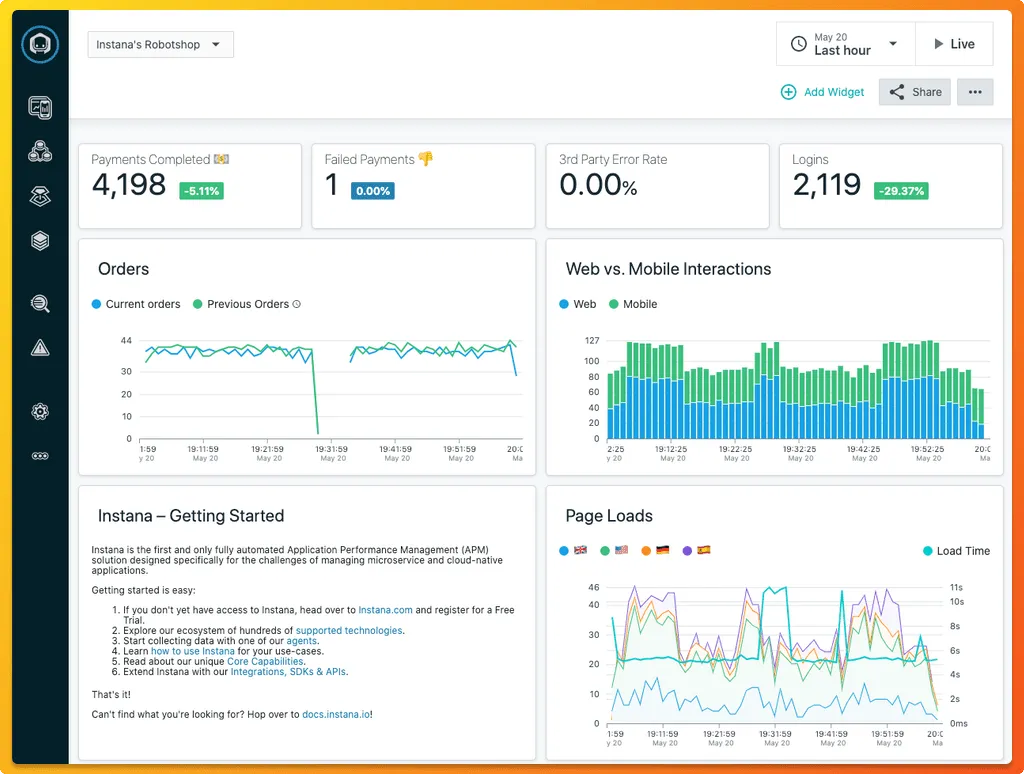
Pricing:
If paid annually, Instana charges $75 per host every month. Open standards such as Prometheus, StatsD, OpenTracing, and Opencensus are also supported.
#4 New Relic
New Relic is one of the most established observability companies. With its observability tool, you can visualise, analyse, and troubleshoot your software stack all in one place. Auto-instrumentation is now supported for eight prominent programming languages.
New Relic can connect the performance of your application to the health of your infrastructure, giving you better insights for faster troubleshooting.
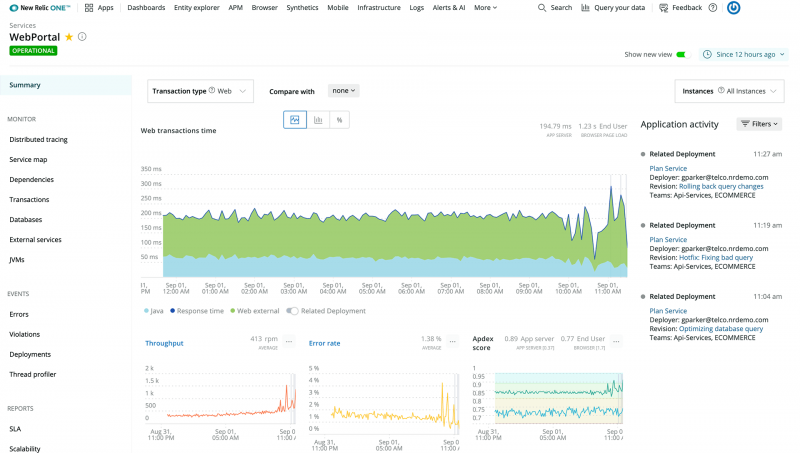
Pricing:
Plans for teams of up to 5 full users are included in the standard offering. Their cost is based on the amount of data consumed, with the first 100 GB of data being free and $0.25 per additional GB.
#5 DataDog
Infrastructure monitoring, log management, application performance monitoring, and security monitoring are all possible with the DataDog observability tool.
DataDog gives you complete visibility into distributed applications by allowing you to:
- Trace requests across distributed systems from beginning to end.
- Percentile charts of delay (p95, p99, etc.).
- Open-source libraries for instrumentation.
- Navigation between logs, metrics, and traces is seamless.
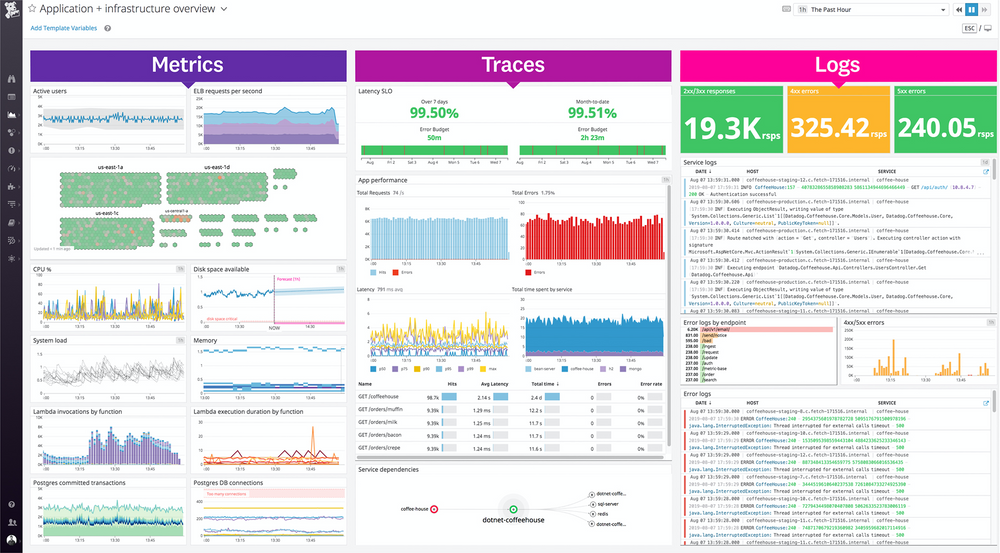
Pricing:
The cost is determined by the product you select. The APM solution, for example, provides end-to-end distributed tracing and costs $31 per host per month if paid annually.
#6 SolarWinds
Solarwinds has been at the vanguard of monitoring for years, and over that time, they've established a wide range of services to help their customers better understand what's going on behind the scenes, but that experience comes at a cost.
Web performance monitoring is just one part of their impressive software ecosystem, which has grown to become one of the world's most comprehensive DevOps systems.
Solarwinds does not offer an RUM solution, despite having features like endpoint detection and response, network device monitoring, and even a good mobile app for keeping an eye on your web application from anywhere on the planet.
Pricing:
A full suite of monitoring normally costs around $1,000, depending on the package type and necessity. There is also a 30-day trial available.
#7 Grafana Labs
Grafana is a popular open-source web layer for analytics and interactive visualisation. It has a variety of storage backends for time-series data. It may connect to a variety of data sources, including Graphite, InfluxDB, ElasticSearch, Prometheus, and others. It works with Jaeger, Tempo, X-Ray, and Zipkin data sources for traces.
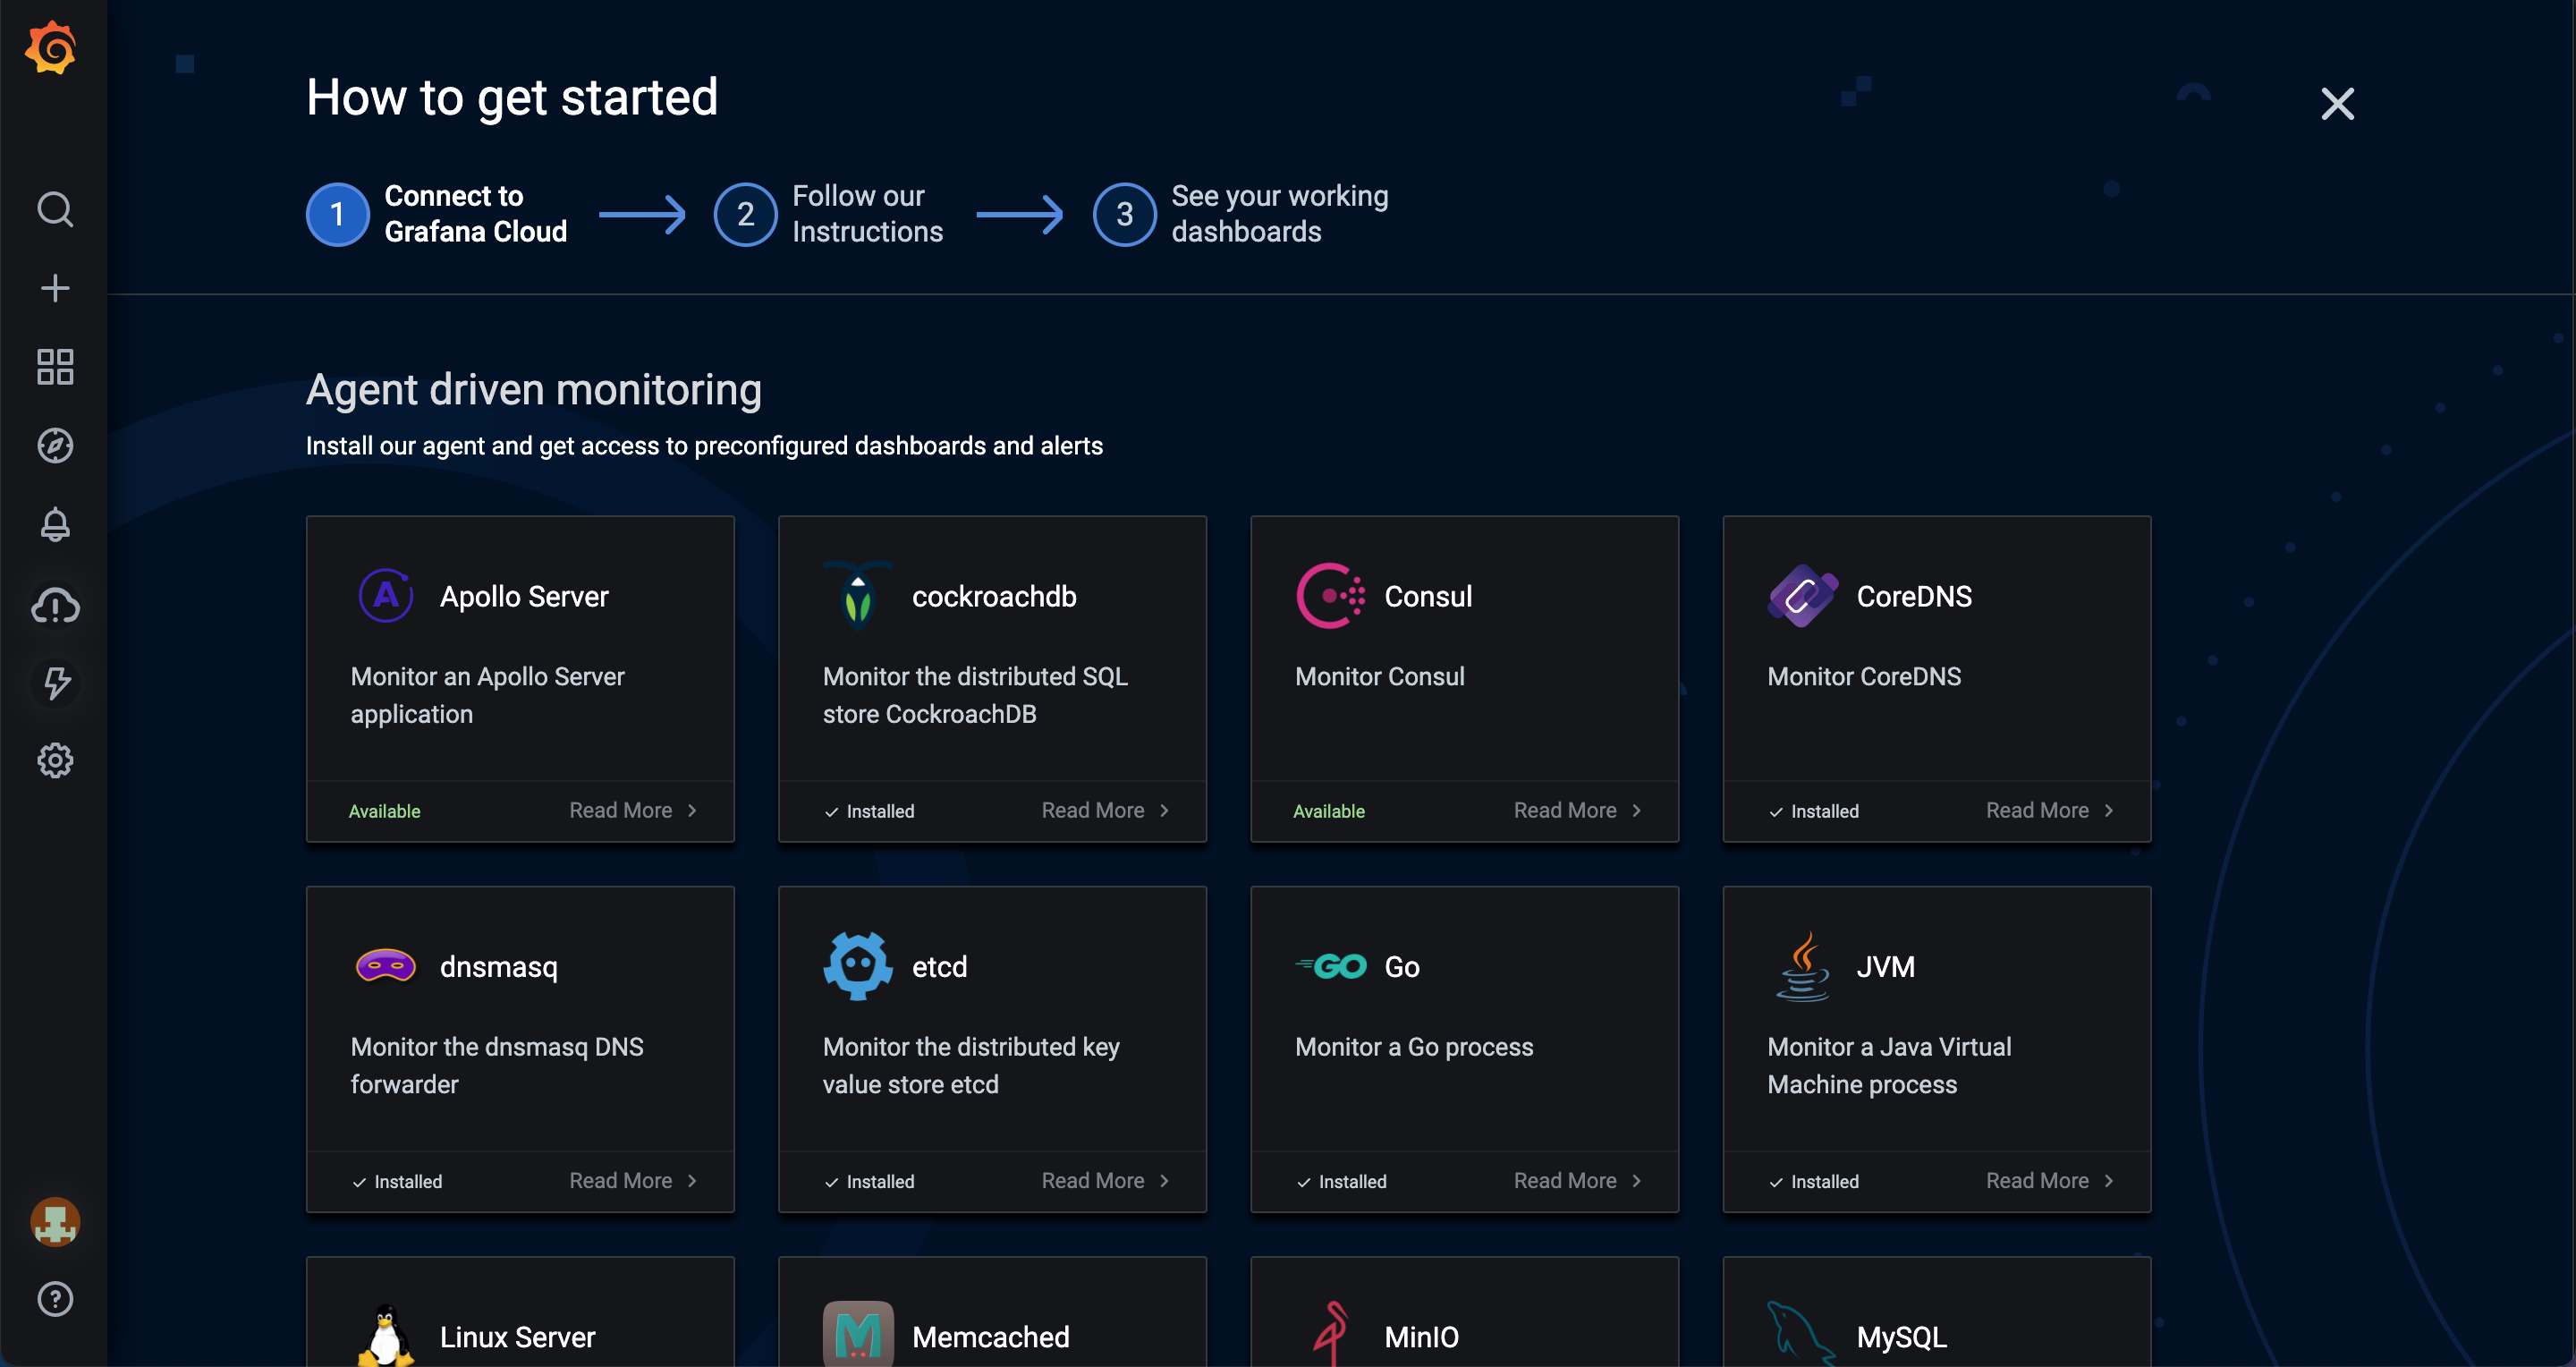
As an observability solution, Grafana provides plugins, dashboards, alarms, and varied user-level access for governance.
WindUp
The application of observability varies by field of expertise. When used in your workflow, logs, metrics, and traces form a unique mix.
Every piece of software or application is designed to help you perform better at work. This is what observability accomplishes. Implementing observability is one tool for integrating your work.
It may appear complicated, but the components are essential for infrastructure maintenance. All efforts in this vein are unacceptably ineffective. However, using a technology to observe the actions is more superior.
Atatus is a simple and affordable observability platform:
Atatus observability tool provides the finest user experience when it comes to putting real-time monitoring instruments in place. It is an observability platform that lets you analyse problems as if they happened in your app.
It provides a suite of real-time performance measurement tools for monitoring and improving the performance of your website's frontend and backend. Our software can collect millions of performance data points from your websites, allowing you to quickly identify problems and provide excellent digital customer service.
We offer Application Performance Monitoring, Real User Monitoring, Serverless Monitoring, Logs Monitoring, Synthetic Monitoring, Uptime Monitoring, and API Analytics. It works perfectly with any application, regardless of framework, and has plugins.
#1 Solution for Logs, Traces & Metrics
![]() APM
APM
![]() Kubernetes
Kubernetes
![]() Logs
Logs
![]() Synthetics
Synthetics
![]() RUM
RUM
![]() Serverless
Serverless
![]() Security
Security
![]() More
More

![New Relic vs Splunk - In-depth Comparison [2025]](/blog/content/images/size/w960/2024/10/Datadog-vs-sentry--19-.png)
![New Relic vs Sentry - Which Monitoring Tool to Choose? [2025]](/blog/content/images/size/w960/2024/10/VS--1-.png)
![Splunk vs Prometheus: A Side-by-Side Comparison [2025 Guide]](/blog/content/images/size/w960/2024/08/Datadog-vs-sentry--13-.png)