When your enterprise PHP app slows down, your teams scramble and your users notice. Atatus provides you the visibility and tools to keep it fast, reliable, and ready to scale.
Discover why PHP application monitoring is crucial for performance, stability, and user experience across industries like e-commerce, education, and more
Uncover how PHP memory leaks degrade app performance and learn how APM tools help pinpoint, analyze, and resolve these issues to keep your applications running smoothly.
In Java, memory leaks are a real issue. We'll look at what causes memory leaks, how to spot them at runtime, and how to deal with them in our application.
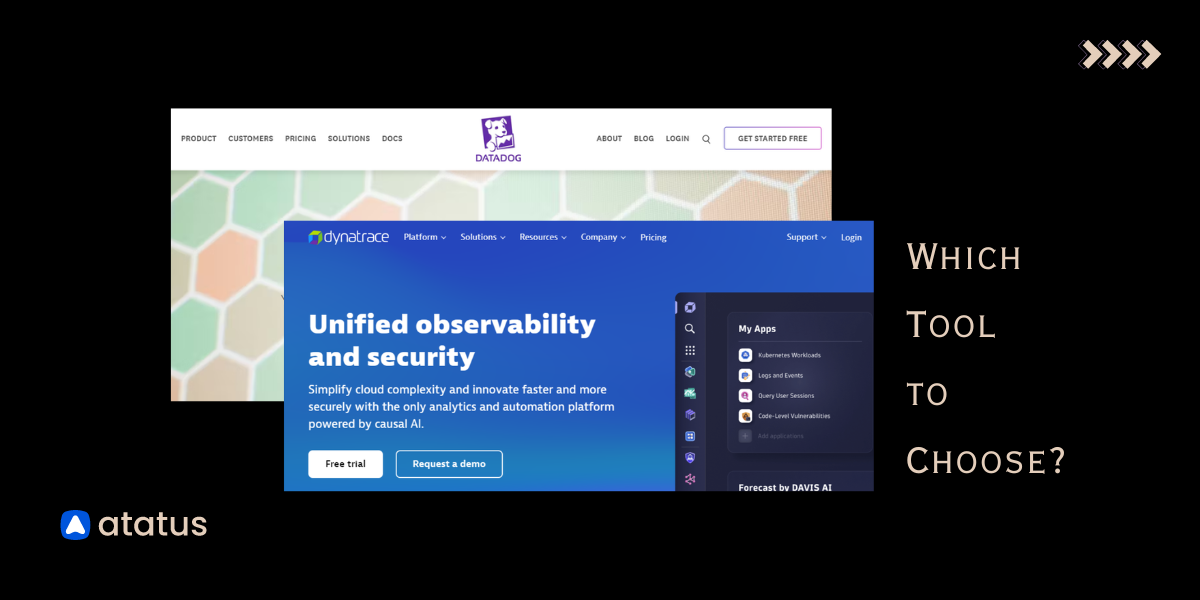
Explore Datadog vs Dynatrace comparison, covering agent installation, key features, ease of use, pricing, and more. Find out which tool suits your need
Struggling to choose between Logstash and Filebeat? Here, we compare both technologies and outline their key features so you can make an informed decision.
One Java application can generate up to hundreds of metrics. There are a few crucial indicators for monitoring that you should pay attention to thread counts, garbage collection, and memory usage. These metrics are accessible via JMX.
Struggling with Java application performance? Learn how developers, DevOps, and SREs can effectively monitor and optimize Java systems with key strategies, tools, and metrics.
Monitor your entire software stack
Gain end-to-end visibility of every business transaction and see how each layer of your software stack affects your customer experience.
![What is Java Performance Monitoring? [A 2026 Guide to DevOps Engineers]](/blog/content/images/size/w960/2025/07/What-is-Java-Application-Performance-Monitoring.png)