Detect all performance inhibitors, including Pod failures, and excess CPU usage, bogging down your Kubernetes Architecture. Learn how to monitor Kubernetes with Opentelemetry.
Tomcat is a server that runs in a Java Virtual Machine (JVM) and is one of the most popular server implementations for Java web applications. JMX beans or a monitoring tool like MoSKito or JavaMelody can be used in Tomcat performance monitoring.
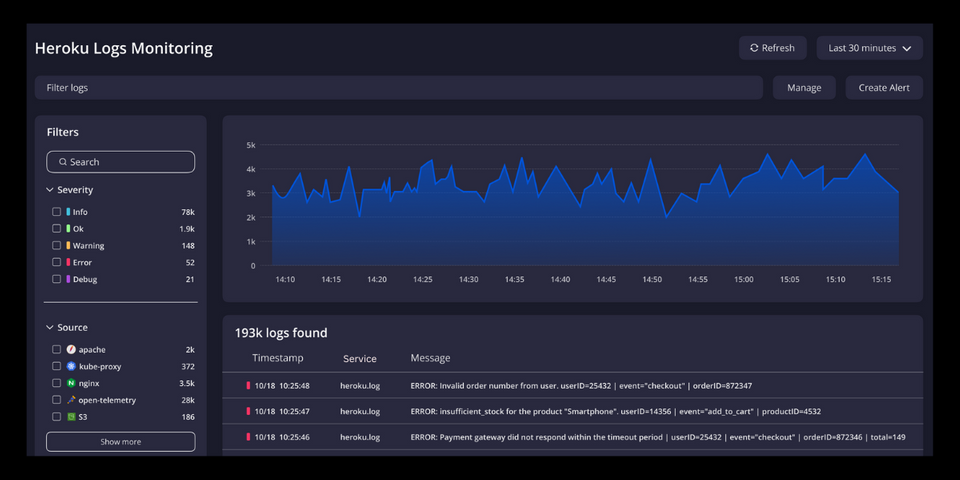
Learn how to effectively monitor Heroku logs to identify errors, optimize performance, and ensure application reliability. Discover best practices, tools, and step-by-step instructions for setting up real-time log monitoring and alerts.
Explore Prometheus histogram buckets, how they work, how to set them up, and their real-world applications. Learn how to configure, monitor, and analyse performance metrics with buckets in this technical guide for DevOps and monitoring.
You will find plenty of articles about error handling in Node.js. In this article, I have shared the best practices to handle your errors in your application. Handle your error easily and in a faster manner to get rid of the issues that arises in your application.
Learn how to detect, optimize, and manage long-running queries in MySQL. This guide covers tools like slow query logs, performance schema, query optimization techniques, and preventive measures to ensure your database runs efficiently.
Discover the exciting new features of PHP 8.4, including readonly classes, the 'json_validate()' function, dynamic callables, and enhanced enums. Learn how these improvements boost performance, improve developer productivity, and enhance security in your PHP applications.
Monitor your entire software stack
Gain end-to-end visibility of every business transaction and see how each layer of your software stack affects your customer experience.