A Complete Guide to Tomcat Performance Monitoring
Metrics and runtime characteristics for application server monitoring are critical for the applications running on each server. Monitoring also helps to prevent or manage possible problems promptly. Apache Tomcat is one of the most widely used servers for Java applications. JMX beans or a monitoring tool like MoSKito or JavaMelody can be used in Tomcat performance monitoring.
In the world of Java-based web applications, Apache Tomcat is one of the most extensively used servers. Apache Tomcat is an open-source server that is frequently used for enterprise web applications. Using Apache Tomcat, like other virtual machine technology, comes with the duty of properly monitoring it. In this Tomcat performance monitoring guide, we'll look at how to monitor Tomcat and some of the tools you can use to do so.
Here's how it is done:
- What is Apache Tomcat?
- Tomcat Server Architecture
- How do We Monitor Tomcat?
- Performance Metrics to Monitor with Tomcat
- Example Application to Monitor
- Tomcat Performance Manager
- Using JavaMelody to Enable Tomcat Performance Monitoring
- Key Performance Metrics for Tomcat
- Tools for Tomcat Performance Monitoring
What is Apache Tomcat?
The Apache Software Foundation created Apache Tomcat, a server for Java-based web applications. Sun Microsystems generated the Tomcat project's source code, which was contributed to the foundation in 1999. Tomcat is a server that runs in a Java Virtual Machine (JVM) and is one of the most popular server implementations for Java web applications.
It can be set to run as a basic web server or with the Apache HTTP server, though it is typically used as an application server. Tomcat is a Java Servlet Container that implements the Java Enterprise Edition (EE) Servlet specification and provides the runtime environment for Java applications. Through the servlet API, Tomcat can serve dynamic content such as Java Server Pages (JSP) and Java servlets.
Since it is a servlet container and does not require the whole Java EE platform for serving applications, Apache Tomcat is a popular choice for smaller applications. It has a reduced memory footprint and is easier to administer. Tomcat project is open source and has a huge, active community, you can quickly adjust server settings as needed.
Tomcat Server Architecture
To under how does Tomcat works, you need to learn its architecture. Let's have a look at the Tomcat architecture to see what areas we should focus on to get the best performance from a Tomcat server.
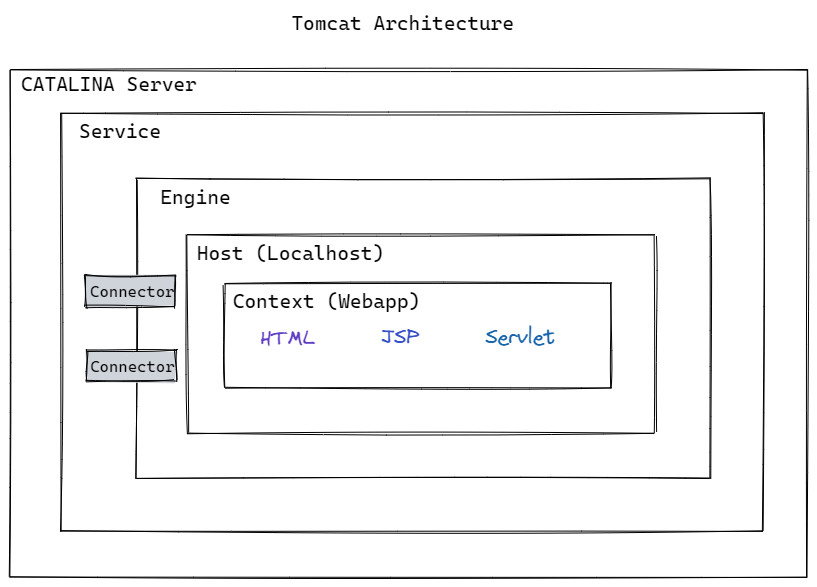
The following are the essential elements:
- Connectors
Connectors allow the Catalina engine to receive requests, transport them to the relevant web application, and return the results as dynamically produced content through Tomcat's connections to the outside world. - Engine
The Engine represents a service's request processing pipeline. The engine handles all requests received by the Connectors. While static pages are provided immediately from the server's cache, dynamic pages require the Tomcat engine to parse servlets and JSPs. - Context
A web application is represented by Context. Various web applications and multiple contexts can exist in a single Tomcat instance. - Connection Pooling
The Tomcat server's connection pooling feature enables applications to connect to a backend database and run queries. By implementing connection pooling instead of opening individual connections for each request, applications can reduce the number of connections that open and shut to the database server, lowering database server load and improving application response times to users. - Java virtual machine (JVM)
Tomcat server is based on the Java virtual machine (JVM), which handles memory management, threading, garbage collection, and other tasks.
How do We Monitor Tomcat?
While small-scale network managers may be able to get by with command-line scripts, ad-hoc monitoring isn't the most efficient approach to manage your resources. You'll need to use an external monitoring tool for more exact monitoring.
Java Management Extensions (JMX beans) or a whole application performance monitoring solution are both options. But first, let's take a look at what you should be keeping an eye on.

Performance Metrics to Monitor with Tomcat
Tomcat is a stand-alone server. To identify performance concerns and maintain long-term performance, you must track a variety of measures. These are the following:
- Memory
The amount of memory available on the server should be one of the first things you check. A JVM with insufficient memory will operate poorly. - Uptime
It's critical to know whether your server is up or down to keep your service running. If your monitoring tool indicates that the service is down, you can begin troubleshooting to determine why. - Response Time
User queries should be responded to as quickly as possible by the server. If your response time is too long, you risk losing customers. - Error Rates
If you keep track of your error rate, you'll be able to see if your codebase has any issues. Error rates can be monitored to help you improve your service. - Request Throughput
The number of active threads can be determined by monitoring request flow. The application may perform poorly if there are too many threads active. - Number of Sessions
The number of concurrent sessions the server can support is determined by counting the number of sessions. - Garbage Collection
Garbage collection must be performed regularly, with the required amount of RAM deleted once the collection is finished.
Tomcat servers help performance monitoring by supplying JMX beans for the majority of these metrics, which can be checked using tools like Tomcat Manager or JavaMelody.
Example Application to Monitor
For this example, we'll utilize a simple web service application created with Maven and Jersey that uses an H2 database.
A simple User entity will be manipulated by the application:
public class User {
    private String name;
    private String email;
}
The defined REST web service includes two endpoints that save a new User to the database and output a JSON list of Users:
@Path("/users")
public class UserService {
    private UserDAO userDao = new UserDAO();
    public UserService() {
        userDao.createTable();
    }

    @POST
    @Consumes(MediaType.APPLICATION_JSON)
    public Response addUser(User user) {
        userDao.add(user);
        return Response.ok().build();
    }

    @GET
    @Produces(MediaType.APPLICATION_JSON)
    public List<User> getUsers() {
        return userDao.findAll();
    }
}
Tomcat Performance Manager
The Manager App that comes with Tomcat is one way to get the values of the MBeans. Since this application is password-protected, you must first create a user and password by editing the conf/tomcat-users.xml file as follows:
<role rolename="manager-gui"/>
<role rolename="manager-jmx"/>
<user username="tomcat" password="53cr3t" roles="manager-gui, manager-jmx"/>
The Manager App interface, which can be found at http://localhost:8080/manager/html, provides basic information on the server's status and deployed applications. The Manager App also can deploy new applications.
One noteworthy feature of the Manager App for performance monitoring is the ability to check for memory leaks.
The "Find Leaks" feature will scan all deployed applications for memory leaks.
http://localhost:8080/manager/jmxproxy provides information on JMX beans. Since the data is meant for tool processing, it is in text format.
To get information about a specific bean, you can include parameters in the URL that describe the bean's name and the attribute you're looking for:
http: //localhost:8080/manager/jmxproxy/?get=java.lang:type=Memory&att=HeapMemoryUsageOverall, this tool is handy for a quick check, but it is limited and unreliable, thus it should not be used in production.
Next, we'll look at a tool with a more user-friendly UI.
Using JavaMelody to Enable Tomcat Performance Monitoring
Simply add the javamelody-core dependency to your pom.xml if you're using Maven:
<dependency>
	<groupId>net.bull.javamelody</groupId>
	<artifactId>javamelody-core</artifactId>
	<version>1.69.0</version>
</dependency>
You can enable monitoring of your web application this way.
The monitoring panels can be accessed via the /monitoring URL after the application has been deployed on Tomcat.
JavaMelody has graphs for presenting data related to various performance metrics, as well as a method for locating the values of Tomcat JMX beans.
The majority of these beans are JVM-specific rather than app-specific.
Let's look over each of the key indicators, see what MBeans are accessible, and how to track them in alternative ways.
Key Performance Metrics for Tomcat
#1 Memory Usage
Monitoring the amount of memory used and available is useful for both ensuring the server's correct operation and obtaining statistics. The JVM will throw an error if the system can no longer create new objects owing to a lack of memory.
A memory leak is indicated by a consistent increase in memory utilization without a corresponding increase in activity level.
In general, determining a minimum absolute value for accessible memory is challenging. Instead, you should base it on observing the trends of a specific application. Of course, the maximum value should not exceed the amount of physical RAM available.
The following options can be used to set the minimum and maximum heap sizes in Tomcat:
set CATALINA_OPTS=%CATALINA_OPTS% -Xms1024m -Xmx1024mTo reduce trash collections, Oracle advises setting the two arguments to the same value.
1. HeapMemoryUsage
For committed, init, max, and used memory, use the HeapMemoryUsage attribute:
- Max – The entire amount of RAM you give the JVM to manage memory.
- Committed – The amount of RAM that the JVM is guaranteed to have. This quantity varies depending on memory use and rises to the JVM's maximum value.
- Used – The amount of memory that the JVM is presently using (e.g., applications, garbage collection).
- Init – The amount of RAM that the JVM requests from the OS when it starts up.
The utilized and committed values are very useful to keep an eye on because they show how much memory is currently in use as well as how much memory is available on the JVM. You can compare these values to the JVM's maximum memory setting. The amount of committed memory will rise as the JVM utilizes more memory, up to the maximum value.
2. CollectionCount
Garbage collection reclaims the memory that has been utilized, but it also consumes a lot of memory when it is called. Metrics for monitoring garbage collections are included in JMX, which can help in locating the source of memory leaks.
The CollectionCount metric on the JMX MBean server displays the number of collections that have occurred since the service started. Under normal conditions, this amount will gradually rise, but you can utilize a JMX monitoring tool to determine how many collections occur over a given time.
#2 Garbage Collection
Garbage collection is the process of releasing unnecessary things to free up memory. The JVM will generate an OutOfMemoryError with the message "GC overhead limit exceeded" if the system spends more than 98% of CPU time on garbage collection and recovers less than 2% of the heap.
A memory leak is frequently indicated by such an error message, so keep an eye out for values approaching these limitations and look into the code.
Examine the java.lang:type=GarbageCollector MBean, specifically the LastGcInfo attribute, which displays information on the memory status, duration, and thread count of the GC's most recent execution.
The "Execute the garbage collection" link in JavaMelody can be used to start a full garbage collection cycle.
#3 Thread Usage
Tomcat provides the ThreadPool MBean to determine the status of in-use threads. The currentThreadsBusy, currentThreadCount, and maxThreads properties show the number of threads that are now busy, in the thread pool, and the maximum number of threads that can be generated.
Tomcat uses a maxThreads value of 200 by default.
If you anticipate a higher number of concurrent requests, you can simply adjust the count in the conf/server.xml file:
<Connector port="8080" protocol="HTTP/1.1"
           connectionTimeout="20000"
           redirectPort="8443"
           maxThreads="400" />
You can also change the value if the system performs poorly with a high thread count. What matters is that you run a battery of performance tests to load the system and evaluate how the application and server manage it.
#4 Request Throughput and Response Time
You can utilize the MBean Catalina:type=GlobalRequestProcessor, which has properties like requestCount and errorCount that represent the total number of requests done and errors detected, to determine the number of requests in a certain period.
The maxTime attribute indicates the longest time it takes to process a request, whereas processingTime indicates the overall time it takes to process all requests.
The drawback of accessing this MBean directly is that it contains all of the server's requests. You can use the JavaMelody interface's "HTTP hits per minute" graph to isolate HTTP queries.
JavaMelody provides a high-level overview of all requests as well as the average response time. However, if you want more specific information on each request, you can use a tool to track the application's performance for every web request.
#4 Database Connections
Since connecting to a database is a time-consuming procedure, it's critical to employ a connection pool.
By adding a Resource element to the conf/context.xml file, Tomcat can setup a JNDI data source that supports connection pooling:
<Resource
name="jdbc/MyDataSource"
auth="Container"
type="javax.sql.DataSource"
maxActive="100"
maxIdle="30"
maxWait="10000"
driverClassName="org.h2.Driver"
url="jdbc:h2:mem:myDb;DB_CLOSE_DELAY=-1"
username="joe"
password="1tafu5@"
/>
The MBean Catalina:type=DataSource can then display information about the JNDI data source, such as the number of active and idle connections (numActive and numIdle).
The JNDI data source must be named MyDataSource for the database connections to be presented in the JavaMelody interface. After that, graphs such as "SQL hits per minute", "SQL mean times", and "percentage of sql errors" can be consulted.
Prefix for each HTTP request can provide extra information on each SQL operation issued to the database. A database icon indicates that a database connection is required.
#4 Error Rate
Errors indicate a problem with the Tomcat server, a host, a deployed application, or a servlet in an application. This covers failures caused by the Tomcat server running out of memory, being unable to locate a requested file or servlet, or being unable to serve a JSP due to servlet codebase syntax errors.
While the errorCount metric by itself does not provide any information on the types of problems Tomcat generates, it can provide a high-level view of potential issues that should be investigated. To gain a clearer view of the types of issues your users are encountering, you'll need to complement this measure with other information from your access logs.
1. OutOfMemoryError
While there are a variety of OOME exceptions, the most common is java.lang.OutOfMemoryError: Java heap space, which occurs when an application is unable to add any more data to memory (heap space area). These errors will be recorded in Tomcat's Catalina server logs.
org.apache.catalina.core.StandardWrapperValve invoke
SEVERE: Servlet.service() for servlet[jsp] in context with path[/sample] threw exception [javax.servlet.ServletException: java.lang.OutOfMemoryError: Java heap space] with root cause
        java.lang.OutOfMemoryError: Java heap space
If you get this error, you'll have to restart your server to get back on track. If the issue continues, the JVM's heap space may need to be increased. Monitoring and alerting on the HeapMemoryUsage metric can also help you in taking the necessary steps to reduce the frequency with which the server generates these errors.
2. Server-side Errors
Without checking your error logs, it's tough to figure out what's causing a significant decline in request counts and processing time. When throughput measures are correlated with error rates, a starting point for investigating key issues can be identified.
Set up alerts to be notified if your server-side error rate increases, so you can promptly resolve issues with Tomcat or your deployed application. You may also lookup more information about each request that failed in Tomcat's access logs, such as the HTTP status code, processing time, and request method:
192.168 .33 .1 - -[01 / Mar / 2022: 20: 54: 40 + 0000]
"GET /examples/jsp/error/err.jsp?name=infiniti&submit=Submit HTTP/1.1"
500 123 53
Tools for Tomcat Performance Monitoring
An application monitoring solution is better if you wish to monitor a variety of metrics at the same time. One of the benefits of taking this path is that you have a wide choice of provider options to pick from.
We'll look at some of the best tools for monitoring Apache Tomcat:
- Atatus
Atatus records all requests made to your Tomcat applications without forcing you to make any changes to your source code. You can see how all of your methods, database statements, and external requests are affecting the user experience. To make bug repair easier, every Tomcat error is monitored using error tracking and captured with a full stacktrace with the specific line of source code underlined. - SolarWinds
SolarWinds Server & Application Monitor is suitable for monitoring Tomcat because it comes with a set of monitor templates tailored to the server right out of the box. Free Memory, Total Memory, Max Memory, Total Processing Time, Request Count, Bytes Sent, Bytes Received, and Errors Count may all be monitored with this tool. - ManageEngine
ManageEngine Applications Manager application monitor can keep an eye on Tomcat servers. The platform can track CPU utilization, memory usage, JVM usage, response time, and memory leaks. You may also keep track of live web application sessions, JDBC connection pools, and thread pools. - AppDynamics
AppDynamics is a monitoring solution for Apache Tomcat applications. AppDynamics can automatically detect application code on Tomcat and provide a top-down view of the service's performance. You can use this tool to keep track of your server's performance, availability, and health.
Wrap Up!!!
Tomcat performance monitoring is essential for successfully running Java applications in production. Memory monitoring in Tomcat guarantees that your application responds to requests quickly and detects any potential errors or memory leaks in your code. You'll need this information to keep track of your production applications and to keep an eye on any potential issues.
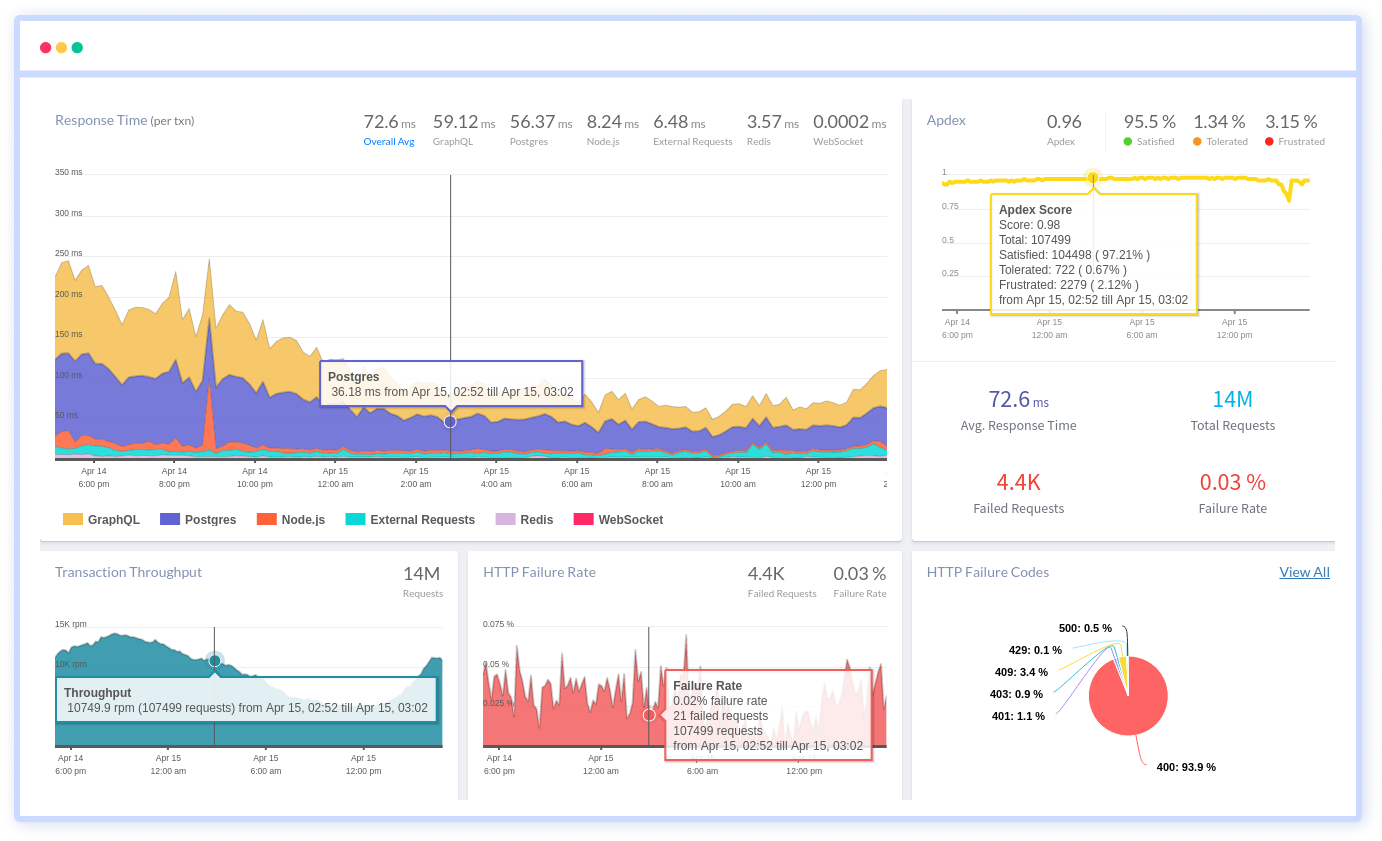
Monitor Your Apache Tomcat with Atatus
Atatus visualises end-to-end business transactions in your Tomcat application automatically. Tomcat Monitoring keeps track of the number and type of failed HTTP status codes as well as application crashes. On each and every business transaction, you can analyse response time to find Tomcat performance issues and Tomcat errors. You can also figure out how methods and database calls effect your customers' experiences.
To make bug fixing easier, every Tomcat error is captured with a full stack trace and the specific line of source code marked. To assist you in resolving the Tomcat error, look at the user activities, console logs, and all Tomcat events that occurred at the moment. Error and exception alerts can be sent by email, Slack, PagerDuty, or webhooks.
#1 Solution for Logs, Traces & Metrics
![]() APM
APM
![]() Kubernetes
Kubernetes
![]() Logs
Logs
![]() Synthetics
Synthetics
![]() RUM
RUM
![]() Serverless
Serverless
![]() Security
Security
![]() More
More


