Discover some of the best monitoring tools for Redis that will help keep Redis instances running smoothly without being startled by unexpected problems.
Uncover the dynamics of Kubernetes Networking—Services for internal connections, Ingress for external access—essential elements for scalable and resilient application architectures
Among developers, there has been always confusion between monitoring servers and the applications. Here we have discussed the major differences between server and application monitoring.
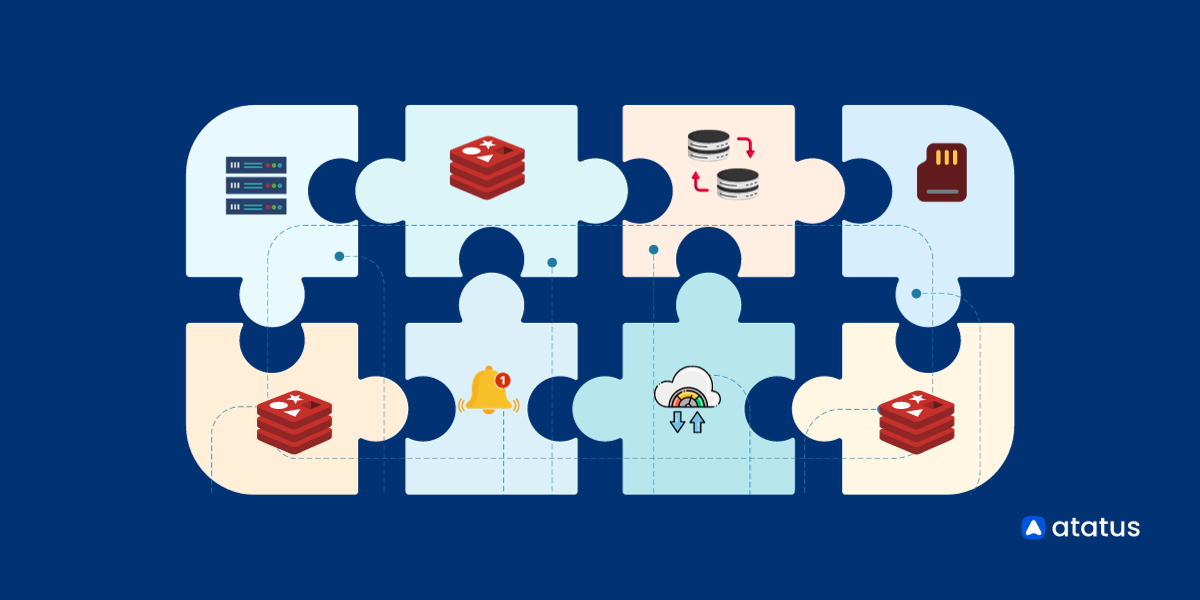
Redis stores and manipulates a huge amount of data, it is even called a data structure server. To protect your data in it, we recommend monitoring Redis Performance Metrics.
Understand the key differences between Prometheus metrics: Counters and Gauges. Discover their characteristics, use cases, practical examples, and best practices to build actionable monitoring strategies.
As the market for log monitoring and analysis tools has matured, a mix of commercial and open-source products are now available. This article focuses on the differences between ELK and Graylog, two log monitoring tools.
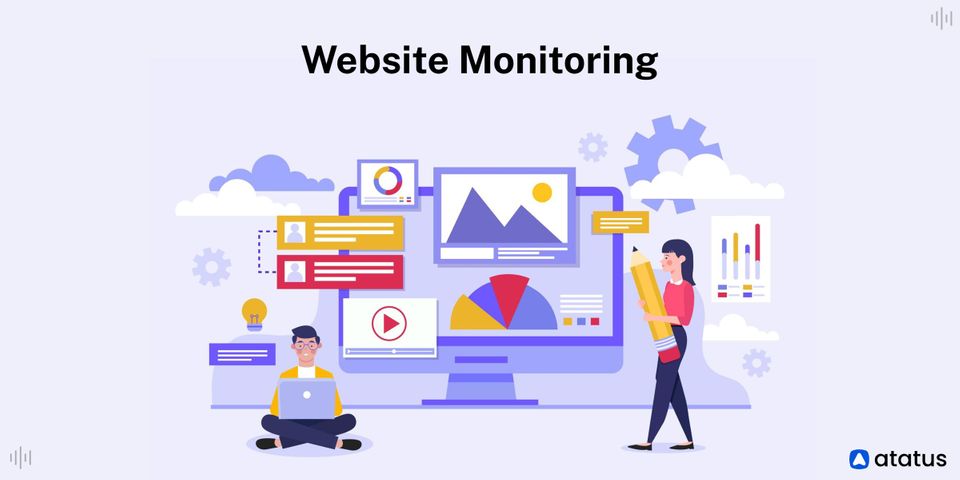
In this blog post, we will discuss website performance monitoring by explaining what it is, why you need it, and the best practices to improve website performance. Let's start by defining what website monitoring is.
Monitor your entire software stack
Gain end-to-end visibility of every business transaction and see how each layer of your software stack affects your customer experience.