8 Redis Monitoring Tools To Check Out
The open-source data platform Redis, based on in-memory data, is complicated enough when hosted only on one server. Therefore, a critical aspect of Redis management is monitoring its performance.
Despite serving a vast number of queries, Redis is known for its low latency response time. Keeping track of your Redis instance's performance can be done by monitoring certain vital Redis performance monitoring metrics.
As well as storing data in memory and on disk simultaneously, Redis stands apart from most other databases.
Databases are an integral component of most applications, so insights into their performance are intensely valuable. In order to ensure Redis' availability and performance, it's noteworthy to monitor the instance.
Table Of Contents
Redis - What is it?
An open-source in-memory database named Redis, which stands for Remote Dictionary Server, has multiple uses. It was developed by Salvatore Sanfilippo and was launched in 2009.
The Redis platform allows you to store data openly. Even though Redis offers a NoSQL-style database interface, it is technically more than just a database. A cache and message broker can also be used with it.
A memory-based storage system allows for high throughput (because it is faster than a disk-based system), whereas a disk-based storage system ensures that the data can be retrieved and restored if the system crashes. A variety of applications can be reinforced by Redis:
i) Message Broker
High-scale distributed systems are greatly dependent on message brokers. Therefore, in addition to supporting pattern matching and a wide range of data structures, Redis is equipped with a pub/sub messaging queue.
ii) Caching
In general, Redis databases are used for caching. With Redis, you can make primary memory caches that are incredibly resilient, with minimal latency, and can manage extensive collections of data Instantaneously.
iii) Streaming Engine
It is possible to stream live data streams using Redis' in-memory data store.
iv) Database
The Redis database is widely implemented as a caching database, and Redis has now been consolidated as a major database as well. The adoption of Redis in contemporary applications simplifies their complexities when interoperating with other databases such as DynamoDB.
What is Redis Monitoring?
Data structures, speed, and performance are the most outstanding attributes of the Redis NoSQL database system.
Redis datasets are completely stored in-memory, which permits sub-millisecond response times; scrutinizing Redis is also imperative.
The Redis database has numerous attributes for, say, session managing, gaming, media streaming, and real-time monitoring, and it also incorporates chat/messaging, leaderboards, and pub/sub.
Redis monitoring tools assist organizations by monitoring all Redis performance monitoring metrics and providing swift alerts to provide a robust and sturdy Redis system.
Let's grab a glimpse at some of the finest and best Redis monitoring tools that will enable you to stay on top of your Redis clusters or instances without being startled by unexpected issues.
1. Atatus
With Atatus Redis monitoring tool, you can diagnose and fix your web and backend applications in real time with intricate and in-depth insights. In addition, improve your app's digital experience by finding performance bottlenecks by employing infrastructure monitoring.
Diagnosing and resolving performance issues that influence your business can be done with extensive infrastructure oversight. Analyze application metrics, logs, and traces to make more informed business decisions.
Plugins are available in Atatus for Redis monitoring. The Redis Plugin in Infrastructure monitoring collects all the necessary Redis performance monitoring metrics required for monitoring.
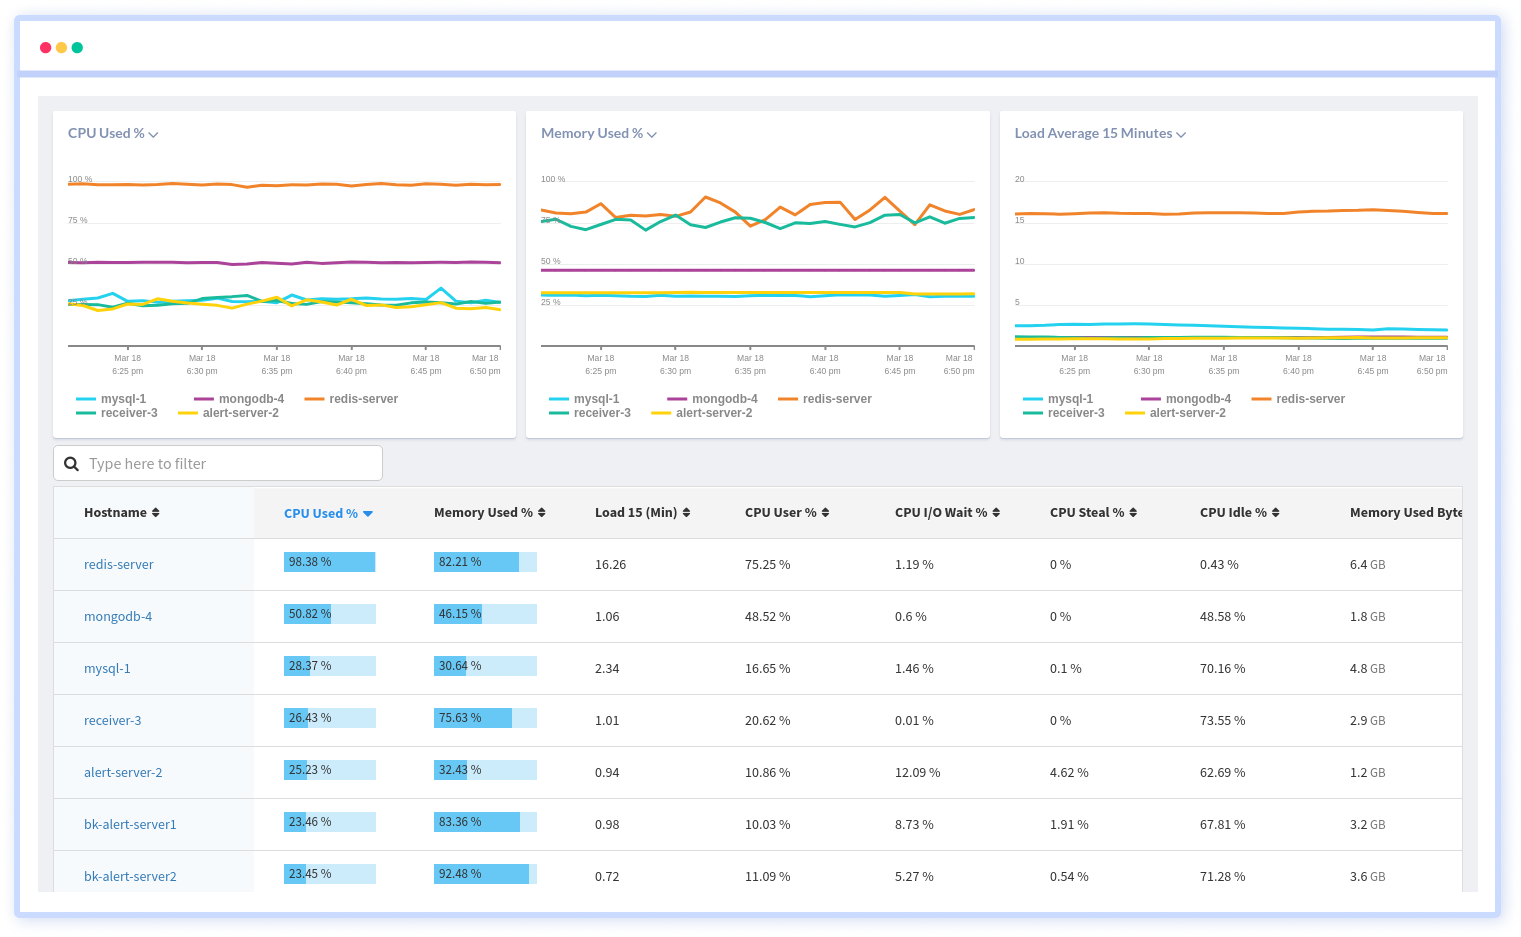
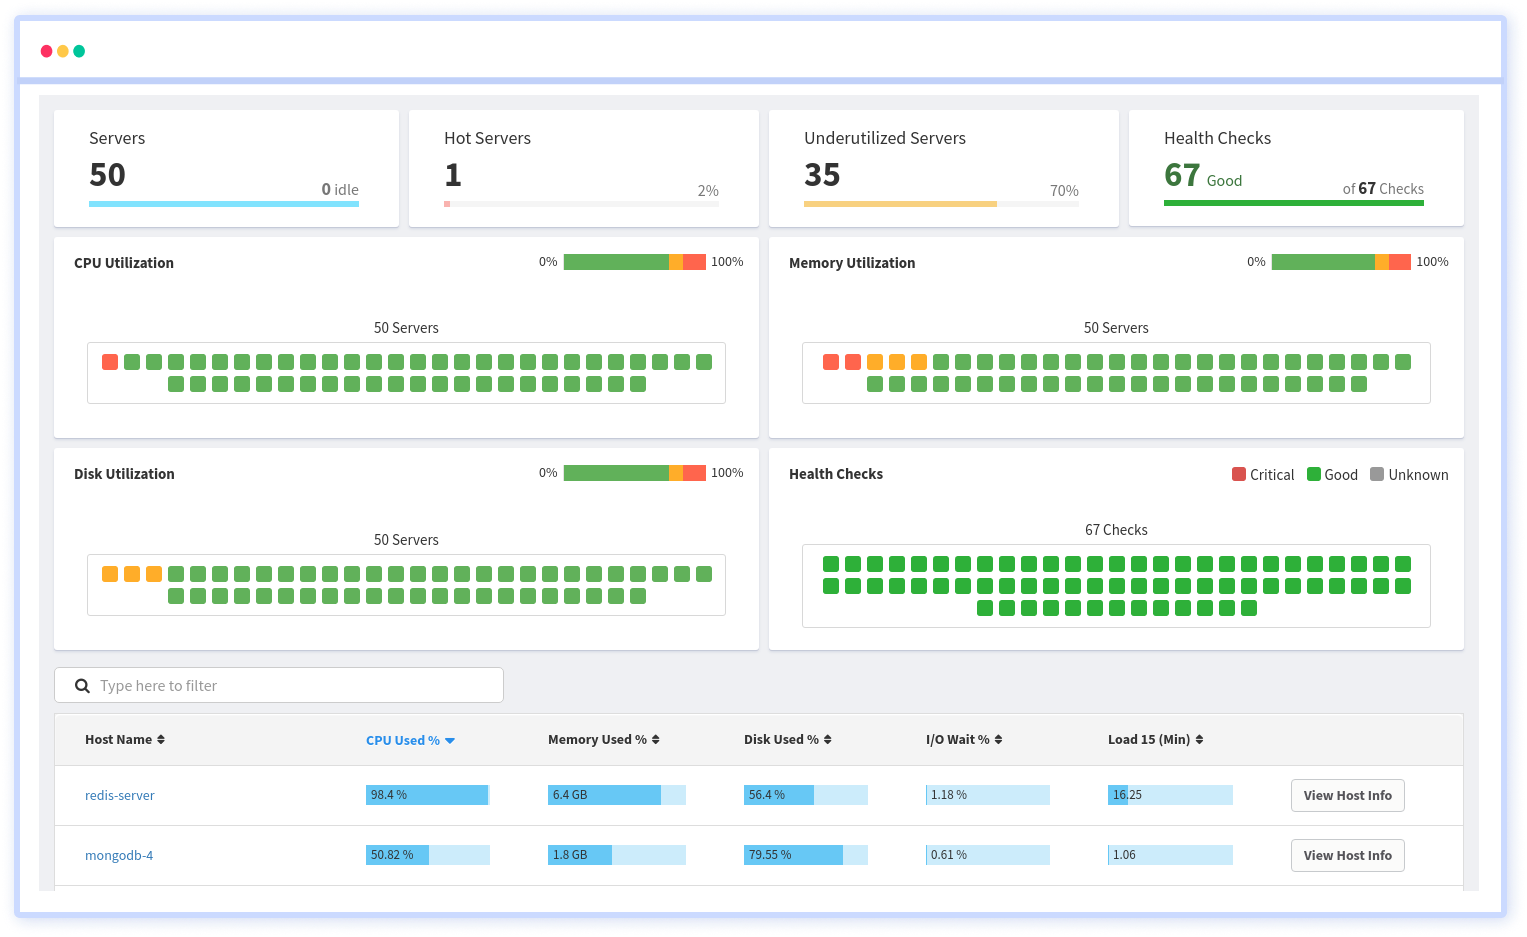
By monitoring your servers and hosts, Atatus delivers complete insight into their performance, measuring CPU and memory usage, analyzing load averages, etc.
With the package tracking feature of Atatus, you can track different packages on different hosts using different versions of each package. In addition, we keep track of all the packages installed on the servers.
Implement health checks to reduce downtime and resolve issues for application services. Get it integrated with indecent management systems, e.g., JIRA, PagerDuty, VictorOps, and more.
Learn how the system uses the available resources and where optimizations can be made to identify the processes slowing down the system. All modifications, installations, updates, and removals on your server are displayed.
By categorizing and sorting them, you can uncover vulnerable packages, those that need upgrading, and the overall status of your servers while monitoring their performance in real time.
Redis monitoring metrics that Atatus offers:
- Memory Info
- Fragmentation Memory Ratio
- Evictions Keys
- Blocked Clients
- Client Connections
- Refused Connections
- Status of Master Link
- Processed Commands
- Connected Slaves
- Redis cache hit rate
Factors to consider
- Implement a real-time optimization strategy for the entire infrastructure.
- Stay up-to-date on your applications' downtime.
- Get a real-time view of your processes and services.
- Automated monitoring and analysis of Redis performance and behavior.
- Real-time monitoring of key Redis monitoring metrics such as memory usage, CPU utilization, and network bandwidth.
- Visualization of Redis performance and usage data under single dashboard.
- Support for monitoring multiple Redis instances and clusters.
- Integration with popular tools and platforms such as Slack, VictorOps, JIRA, Asana and much more for enhanced monitoring capabilities.
- Alert thresholds and notifications for key Redis monitoring metrics such as memory usage and CPU utilization.
- Scalability and flexibility to accommodate the needs of different Redis deployments.
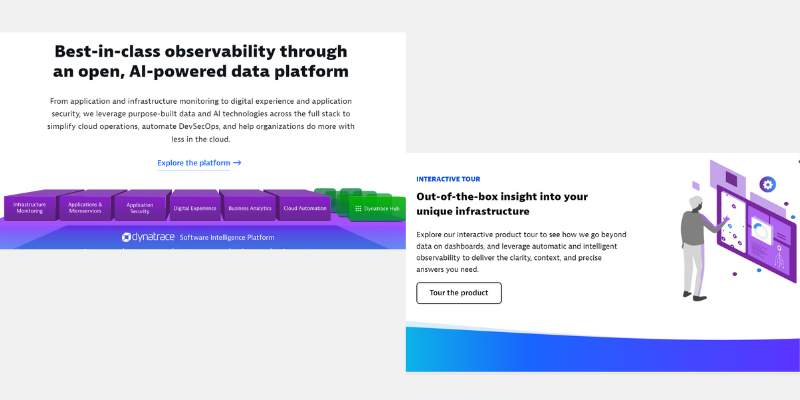
2. Dynatrace
In Dynatrace, DevOps and DBAs get pre-configured features coupled with AI-powered tools to maximize their monitoring efforts. Integrated monitoring and troubleshooting solutions are offered through this platform.
By scrutinizing and diagnosing Redis databases across all platforms, Dynatrace offers users detailed insight into individual database statements. The critical Redis performance monitoring metrics of Redis can be evaluated with this tool.
The Dynatrace platform delivers process-level visibility by analyzing network Redis monitoring metrics to discover sudden performance problems. By using innovative data visualization, you can efficiently determine how your applications utilize database resources.
In addition to monitoring, the platform aims to improve DevOps pipeline speed and scalability. The performance analytics can be captured over time to find out which Redis monitoring metrics have been modified as the database has improved concerning new and old databases.
Factors to consider
- It is possible to connect teams.
- Insights driven by artificial intelligence.
- Performance monitoring for infrastructure and applications.
3. AppOptics
Redis performance issues can be identified and troubleshot with SolarWinds AppOptics. By incorporating AppOptics with Redis, it is feasible to monitor crucial Redis performance monitoring metrics from a dashboard.
Monitoring Redis monitoring metrics and reclaiming that data into insights can be executed via an integrated dashboard that monitors uptime and other metrics in real-time. Redis Info commands can be visualized in the platform so you or your team can take action.
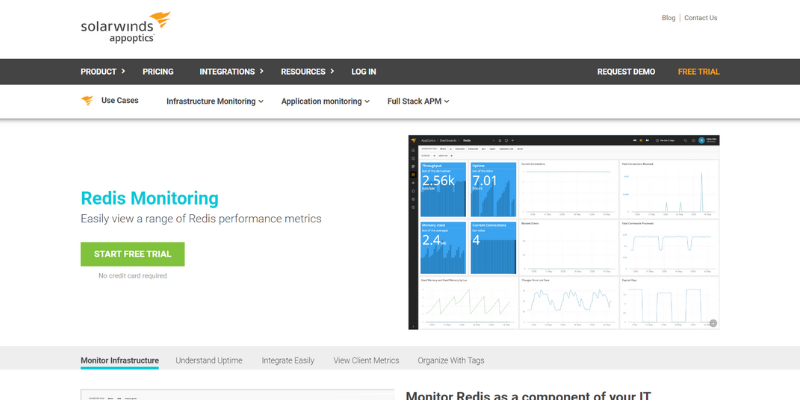
Besides creating custom tags, AppOptics allows users to manage and monitor Redis performance monitoring metrics more effectively. Various metrics such as client connections, CPU usage, memory utilization, Redis cache hit rate and input details are all trackable in real-time and as historical data logs.
Through AppOptic's accustomed tagging system, you can modify your tags corresponding to your necessities. Thanks to AppOptics, tags are automatically assigned to your servers, ports, databases, and hostnames.
Factors to consider
- Monitoring of infrastructure and APM.
- Using distributed tracing.
- Over 150 integrations.
4. Datadog
One of the monitoring traits proffered by Datadog is Datadog Infrastructure monitoring. It manages all services that sustain end-user software, such as office software provided over the network or websites and Web services equipped through the Internet.
Using the Datadog Redis Monitoring, you can analyze Redis memory performance, throughput, and Redis monitoring metrics. End-to-end application error rates can be discovered by identifying bottlenecks and slow queries.
Datadog Redis Monitoring permits to see stack traces and latency breakdowns. Dashboards generated by Datadog Redis Monitoring allow you to see logs, security signals, and other key metrics.
The dashboards can be customized using a drag-and-drop interface. In addition to detecting outlier situations, the Datadog Watchdog tool creates alarms based on data that accounts for specified fluctuations like seasonal changes.
Customizable dashboard screens authorize you to observe the interaction between Redis databases and server resources. As a result, you will see whether resources on the same server are running out and which applications should be terminated or moved to free up space.
Factors to consider
- On-premises and cloud-based Redis monitoring.
- A SaaS solution.
- Monitoring of multiple instances.
5. SolarWinds Database Performance Analyzer
Redis is one of the databases that SolarWinds Database Performance Analyzer can monitor across multiple different types of databases, including cloud-based SaaS tools.
Your database or Redis performance monitoring metrics can be envisioned by utilizing simple integrations on the platform. In light of the fact that most of the free and built-in utilities are command-line based, this is a flawless touch.
The monitoring software measures every query down to the microsecond, giving you an accurate picture of your database's performance and where bottlenecks begin.
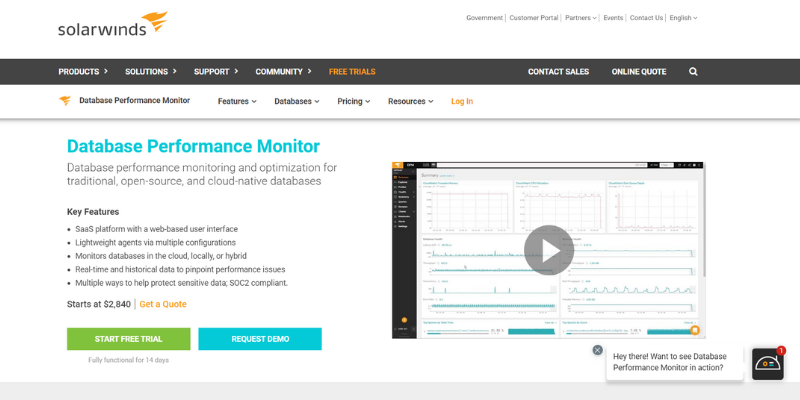
In addition to tracking top queries, memory allocation, and most popular services, the platform tracks the number of pre-configured Redis monitoring metrics. A DPM system can monitor and collect up to ten thousand metrics per second, ensuring that no issues are overlooked.
Monitoring and insights can be provided by DPM instantly. As a result of adaptive fault detection, DBAs and DevOps work together to discover problems, share data, and restore a database to optimal health.
For monitoring purposes, DPM runs directly on the server rather than in memory. It only uses a small percentage of CPU power. It's not necessary to deal with lengthy onboarding procedures, patching, or upgrades because it's a SaaS tool.
Factors to consider
- Multi-configurable lightweight agents.
- Manages cloud, on-premises, and hybrid databases.
- Performance issues can be pinpointed using real-time and historical data.
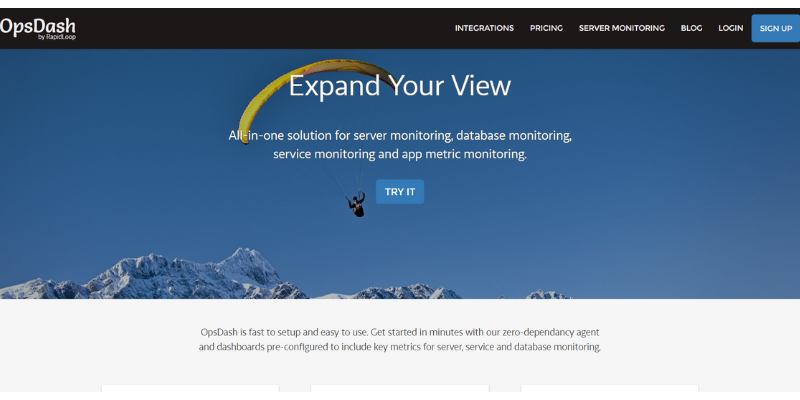
6. OpsDash
A full-featured monitoring system, OpsDash endows server monitoring, database monitoring, service monitoring, and app metric monitoring. App metrics are monitored with OpsDash without the need for a separate system.
You can push Redis monitoring metrics into OpsDash using StatsD and Graphite. Integral and warning alert thresholds can be set by employing OpsDash. Provide your team with notifications via e-mail, HipChat, Slack, PagerDuty, OpsGenie, and VictorOps.
The OpsDash setup process is intuitive and swift. Thanks to pre-configuring dashboards, you can get a consolidated view of key Redis performance monitoring metrics and an instant assessment of Redis instances' health and Redis cache hit rate.
By glancing at the dashboard, you can see how much memory is utilized, how many items are in memory, how many operations take place in a second, and how well-cached data is being recovered.
Moreover, end-users can configure necessary upper limits for Redis monitoring metrics to pinpoint problematic performance issues and monitor customized metrics.
Factors to consider
- Using OpsDash is easy and fast.
- Dashboards with smart features and pre-configured settings.
- A rule-based alerting and notification system.
7. ManageEngine Applications Manager
With Applications Manager's Redis monitor, you can check memory usage, network traffic, and your system's general health. In addition to tracking memory-specific Redis monitoring metrics, it also measures Redis cache hit rate and fragmentation ratios.
As part of its Redis performance monitoring tool, Applications Manager proffers a fault management system for pinpointing the root cause of performance issues and detecting oddities in real time for proactive diagnosis.
As well as furnishing extensive and detailed reports to monitor and analyze performance, it supports the aggregation and visualization of key Redis monitoring metrics. Redis databases can be viewed in the context of your entire system through ManageEngine Applications Manager.
All applications and server resources are tracked, and the service creates a map showing their relationship. All of the systems that access your Redis databases are displayed on the automatic application dependency map, as are all of the resources the database is reliant on.
Application Manager's Redis monitoring service tracks a range of memory statuses. In addition to Redis-driven memory events, it also monitors the memory status across the system.
Monitoring of Redis database interactions is also carried out by the monitor. This factor is extremely relevant when interacting with Redis because it is a clear indicator of success.
Performance thresholds and alerts offered by the Applications Manager make it an ideal system monitor for teams that are overworked and expected to execute multiple tasks. E-mail or SMS notifications are available for alerts. Root cause analysis is facilitated by the prepared application dependency map.
Factors to consider
- Supports Windows Server and Linux.
- Alerts concerning performance.
- Keeping track of activities.
8. Site24x7
With Site24x7's versatile Redis monitoring platform, you can monitor servers, networks, applications, and websites. A special plugin for monitoring Redis is available as part of the Site24x7 Infrastructure plan, which monitors networks, servers, and services.
In the standard Site24x7 Infrastructure bundle, you will receive credit for monitoring up to ten servers. Despite being a cloud-based platform, there are no specifications about where the servers should be located. One plugin is allowed per server on the plan.
The plugin you use for one server may not necessarily work for another. Using the plugin allowance for the Linux server where Redis runs on your site, you can monitor Redis from that server.
Monitoring cloud platforms such as AWS and Azure is available through Site24x7 Infrastructure. An Amazon implementation of Redis, AWS Elasticache, is monitored by a plugin. Azure Redis Cache also has a plugin.
Factors to consider
- Combined application and infrastructure monitoring.
- Cloud-based.
- Monitors on-premises and cloud instances.
Final Thoughts - What's the best option?
Using Redis, applications can respond within milliseconds, which is exceptionally effective for time-constrained applications.
The use of Redis databases is critical for high-volume applications in a variety of industries, so making sure that the performance of the database is monitored and optimized proactively is imperative.
Each command returned by Redis returns an array of Redis metrics, which allows us to track the health of all systems.
It is essential to monitor the Redis memory as part of the observation and optimization of your Redis database so that you can sustain the highest efficiency for your network.
How do you pick between these best Redis monitoring tools? An adequate infrastructure monitoring investment is essential for the observability of performance throughout the IT stack. As far as monitoring Redis is concerned, Atatus is the perfect solution.
Employing Atatus' infrastructure monitoring, you will be able to gain a complete perspective of the operations of your hosts. Having an all-encompassing view of your company's IT infrastructure guarantees performance and stability are constantly high.
Most often, SolarWinds Database Performance Analyzer (DPA) provides the best combination of attributes blended with intricate Redis metrics about your Redis database. Its functionalities provide a great choice for all dev teams.
Fused with additional sensors, Site24x7 provides application performance monitoring tools that can easily be mounted over time to include network monitoring and Redis database infrastructure monitoring.
Redis Monitoring with Atatus
Track the availability of the servers, hosts, virtual machines and containers with the help of Atatus Infrastructure Monitoring. It allows you to monitor, quickly pinpoint and fix the issues of your entire infrastructure.
In order to ensure that your infrastructure is running smoothly and efficiently, it is important to monitor it regularly. By doing so, you can identify and resolve issues before they cause downtime or impact your business.
It is possible to determine the host, container, or other backend component that failed or experienced latency during an incident by using an infrastructure monitoring tool. In the event of an outage, engineers can identify which hosts or containers caused the problem.
As a result, support tickets can be resolved more quickly and problems can be addressed more efficiently.
#1 Solution for Logs, Traces & Metrics
![]() APM
APM
![]() Kubernetes
Kubernetes
![]() Logs
Logs
![]() Synthetics
Synthetics
![]() RUM
RUM
![]() Serverless
Serverless
![]() Security
Security
![]() More
More