ELK vs Graylog: Log Management Comparison
As organizations face outages and various security threats, monitoring an entire application platform is critical to determine the source of the threat or the location of the outage, as well as to verify events, logs and traces to understand system behavior at the time and take proactive and corrective actions.
Identifying intrusion attempts and misconfigurations, tracking application performance, improving customer satisfaction, strengthening security against cyberattacks, performing root cause analysis, and analyzing system behavior, performance, measures, and metrics based on logs analysis are all important for any IT operations team.
According to a Gartner report, the market for synthetic monitoring and APM solutions will reach $4.98 billion by 2019, with log monitoring and analytics becoming a de facto aspect of AIOps. Log analysis tools are gaining traction as a low-cost alternative for application and infrastructure monitoring.
As the market for log monitoring and analysis tools has matured, a mix of commercial and open-source products is now available. Powerful search capabilities, real-time dashboards, historical analytics, reports, alert notifications, thresholds and trigger alerts, measurements and metrics with graphs, application performance monitoring and profiling, and tracing events are some of the key features of log monitoring tools.
This article focuses on the differences between Graylog and ELK, two log monitoring tools.
- Introduction to ELK
- Introduction to Graylog
- Key Difference Between Graylog vs ELK
- How to Choose the Right Tool?
Introduction to ELK
ELK is made up of three different services. They're all open-source and created by the same team. It's written in Java and serves as a wrapper for Apache Lucene. Elastic search supports full-text query search analysis. It makes use of the Query DSL, which is based on the Lucene search language.

ELK acronym for Elasticsearch, Logstash, and Kibana:
- Elasticsearch is a highly scalable and powerful search engine that can store massive volumes of data and be utilized in a cluster.
- Logstash is a tool that allows you to fetch data from and send it to a specific location. It comes with a large user community and a large number of plugins.
- Kibana is a graphical user interface for searching, analyzing, and visualizing massive amounts of complicated data in the Elasticsearch database. It takes less than 5 minutes to complete the deployment process.
In most circumstances, Filebeat is used by the ELK stack. This tool's goal is to send logs to a certain server from a logs collector. They are placed in an ElasticSearch cluster after being delivered with Filebeat and processed with Logstash. The logs are then sent to Kibana for visualization.
It's a web API interface that uses HTTP. It has no schema and all data is saved in JSON documents. It's similar to MongoDB in that it's relatively simple to set up because it doesn't have a schema.
After ElasticSearch, which was first released in 2010, teamed up with Logstash and Kibana, the stack was born. Log aggregation is a vital component of proper log management, hence the two most significant aspects of the ELK stack for analysis are Logstash and Kibana.
Filebeat, a mechanism for forwarding and centralizing logs, is commonly used in the ELK stack. After they've been forwarded, Logstash is used to process them and turn them into an ElasticSearch cluster. They begin the visualization process using the Kibana component of the stack from there.
ELK's log analysis procedure is as follows:
- The ELK stack uses a filebeat (a lightweight tool used to centralize all logs) to direct all logs to a specified server in most cases interested in log analysis.
- All of the data pushed by filebeat is sent to logstash to be processed. Logstash is a lightweight and adaptable system. It can be used with a variety of plugins but at the expense of performance.
- Although logstash is simple to use, its limitations make it difficult to process large amounts of data.
- All of the data processed by logstash will be delivered to kibana for visualization. It's extremely interactive, allowing users to choose the type of visualization they want. Along with data visualization, it also provides statistics on how the applications will perform in a real-world environment.
Usability:
ELK has a fairly steep learning curve due to its advanced nature. It's also challenging to keep up with. However, it does allow you to do practically everything you need with only one tool. It can be a great solution once you get past the learning curve. Logs, metrics, and visualizations are useful, and if you need more, you may browse the vast ecosystem of plugins accessible.
Pros:
- Robust solution
- A wide range of plugins is available
- Logstash lets you build your log processing pipeline
- Kibana visualizations are incredible
- ElasticSearch gives you complete control over how data is indexed
Cons:
- The learning curve is steep
- It requires a lot of attention
- There are no "logging" dashboards in Kibana by default
- Authentication and Alerting are premium features that must be purchased
Pricing:
Although the ELK stack is a free open-source solution, it can be quite pricey for a company. The total cost varies widely from company to company and is determined by factors such as the volume of data generated by your systems, the length of time you want to keep data, and data accessibility. Even though it is "free," the ELK stack has hidden expenses that soon pile up.
Introduction to Graylog
Graylog is dependent on MongoDB and Elasticsearch. It's a powerful log management solution designed to handle the processing, analysis, and comprehension of terabytes of log data, but its functionality is restricted if you go beyond what it does well.
This means that attempting to accomplish something outside of its normal scope will be difficult and time-consuming. Users can also acquire hands-on experience with an open-source package.
It's written in Java and works with GLEF (Graylog extended log format). The search language is Lucene syntax.
You'll probably need to add other tools like Atatus for monitoring and analysis, or custom scripts and programs to extend its functionality. Graylog provides a powerful "all-or-nothing" type of solution for heavy parsing requirements.
Graylog's log analysis procedure is as follows:
Graylog is made up of three parts: MongoDB, Graylog's main server, and Graylog's web interface.
- Graylog clients are configured in a specific way to allow server-client communication. The log data is sent to the server, which analyses it and stores it in MongoDB.
- Graylog's web UI is incredibly user-friendly, and it gives you complete control over user permissions. It makes use of RESTful APIs.
- Graylog does not support Syslog, however, the web UI can handle a wide range of data types. Graylog should receive data directly. This makes log handling in the dashboard challenging.
Usability:
Graylog has a rather short learning curve, allowing you to have a nearly completely functional system in a short amount of time. Graylog is also enjoyable to use because all critical items are easily accessible in the GUI.
Pros:
- It offers a user-friendly interface and can handle a variety of data formats
- Gives you a lot of flexibility over authentication and user permissions
- You may also set it up to send you email alerts
- Graylog makes advantage of the tried-and-true REST API
Cons:
- Graylog cannot read Syslog files, thus you must submit your messages directly to Graylog
- In terms of management, the dashboard isn't user-friendly enough
- The reporting functionality is abysmal
Pricing:
Graylog is open-source software that you can use for free. For $1,500 per Graylog-server instance in your Graylog cluster, an enterprise license is also available.
Key Difference Between Graylog vs ELK
Let's look at some of the primary differences between Graylog and ELK:
- ELK is a stack that uses elastic search to gather, index, and store data; logstash is the tool that analyses all of the information that is stored in elastic search, which might be log data. Kibana uses its interactive dashboard to visualize all of its inferences and observations. Graylog is primarily for log analysis, whereas the ELK stack is mostly for big data analysis. Unlike ELK, it solely handles log data.
- In ELK, kibana is used for visualization; kibana must be put up separately from the others. Graylog is a complete processing and visualization system. Its user interface is significantly more engaging and user-friendly than Kibana's. Graylog is quite powerful when it comes to log analysis.
- To some extent, both the ELK stack and Graylog are open-source tools, allowing users to gain hands-on experience, receive continuing support, and license all premium features.
- Graylog is a centralized system that is utilized in a variety of security applications. Since all data is consolidated and thus accessible from anywhere, Terabytes of data may be analyzed from numerous log sources as well as multiple geographic locations.
How to Choose the Right Tool?
ELK stack and Graylog are two prominent log management solutions that share a lot of the same fundamental functionality. The best option relies on what's important to you and what your company requires.
In queries and visualizations, DevOps engineers and CTOs are mostly concerned with speed, reliability, and flexibility. The ELK stack is a better solution for this. Alerting, proactivity, live tail, automatic insights, and workflow integration are more factors to consider.
Graylog is your best option if alerting is crucial to you. Graylog is also a better alternative for collecting security logs, whereas the ELK stack can be a little more complex to set up.
Everyone has different requirements, which should help you make a decision. Keep in mind the expense as well as the maintenance requirements.
Conclusion
In terms of a core set of functionalities, both solutions are fairly comparable. The system and its requirements must be taken into account while choosing a tool. Graylog is a strong tool with a user-friendly interface, whereas the ELK stack is modular and adaptable. It is up to the users to choose whatever option best suits them. There are hybrid applications that combine the two.
As part of full-stack monitoring, log monitoring is very important because it can provide greater insights for faster troubleshooting. The log monitoring tools you choose will be determined by your needs, infrastructure, price, and monitoring and maintenance requirements.
Atatus Logs Monitoring and Management
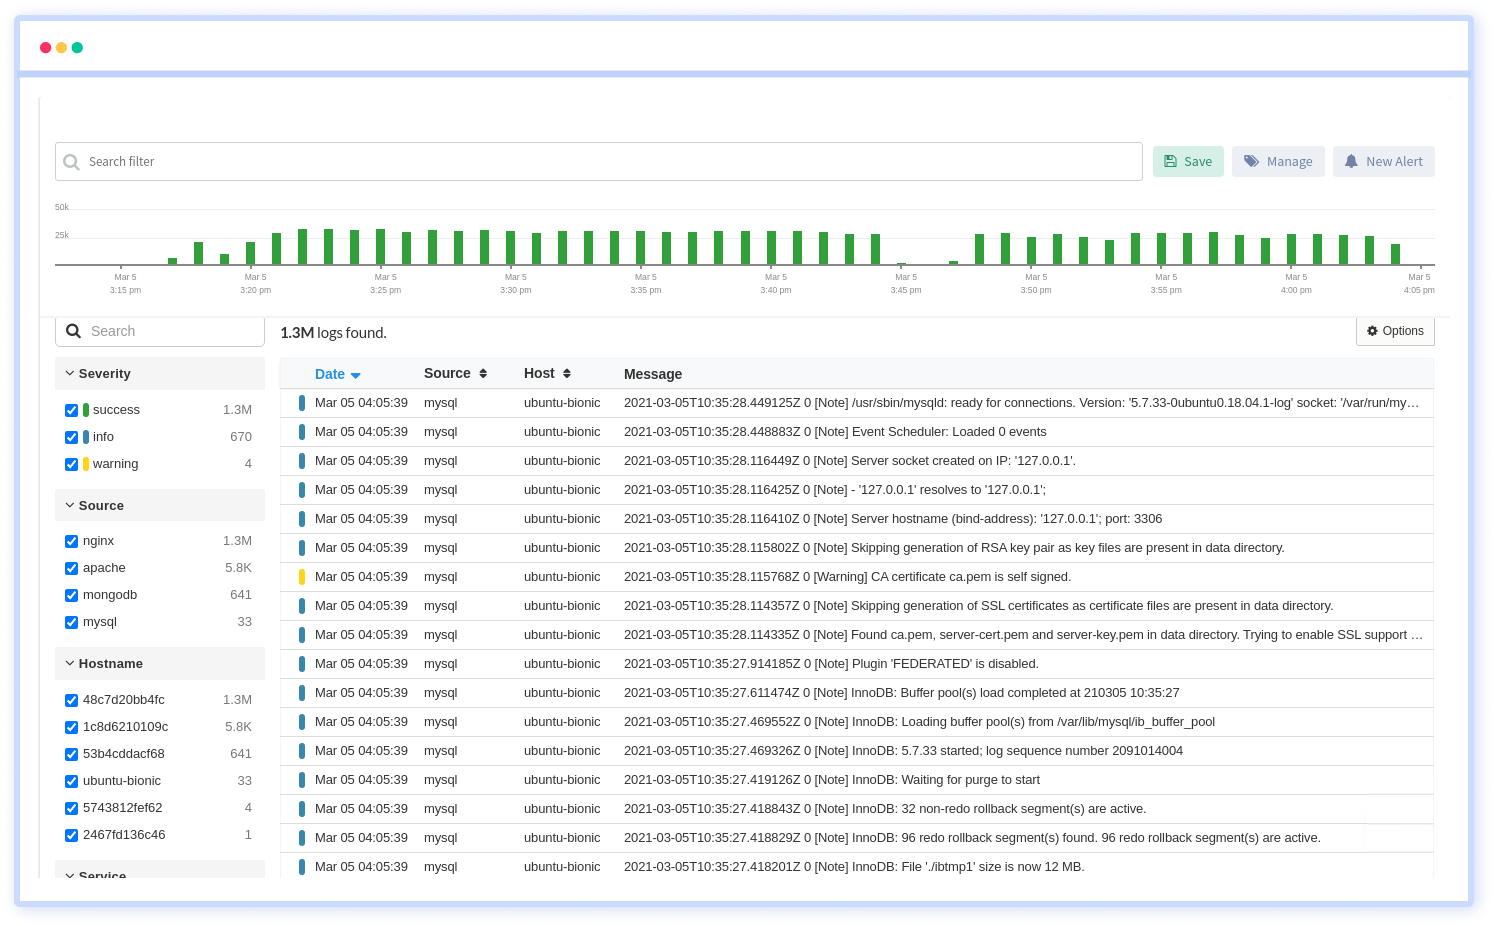
Atatus offers a Logs Monitoring solution which is delivered as a fully managed cloud service with minimal setup at any scale that requires no maintenance. It monitors logs from all of your systems and applications into a centralized and easy-to-navigate user interface, allowing you to troubleshoot faster.

We give a cost-effective, scalable method to centralized logging, so you can obtain total insight across your complex architecture. To cut through the noise and focus on the key events that matter, you can search the logs by hostname, service, source, messages, and more. When you can correlate log events with APM slow traces and errors, troubleshooting becomes easy.
#1 Solution for Logs, Traces & Metrics
APM
Kubernetes
Logs
Synthetics
RUM
Serverless
Security
More


![New Relic vs Splunk - In-depth Comparison [2026]](/blog/content/images/size/w960/2024/10/Datadog-vs-sentry--19-.png)
![Splunk vs Prometheus: A Side-by-Side Comparison [2025 Guide]](/blog/content/images/size/w960/2024/08/Datadog-vs-sentry--13-.png)
