PHP-FPM Performance Optimization: The Complete Tuning + Monitoring Guide

When your PHP-based application starts attracting thousands of visitors, the way you run PHP becomes critical. A slow-loading page or a server crash during peak hours can cost you revenue, users, and reputation.
PHP-FPM (PHP FastCGI Process Manager) is the default way most high-performance websites run PHP. While its default configuration works fine for small to medium workloads, high-traffic applications need custom tuning to handle large volumes of requests efficiently.
In this guide, we will discuss how to tune PHP-FPM for heavy traffic, what each important setting does, and how to monitor and improve performance over time.
Guide Overview
- What is PHP-FPM and Why Tune It for High Traffic?
- How PHP-FPM Handles Requests
- Monitoring PHP-FPM Performance in Production
- Common PHP-FPM Problems You Can Detect with Atatus
- Why Monitoring Matters More Than Configuration
- Troubleshooting PHP-FPM with Distributed Tracing
- Atatus PHP-FPM Monitoring
- Frequently Asked Questions
What is PHP-FPM and Why Tune It for High Traffic?
PHP-FPM improves how PHP scripts execute by using multiple worker processes to handle several requests in parallel, reducing response times and improving throughput compared to processing requests one at a time.
For high-traffic websites, the main tuning challenge is balancing:
- Enough workers to handle peak concurrent requests without delays
- Not too many workers that they exhaust RAM and cause server instability
The default PHP-FPM settings are usually conservative, designed for average workloads. In a busy production environment, tuning PHP-FPM is essential to prevent bottlenecks, crashes, and slowdowns.
New to PHP-FPM? Read What is PHP-FPM? An In-Depth Guide before diving into tuning.
How PHP-FPM Handles Requests?
When a request reaches the web server:
- Nginx or Apache forwards it to PHP-FPM using FastCGI.
- PHP-FPM assigns the request to an idle worker process.
- The worker executes the PHP code and sends the result back.
- If all workers are busy, incoming requests are queued, increasing wait time.
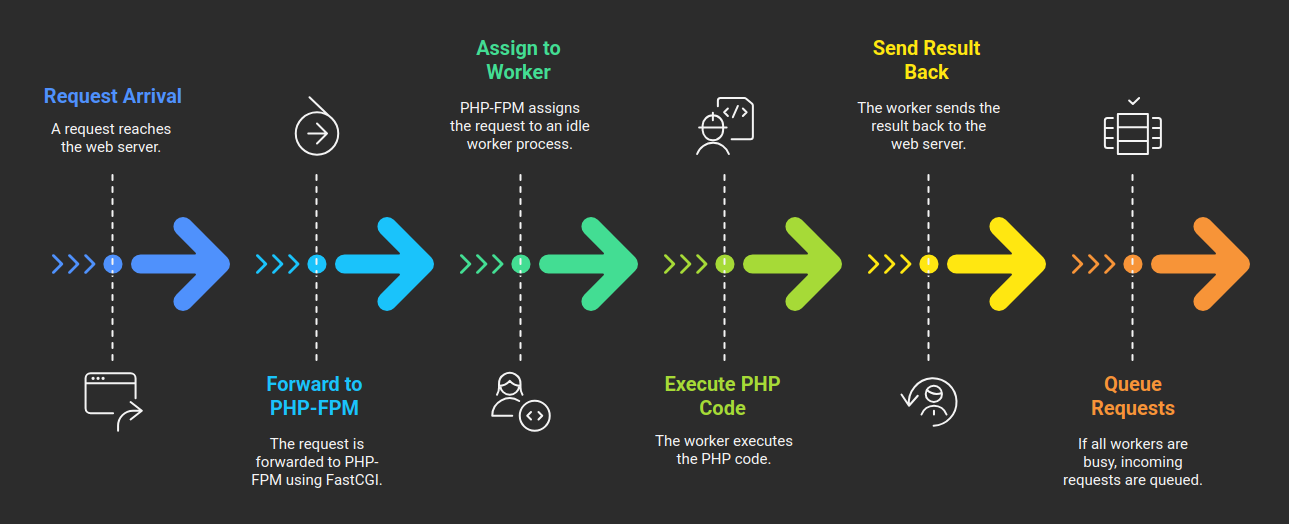
The worker count and management strategy directly influence throughput and response speed.
Still seeing slow PHP requests after tuning PHP-FPM?
Monitor every request, database query, external API call, and bottleneck with Atatus PHP APM.
Choosing the right process manager mode
PHP-FPM decides how to create and manage worker processes using the Process Manager (PM) configuration. This setting affects how quickly your server can respond to requests and how much memory it uses.
| Mode | How it Works | Best For |
|---|---|---|
| static | Always runs a fixed number of workers, no matter how busy or idle the server is. | High-traffic sites with consistent load throughout the day. |
| dynamic | Starts with a set number of workers and automatically adds or removes them within configured limits. | Most web apps with traffic that changes during the day. |
| ondemand | No workers run until a request comes in. New workers are created as needed and closed after being idle. | Low-traffic sites or servers with very limited resources. |
Which mode should you choose for high traffic?
Staticis best if your traffic is predictable and always high
For example, a site with a steady audience all day. This avoids the small delay of creating workers on demand.
Dynamicis better if your traffic spikes and drops at different times
For example, an e-commerce store that’s busier during sales hours. It saves memory when traffic is low but can still scale up when needed.
- Avoid
ondemandfor high-traffic environments, the worker creation time can slow down responses during busy periods.
Key PHP-FPM Tuning Parameters
Tuning PHP-FPM is all about controlling how many PHP workers run, how they are started, and how long they live. These settings directly impact how your server handles traffic spikes and memory usage.
(i) pm.max_children
pm.max_children defines the maximum number of PHP-FPM worker processes that can run at the same time.
- If this number is set too low, incoming requests will start waiting in a queue, leading to higher response times.
- If it’s set too high, the workers may consume more RAM than your server can handle, which can cause swapping or even crashes.
To find the right value, divide the total RAM allocated for PHP by the average memory usage per PHP process,
pm.max_children = (Total RAM for PHP) / (Memory per PHP process)
For example, if you have 4 GB (4096 MB) of RAM available for PHP and each process uses about 50 MB, the calculation would be,
pm.max_children = 4096 / 50 ≈ 81
It is best to keep this slightly lower for safety, so you might set it to 75.
You can check your actual memory usage per process with:
ps -ylC php-fpm --sort:rss
(ii) pm.start_servers
pm.start_servers controls how many PHP-FPM worker processes are launched immediately when PHP-FPM starts.
- If set too low, sudden traffic spikes can cause cold starts, which slows down response times.
- If set appropriately, workers are ready and waiting, allowing the server to handle incoming requests instantly.
Recommendation for high traffic: Set to 30–50% of pm.max_children.
For example: If pm.max_children = 75, then pm.start_servers = 23 to 38.
(iii) pm.min_spare_servers & pm.max_spare_servers
pm.min_spare_servers and pm.max_spare_servers control how many idle PHP-FPM workers are kept ready to handle new requests.
pm.min_spare_servers → The minimum number of idle workers.
pm.max_spare_servers → The maximum number of idle workers.
These settings ensure that a sufficient pool of workers is always ready, so sudden traffic spikes don’t have to wait for new workers to start.
- If too low, requests may queue during spikes.
- If too high, you may waste memory on unused workers.
Recommendation:
pm.min_spare_servers = 25–30% of pm.max_children
pm.max_spare_servers = 50–70% of pm.max_children
For example (if pm.max_children = 75):
pm.min_spare_servers = 19 to 23
pm.max_spare_servers = 38 to 53
(iv) pm.max_requests
pm.max_requests determines how many requests a single PHP-FPM worker can handle before it is restarted.
Over time, PHP processes can gradually consume more memory due to memory leaks or temporary data that isn’t fully cleared. If a worker handles too many requests without being recycled, its memory usage can grow, eventually slowing down your server or causing crashes. Recycling workers after a set number of requests ensures memory is freed regularly, keeping your server stable.
Recommendations:
For high-traffic sites, a good range is 500–1000 requests per worker.
For memory-heavy frameworks like Laravel or Symfony, set a lower value
of 300–500 requests, since each request may use more memory.
Tip: Setting pm.max_requests too low causes workers to recycle very frequently, which adds CPU overhead. Setting it too high risks memory bloat and potential slowdowns. The key is to balance worker recycling to maintain performance without excessive overhead.Additional PHP-FPM settings for high traffic
Besides worker management, a few extra PHP-FPM settings are important for handling high traffic efficiently.
(i) request_terminate_timeout
This setting kills PHP requests that take too long to complete, such as stuck or infinite scripts.
Recommended value: 30–60 seconds in production.This helps prevent slow scripts from blocking workers and delaying other requests.
(ii) listen.backlog
Controls the size of the request queue waiting for available workers.
Recommended value: 512–1024 for busy servers.A higher value ensures that incoming requests don’t get dropped when all workers are busy.
(iii) rlimit_files
Increases the maximum number of open file descriptors PHP-FPM can use.
Recommended value: 65535 for high-concurrency servers.
This ensures PHP-FPM can handle many simultaneous connections without hitting OS limits.
Monitoring PHP-FPM Performance in Production
Configuration tuning sets a baseline. But production traffic is never static, so five signals matter most day to day:
- Request latency - how long requests take end-to-end, including queue wait time.
- Worker utilization - the ratio of active to idle workers at any given moment.
- Queue buildup - requests waiting because all workers are busy, an early warning sign before errors appear.
- Memory leaks - workers that grow heavier over time instead of releasing memory after each request.
- CPU spikes - sudden load increases tied to a deploy, a traffic surge, or a slow query.
With Atatus PHP APM, these signals sit on one dashboard next to your logs and traces, so a spike in queue depth can be traced back to the exact deploy, query, or endpoint that caused it.
Configuration changes don't always reveal why PHP-FPM slows down under production traffic.
Common PHP-FPM Problems You Can Detect with Atatus
Most PHP-FPM slowdowns trace back to one of a handful of recurring patterns. Atatus surfaces each of these directly in its PHP-FPM and APM dashboards:
- Slow database queries: Queries holding workers open longer than expected, starving the pool.
- Memory exhaustion: Workers consuming more RAM than allocated, risking swap or crashes.
- Worker saturation: All workers busy during traffic spikes, causing requests to queue.
- Long-running requests: Scripts that exceed expected duration and block resources.
- External API delays: Third-party calls adding latency that looks like a PHP-FPM problem.
- High CPU utilization: Sustained load that signals under-provisioned infrastructure.
- Slow Redis: Cache layer latency masquerading as application slowness.
- Cache misses: Repeated cold lookups adding unnecessary database load.
- Error spikes: Sudden increases in 5xx responses tied to a specific release.
- PHP exceptions: Uncaught exceptions degrading response times before they surface as outages.
Why Monitoring Matters More Than Configuration?
Configuration is a snapshot decision: you calculate pm.max_children, pick a process manager mode, and set timeouts based on today's traffic and today's code. That snapshot doesn't stay accurate. Traffic grows, a new feature adds a slow query, or a third-party API starts responding slower and none of that shows up by re-reading your php-fpm.conf.
Monitoring closes that gap. It tells you when worker utilization is trending toward saturation weeks before it becomes an outage, and it tells you which specific request, query, or dependency is responsible, not just that "PHP-FPM is slow."
Troubleshooting PHP-FPM with Distributed Tracing
When a request is slow, the PHP-FPM layer alone can't tell you why. Distributed tracing breaks a single request into its component segments, so you can see exactly where time is spent:
- Application bottlenecks in your own PHP code
- Database latency from a specific query
- Third-party API calls adding unexpected delay
- Infrastructure issues like network or disk I/O
- PHP code hotspots that repeat across many requests
Atatus attaches a trace to every request, giving you a waterfall view of exactly where the milliseconds went, instead of guessing which config value to change next.
Atatus PHP-FPM Monitoring
Atatus PHP-FPM Monitoring delivers deep visibility into your PHP FastCGI Process Manager performance, helping you run high-traffic PHP applications without slowdowns or instability.
Unified Visibility for Faster Troubleshooting
Centralize your PHP-FPM logs, metrics, and traces into a single view. Spot anomalies instantly and correlate performance issues across your stack before they impact users.
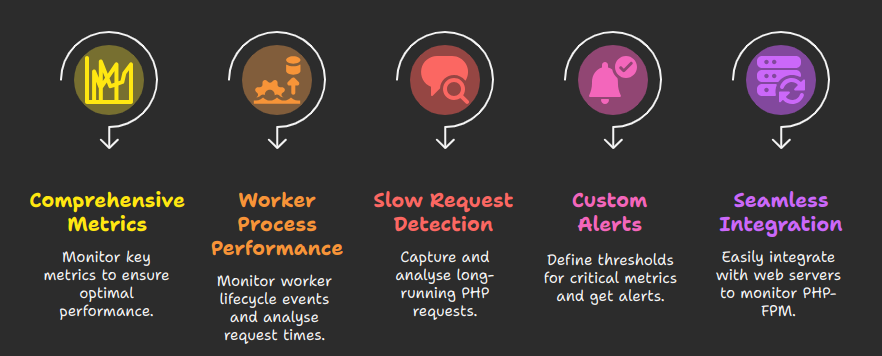
Key Features of Atatus PHP-FPM Monitoring
- Comprehensive PHP-FPM Metrics: Monitor key metrics like process utilization, request rates, idle processes, and memory usage to ensure your PHP FPM pools are performing optimally.
- Worker Process Performance: Monitor individual worker lifecycle events, from spawning to termination, and analyse request handling times to identify underperforming processes.
- Slow Request Detection: Capture and analyse long-running PHP requests with detailed slow log insights. Pinpoint the exact script, function, or query causing delays and optimise for faster execution.
- Custom Alerts & Notifications: Define thresholds for critical metrics like high memory usage, excessive queue time, or idle worker drops. Get instant alerts via email, Slack, or other integrations when limits are breached.
- Seamless Web Server Integration: Easily integrate with NGINX, Apache, and Lighttpd to monitor PHP-FPM alongside your web server. Identify request routing issues, handoff delays, or FastCGI misconfigurations in real time.
Frequently Asked Questions
1) Why Choose Atatus for PHP-FPM Monitoring?
Atatus shows you what is happening and why. From traffic surges to slowdowns, you get the data and context to fine-tune PHP-FPM settings and deliver the fast, stable experience your users expect.
2) What causes PHP-FPM bottlenecks?
Worker saturation during spikes, slow database queries, slow third-party API calls, insufficient RAM for the worker count, and memory leaks are the most common causes. Tracing shows which one applies to a given slow request.
3) How many PHP-FPM workers should I use?
Divide the RAM allocated to PHP by the average memory per process, then set pm.max_children slightly below that as a safety margin; for example, 75 workers for 4096 MB of RAM at roughly 50 MB per process.
4) How do I monitor PHP-FPM?
Track active versus idle workers, queue length, memory per process, slow-request logs, and error rates. A dedicated tool like Atatus centralizes these alongside traces and logs in one dashboard.
5) What is the best PHP monitoring tool?
It depends on your stack, but for PHP-FPM specifically, Atatus offers pool-level metrics, distributed tracing, slow-request detection, and unified logs and traces in one place.
6) What is the difference between PHP-FPM tuning and monitoring?
Tuning sets configuration values appropriate for expected traffic. Monitoring observes real, changing traffic and flags when those values stop being sufficient, the two work together rather than replacing each other.
7) What are some best practices for using PHP-FPM?
Use the latest stable PHP-FPM version, configure separate pools per application, use Unix sockets for web server communication, monitor resources and adjust pm.max_children regularly, and prefer dynamic mode for variable traffic.
Next Step!
Why struggle with slow servers or switch between too many tools? With Atatus, you keep PHP-FPM running smoothly and see everything you need in one place. Find problems early, fix them fast, and handle busy traffic without stress.
Don't let default settings slow you down
See real-time request traces, CPU usage, memory consumption, and transaction bottlenecks with Atatus.
#1 Solution for Logs, Traces & Metrics
 APM
APM
Kubernetes
Logs
Synthetics
RUM
Serverless
Security
More