Beyond observability to mastery
Scalable insights for every team
Transform observations into breakthrough outcomes.
No credit card required. Set up in 2 minutes.
1,500+ innovative DevOps and engineering teams propel success with Atatus
APM
RUM
Infra
Log
Serverless
Uptime
Database
Vulnerability
API Analytics
Kubernetes
Application Performance Monitoring (APM)
Monitor application performance across every service, request, and dependency with deep visibility and zero blind spots.
- Analyze request and endpoint performance at scale
- Trace issues across microservices and backend systems
- Profile database queries and external calls
- Detect errors with full stack trace context
- Supports Node.js, PHP, Java, Python, Ruby, .NET
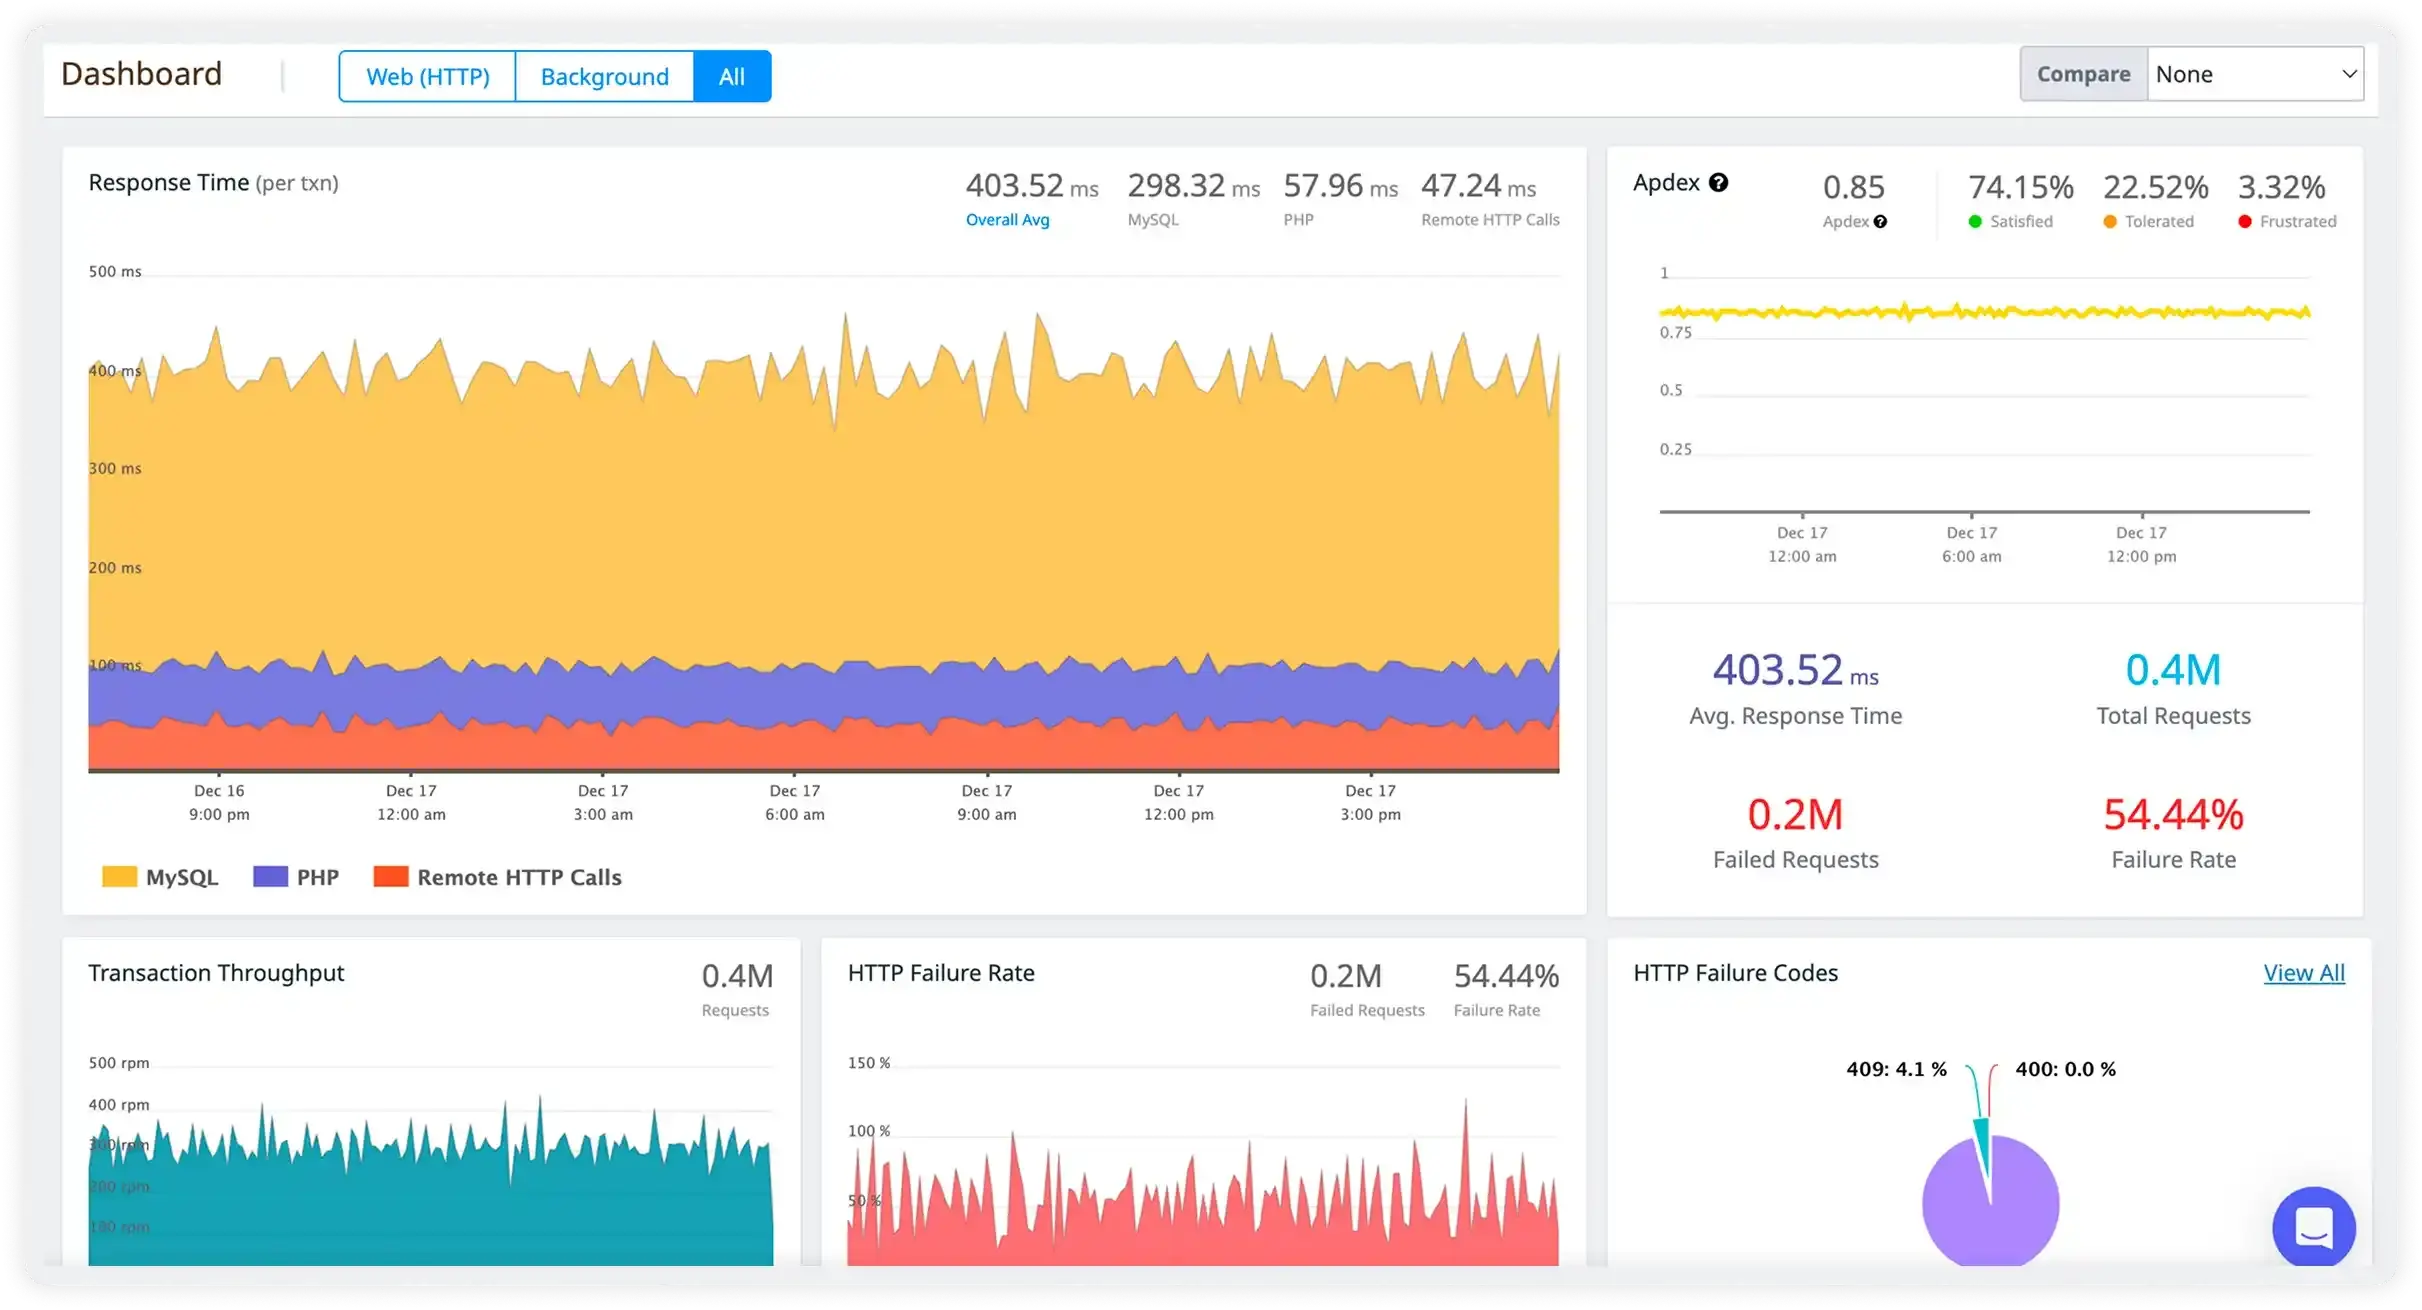

Application Performance Monitoring (APM)
Monitor application performance across every service, request, and dependency with deep visibility and zero blind spots.
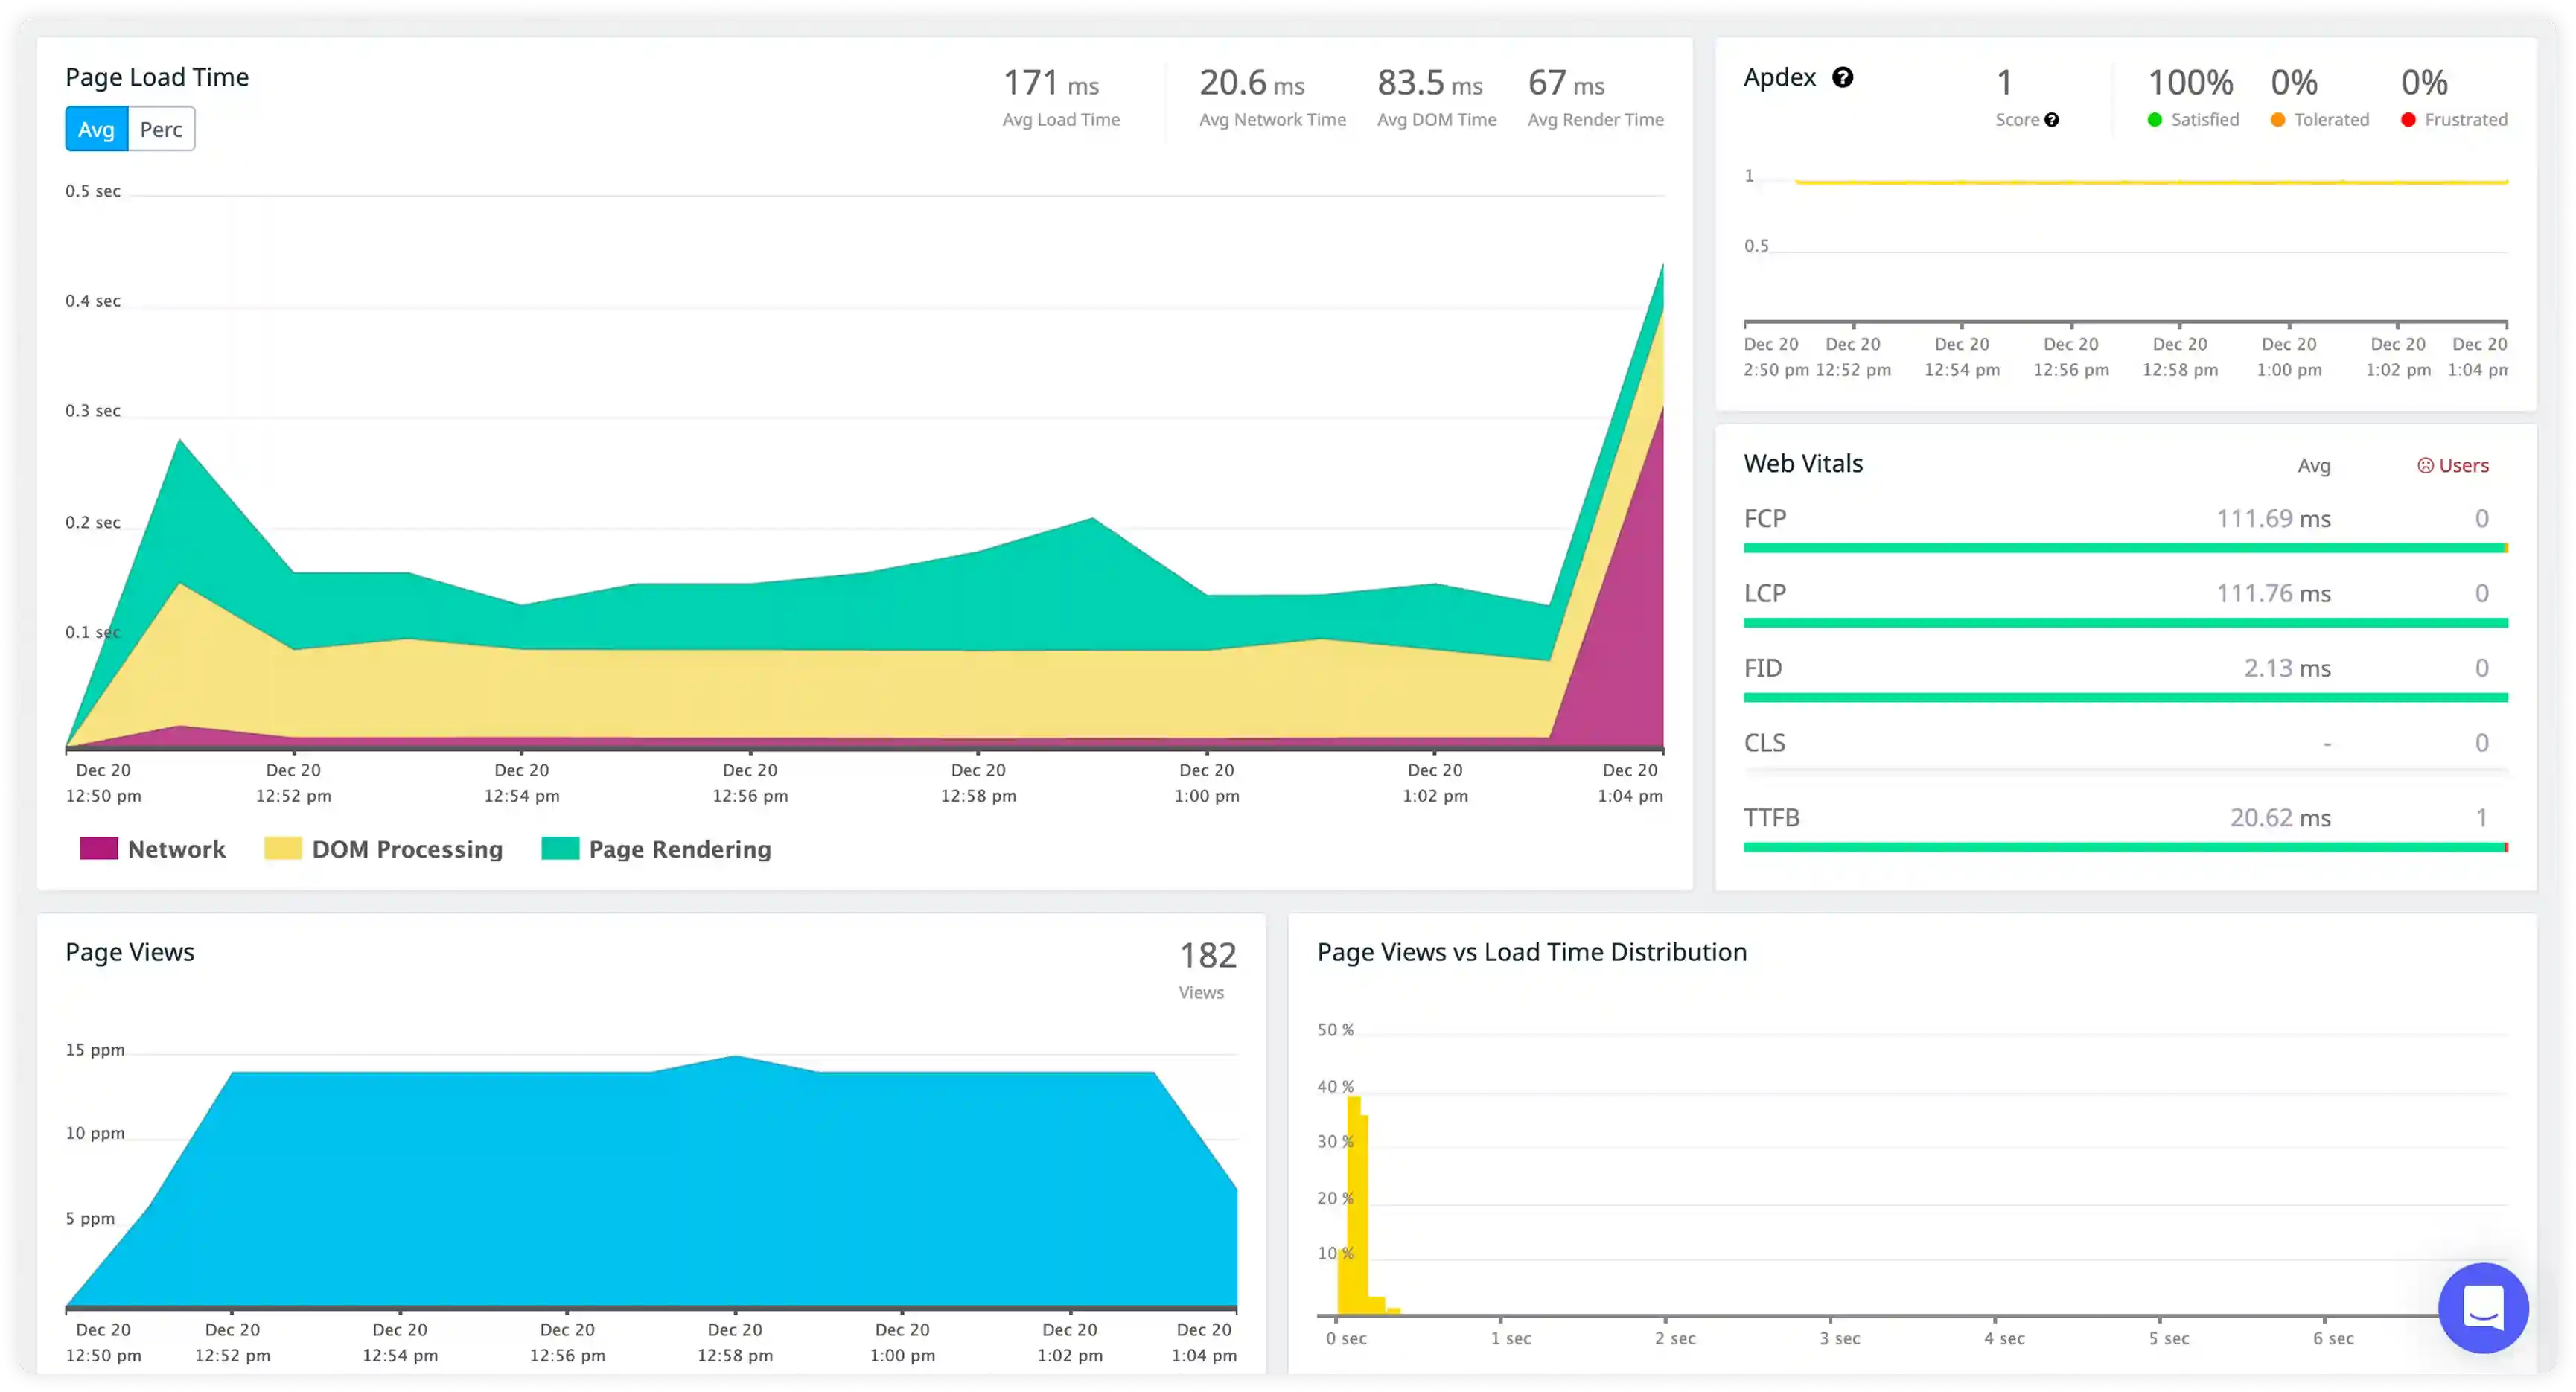
Real User Monitoring (RUM)
Measure and improve real user experience across browsers, devices, and regions.
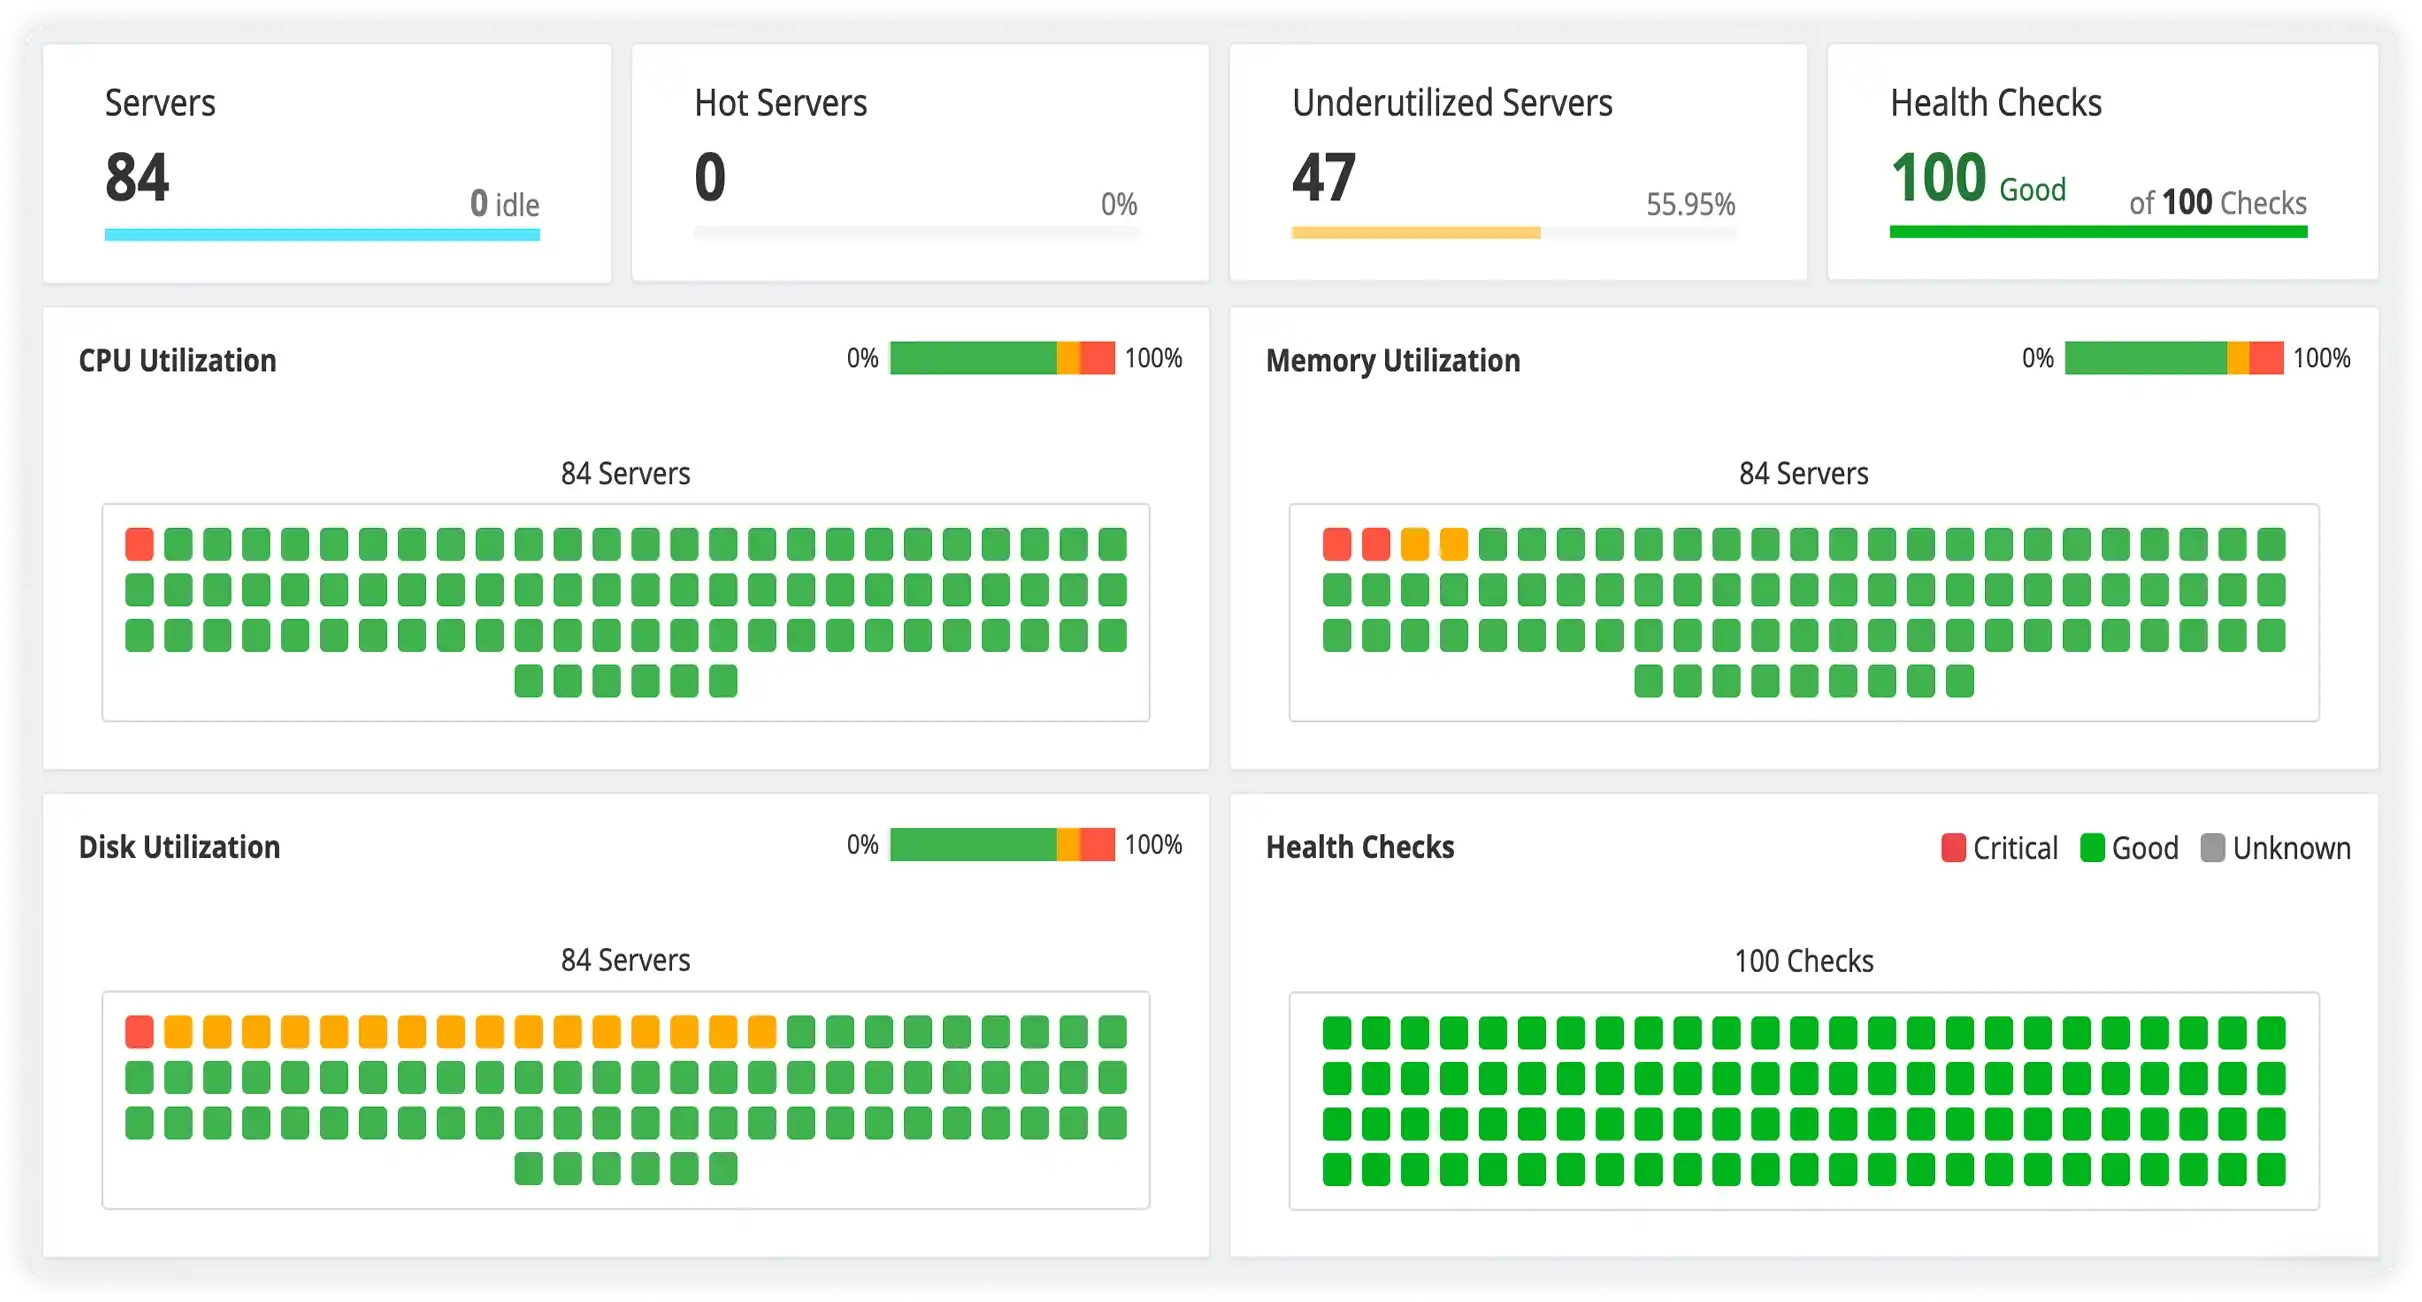
Infrastructure Monitoring
Continuously observe your servers, containers, and hosts to identify performance issues before they disrupt applications.
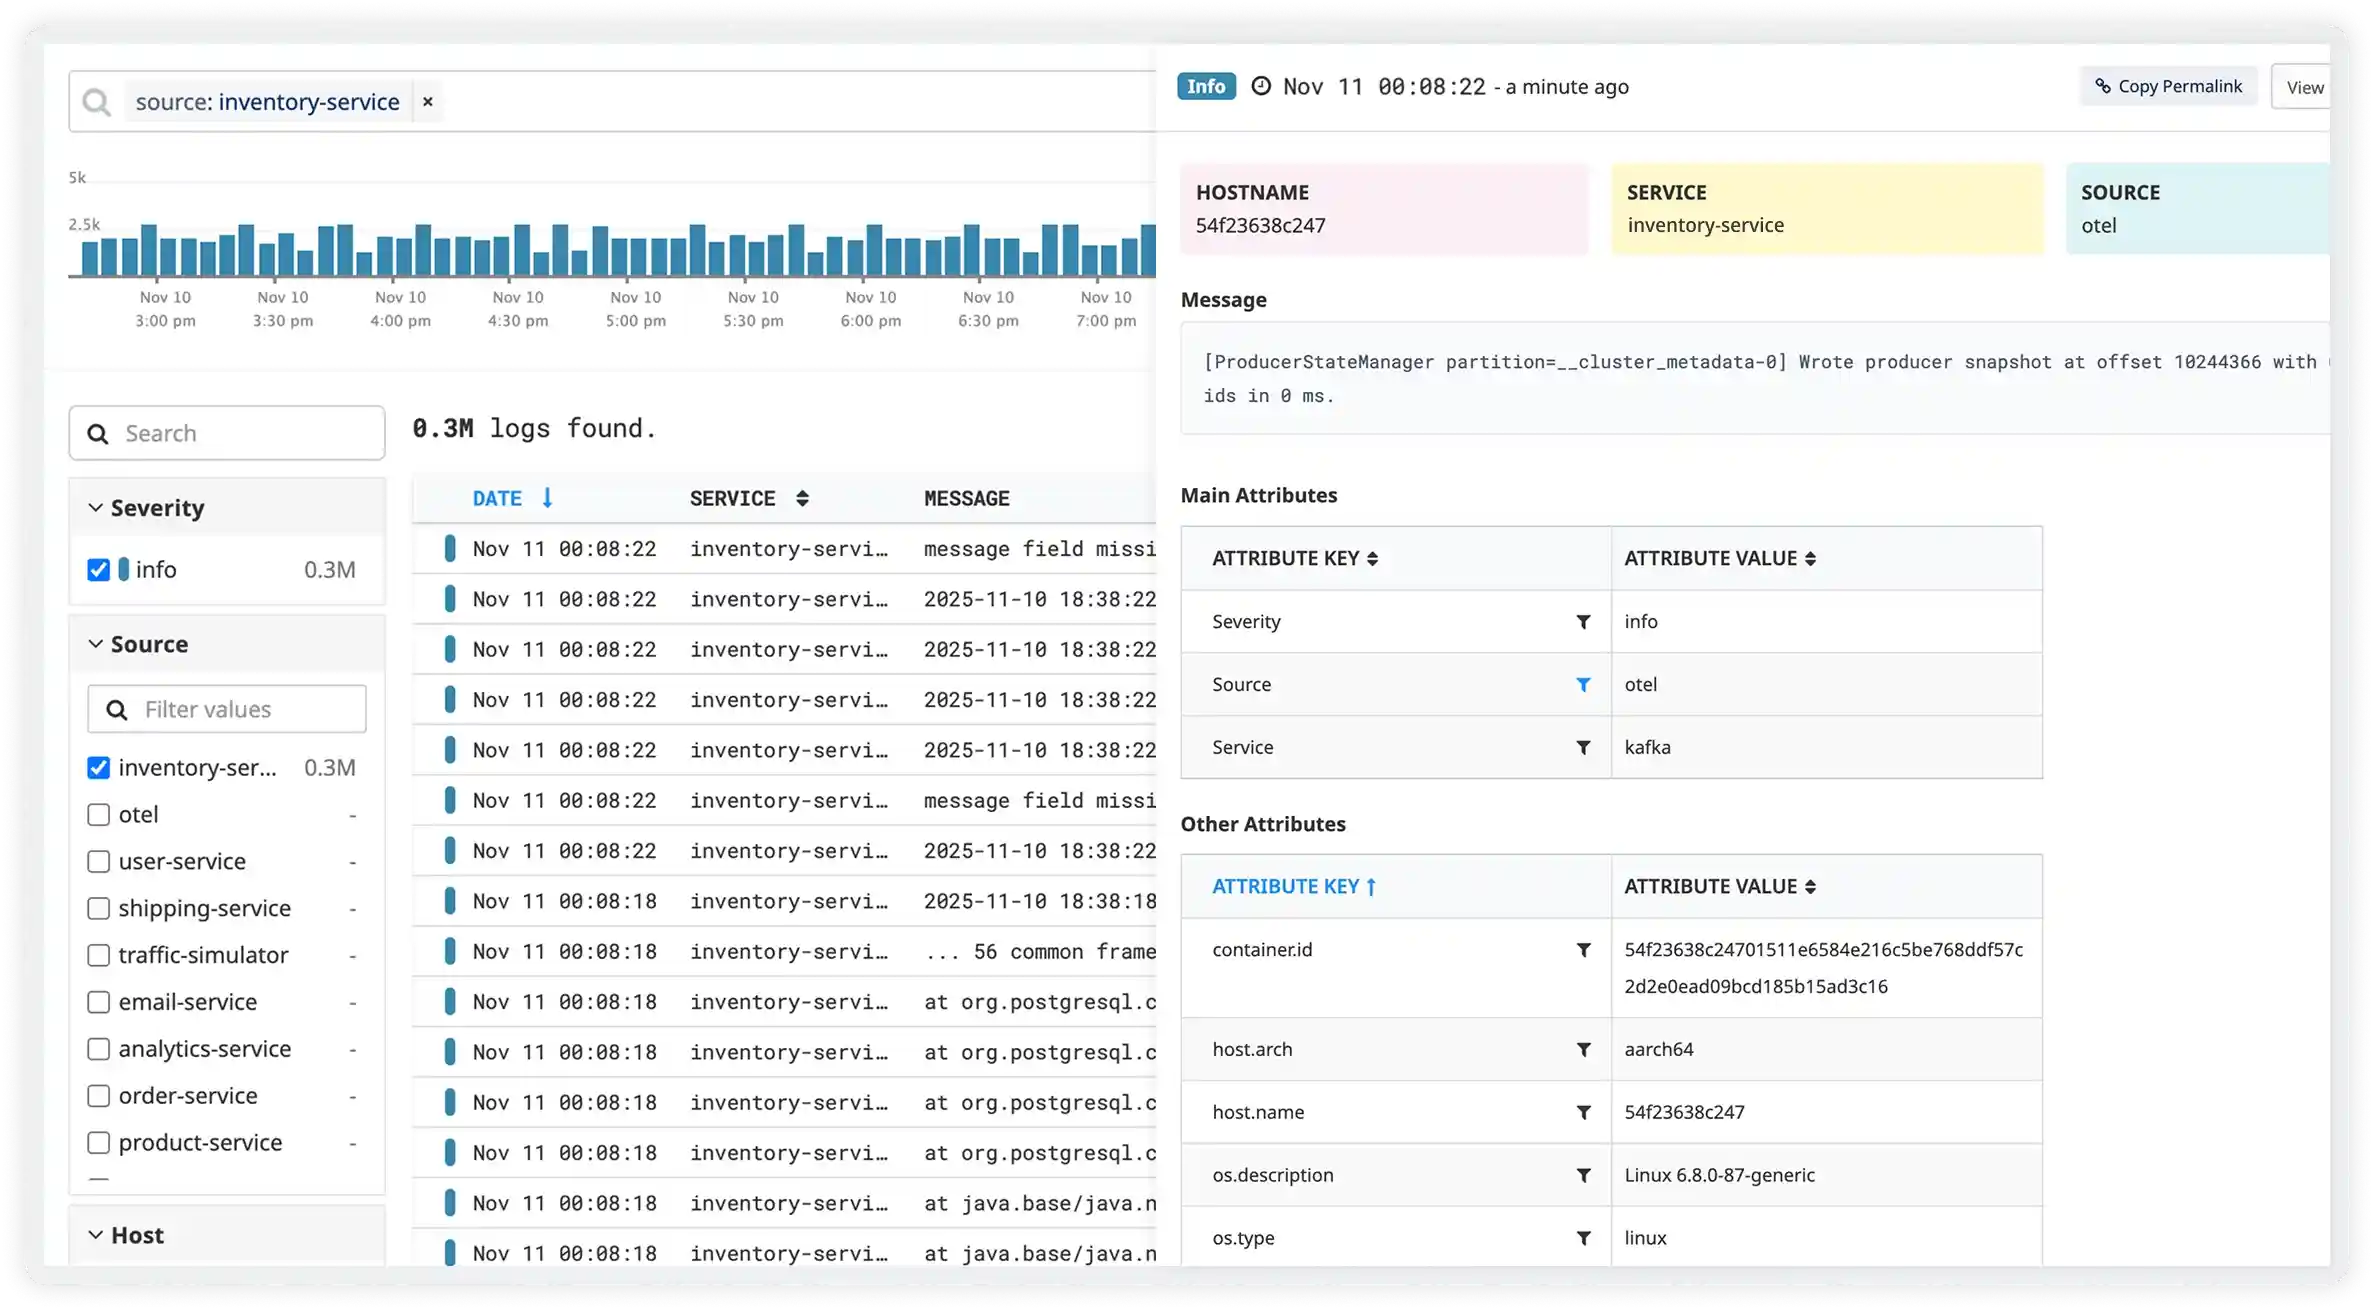
Log Management
Collect and analyze structured and unstructured logs across systems to uncover issues and reduce resolution time.
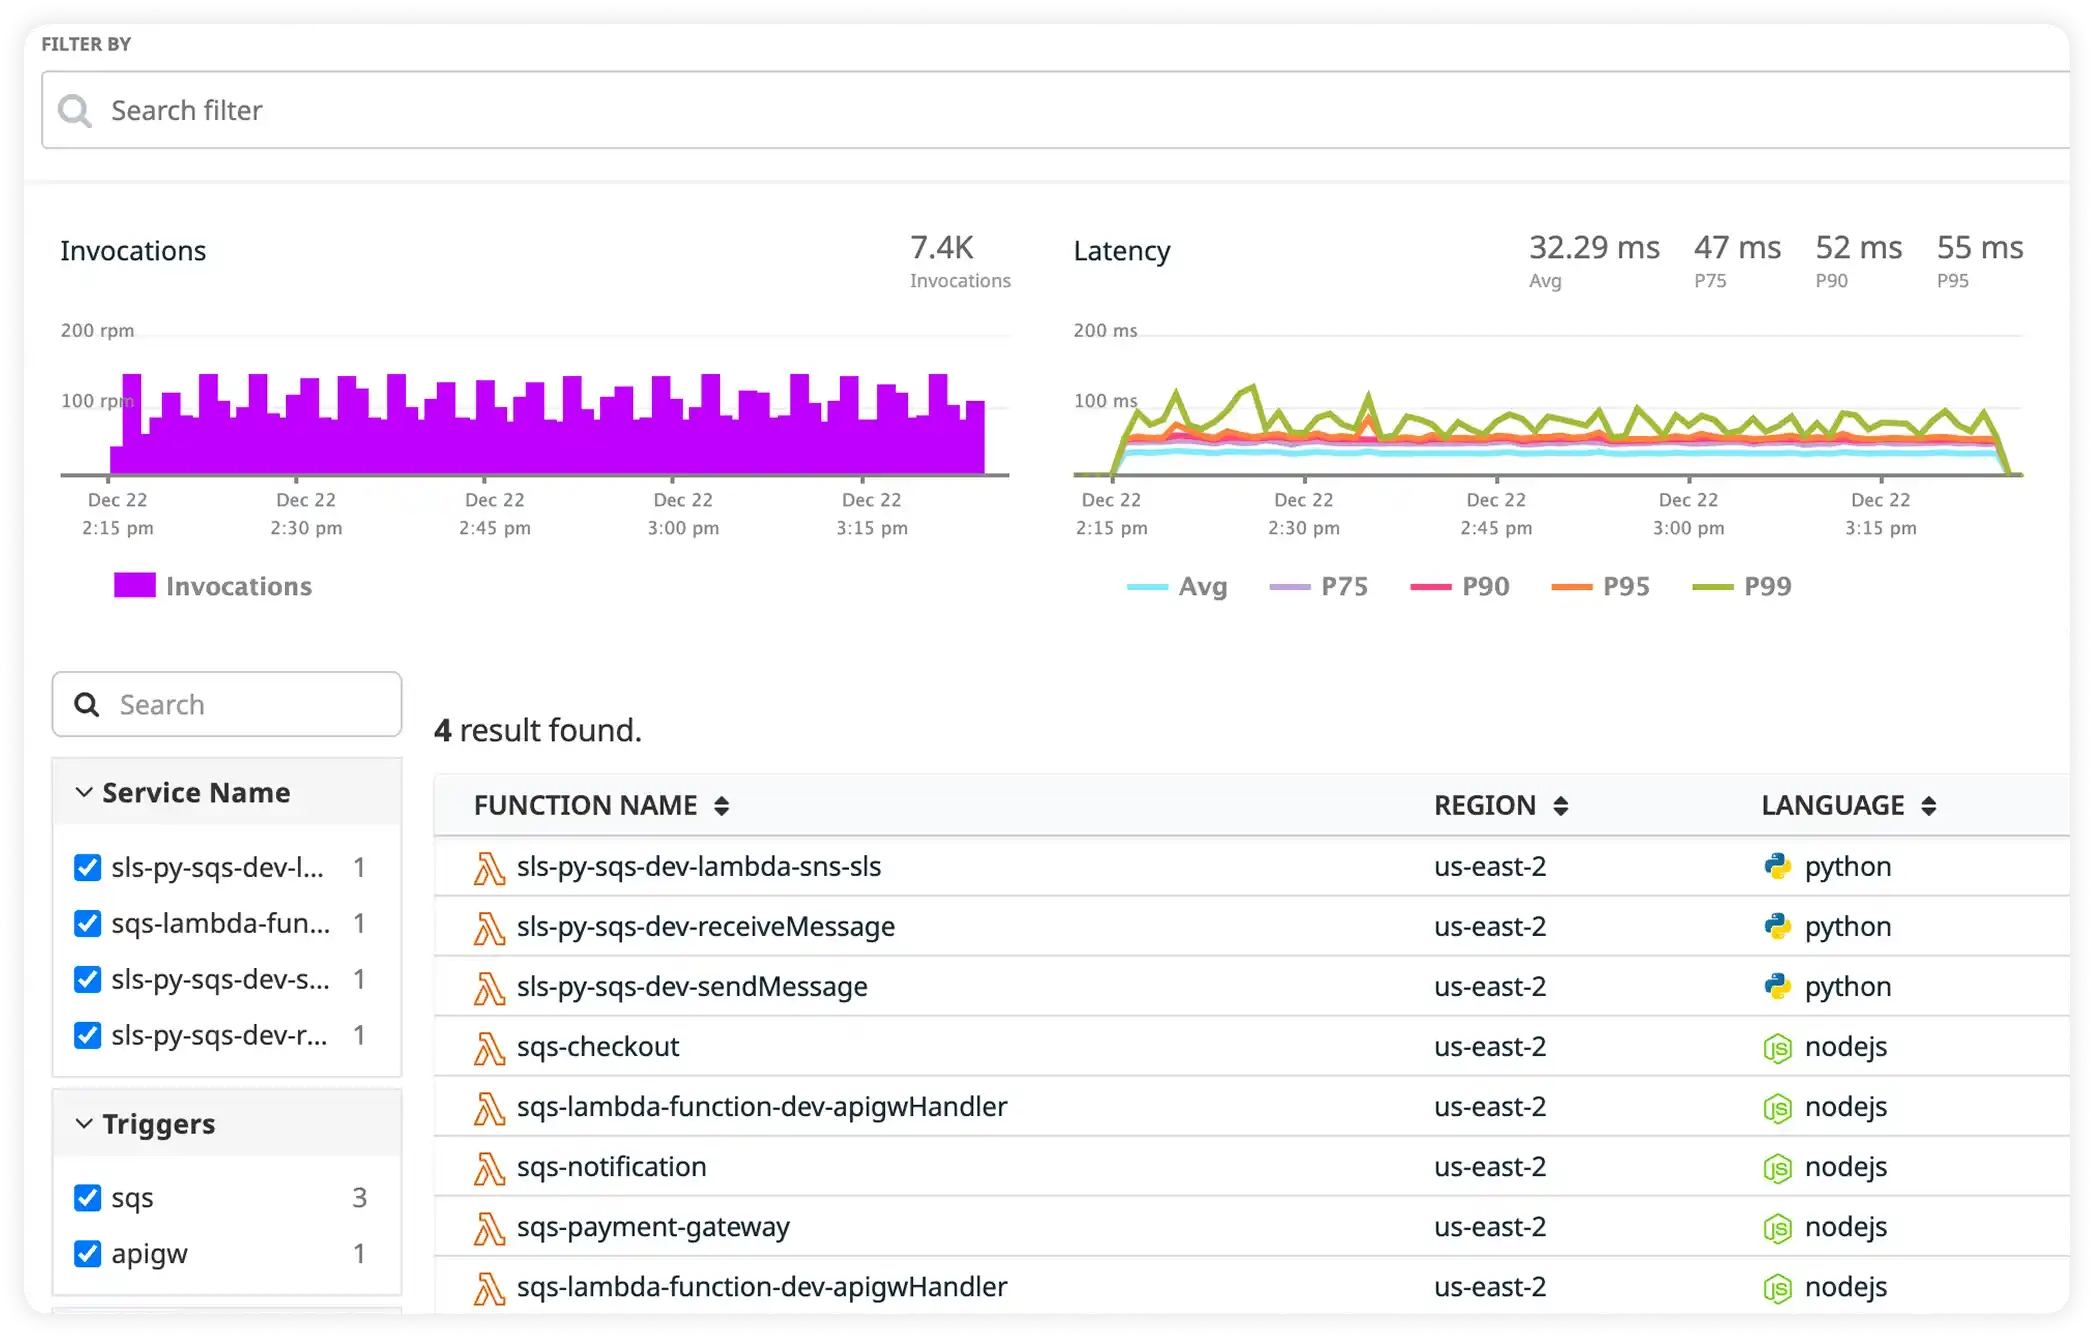
Serverless Monitoring
Diagnose performance issues in serverless workloads by examining execution behavior, failures, and latency at scale.
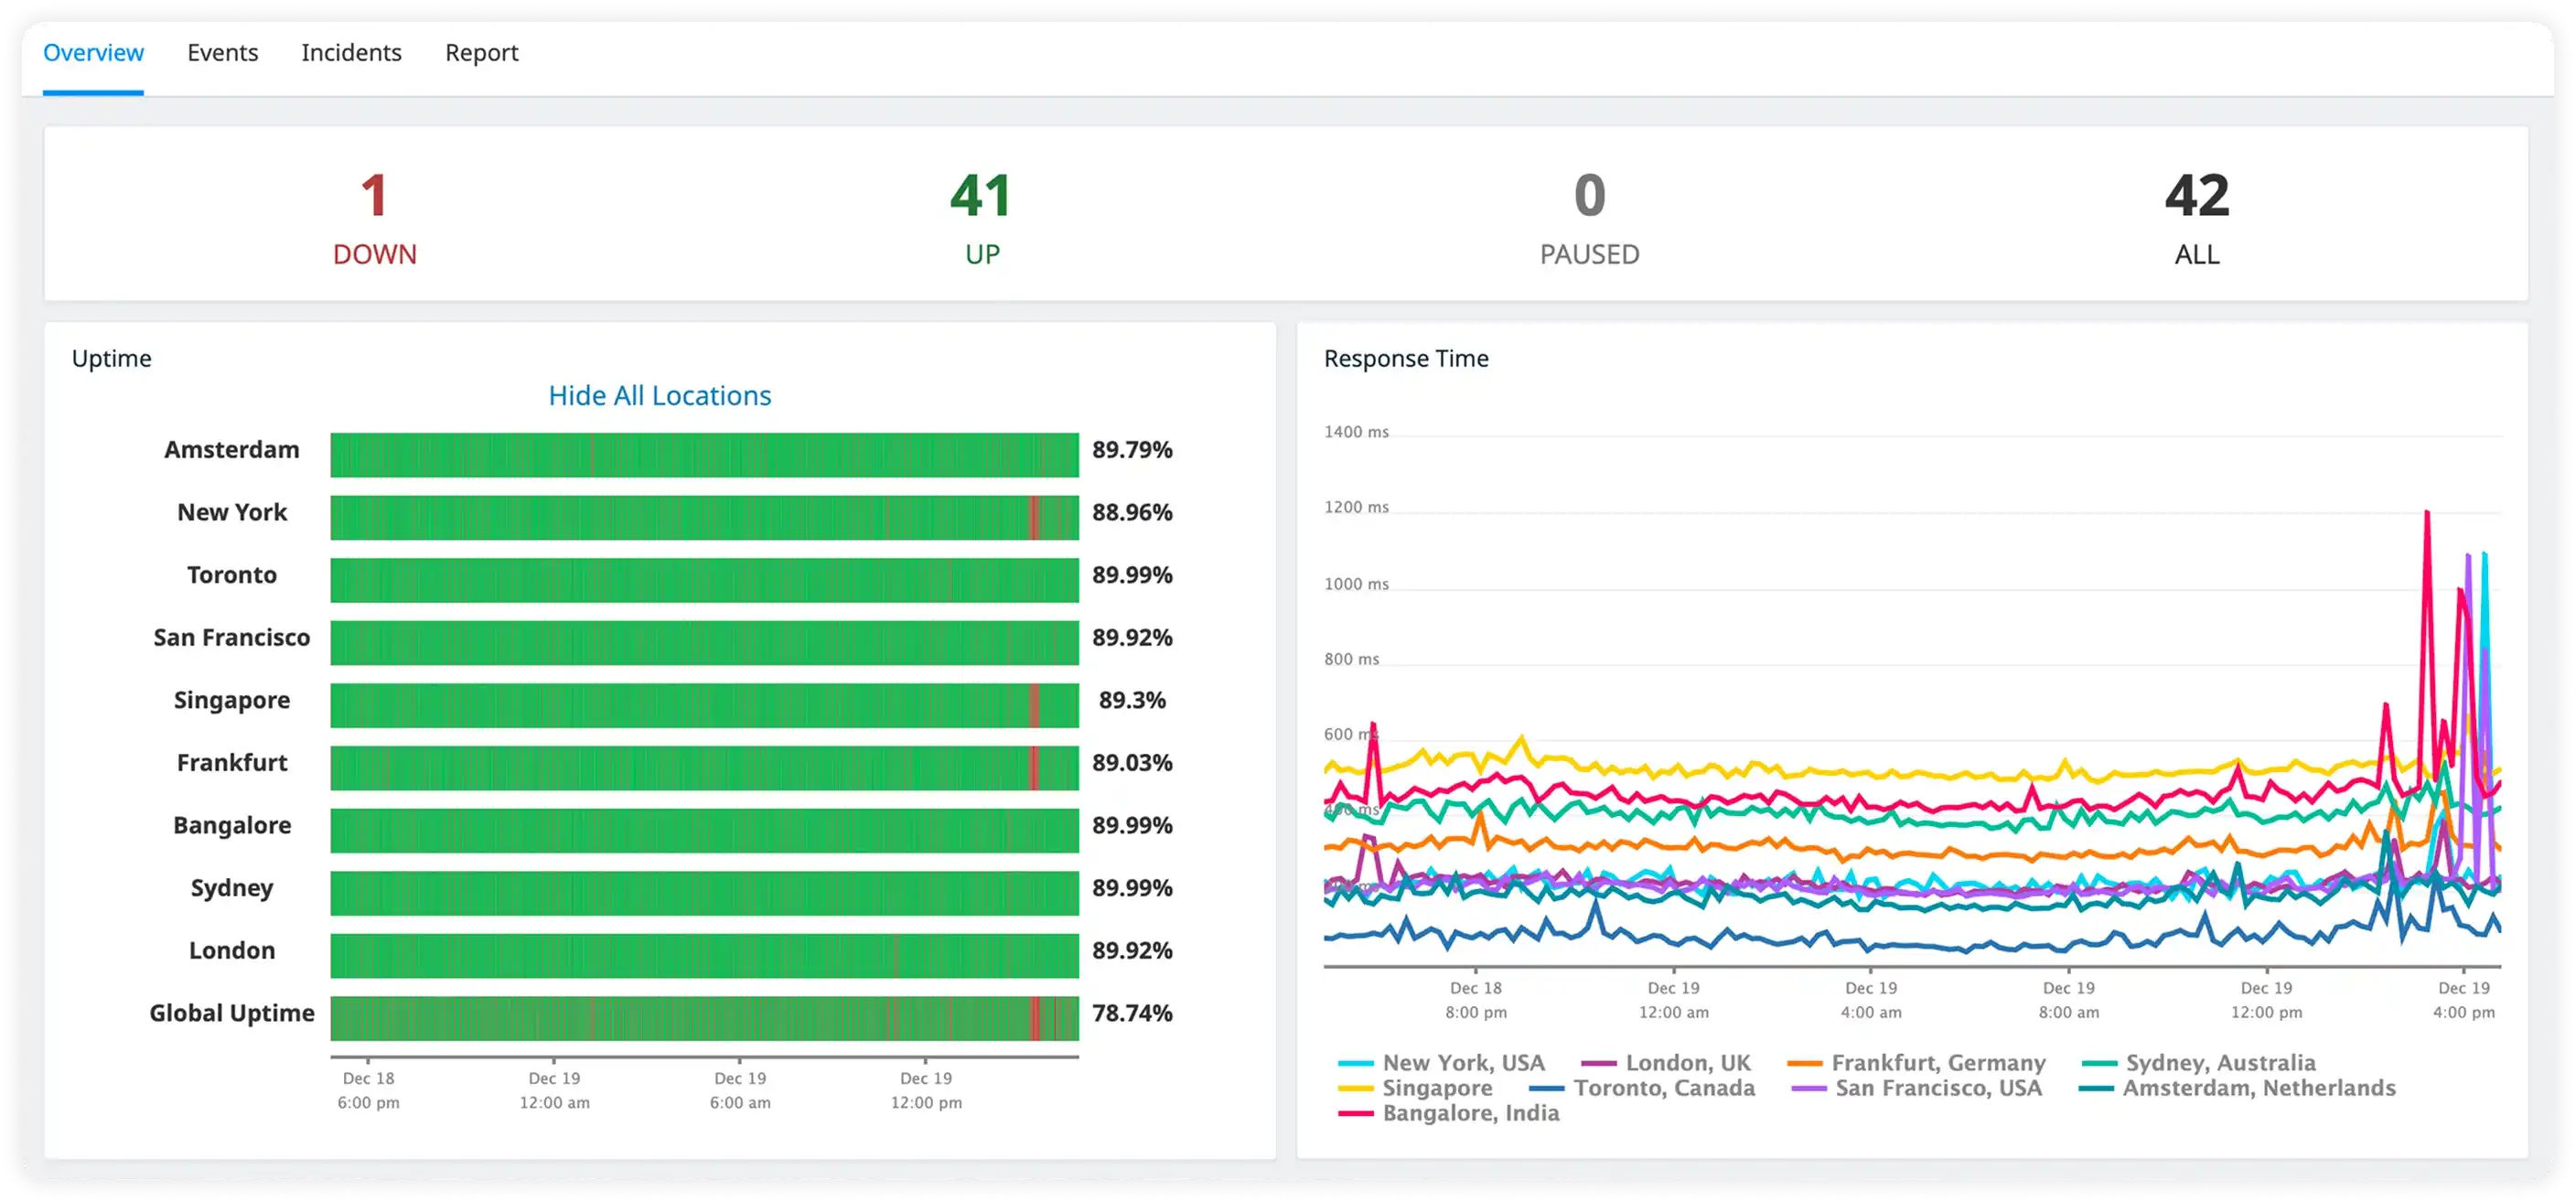
Uptime (Synthetic) Monitoring
Detect outages and response issues across services, domains, and APIs to maintain user trust and SLA performance.
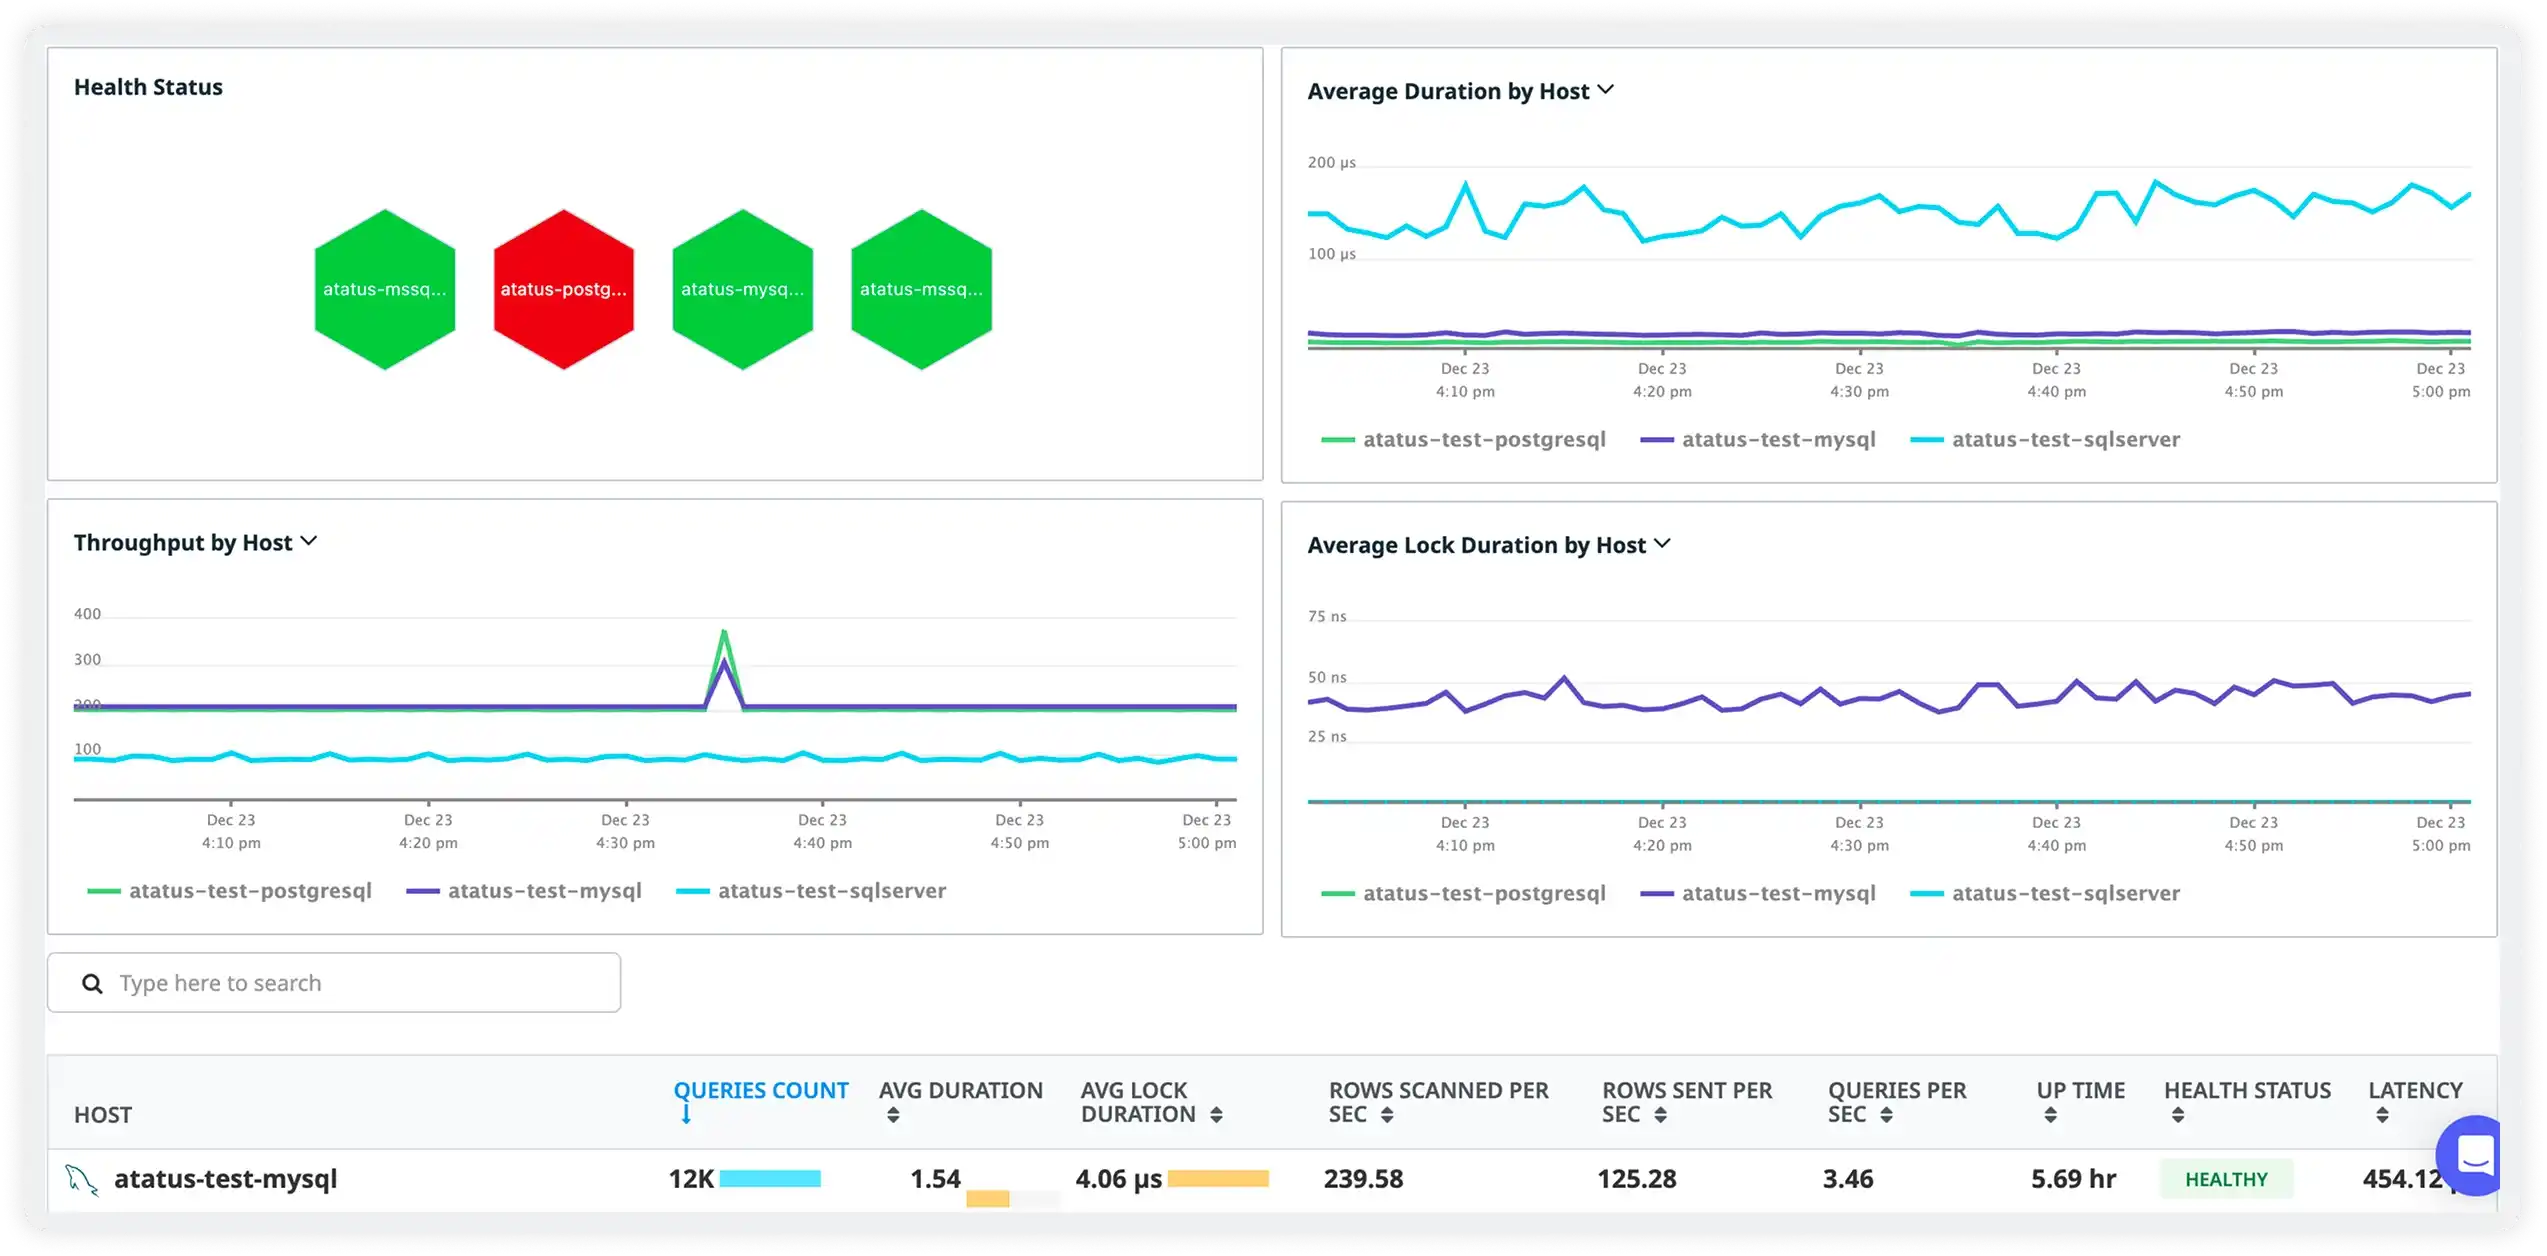
Database Monitoring
Identify query slowdowns, resource bottlenecks, and error spikes to provide reliable and efficient database operations.
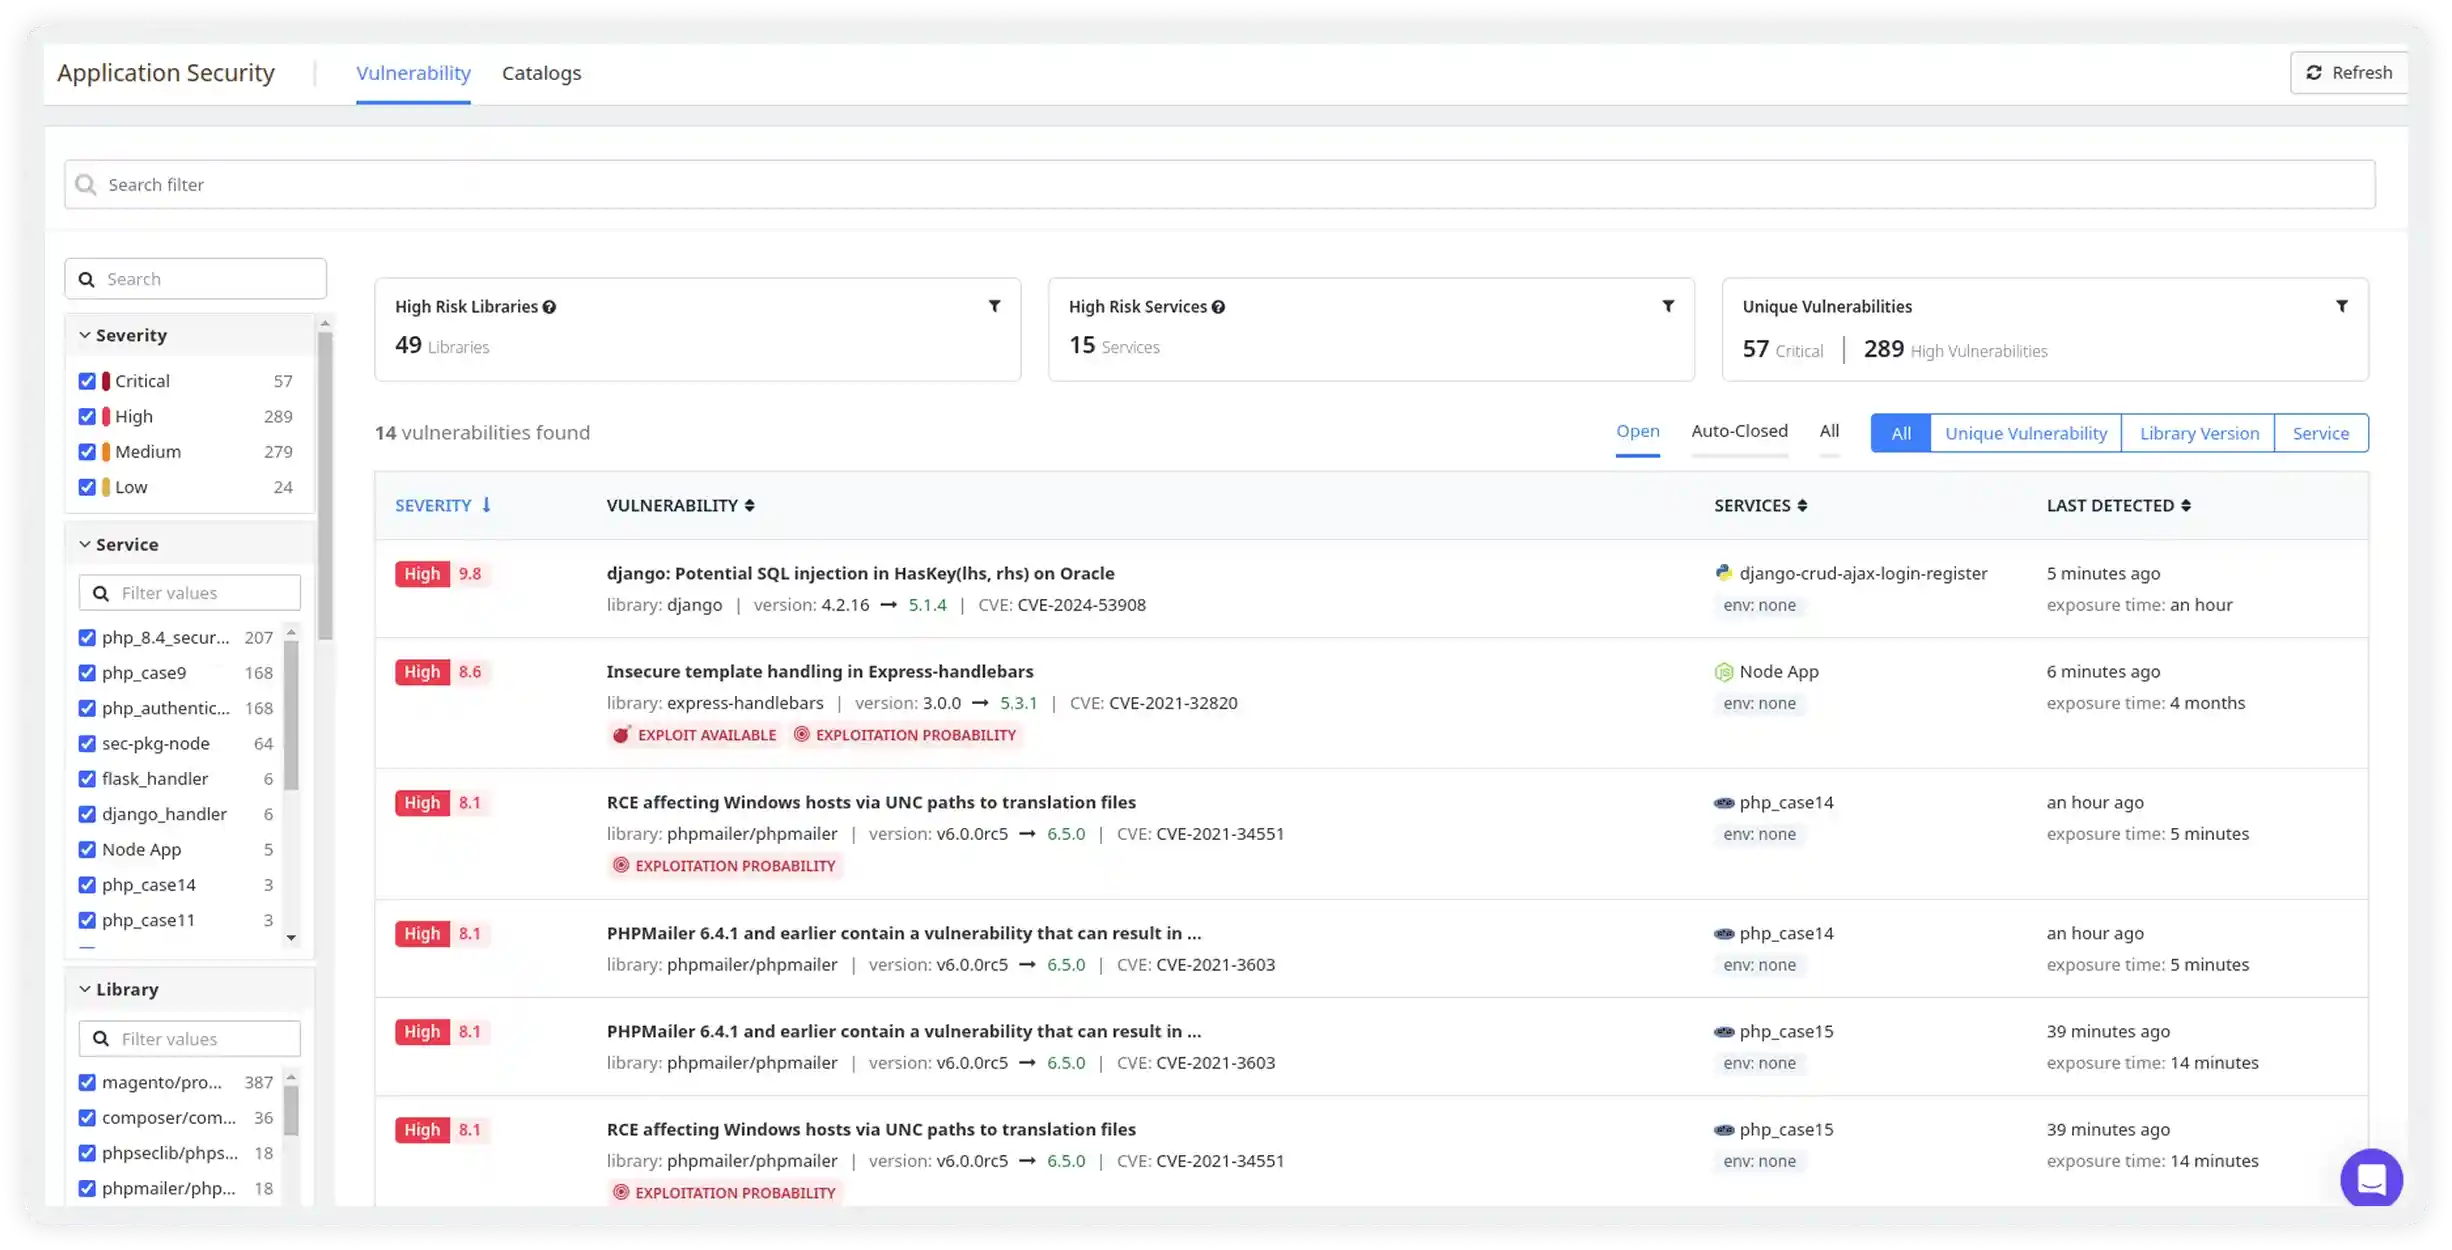
Vulnerability Management
Expose weaknesses in application code, dependencies, and configurations before they become entry points for attacks.
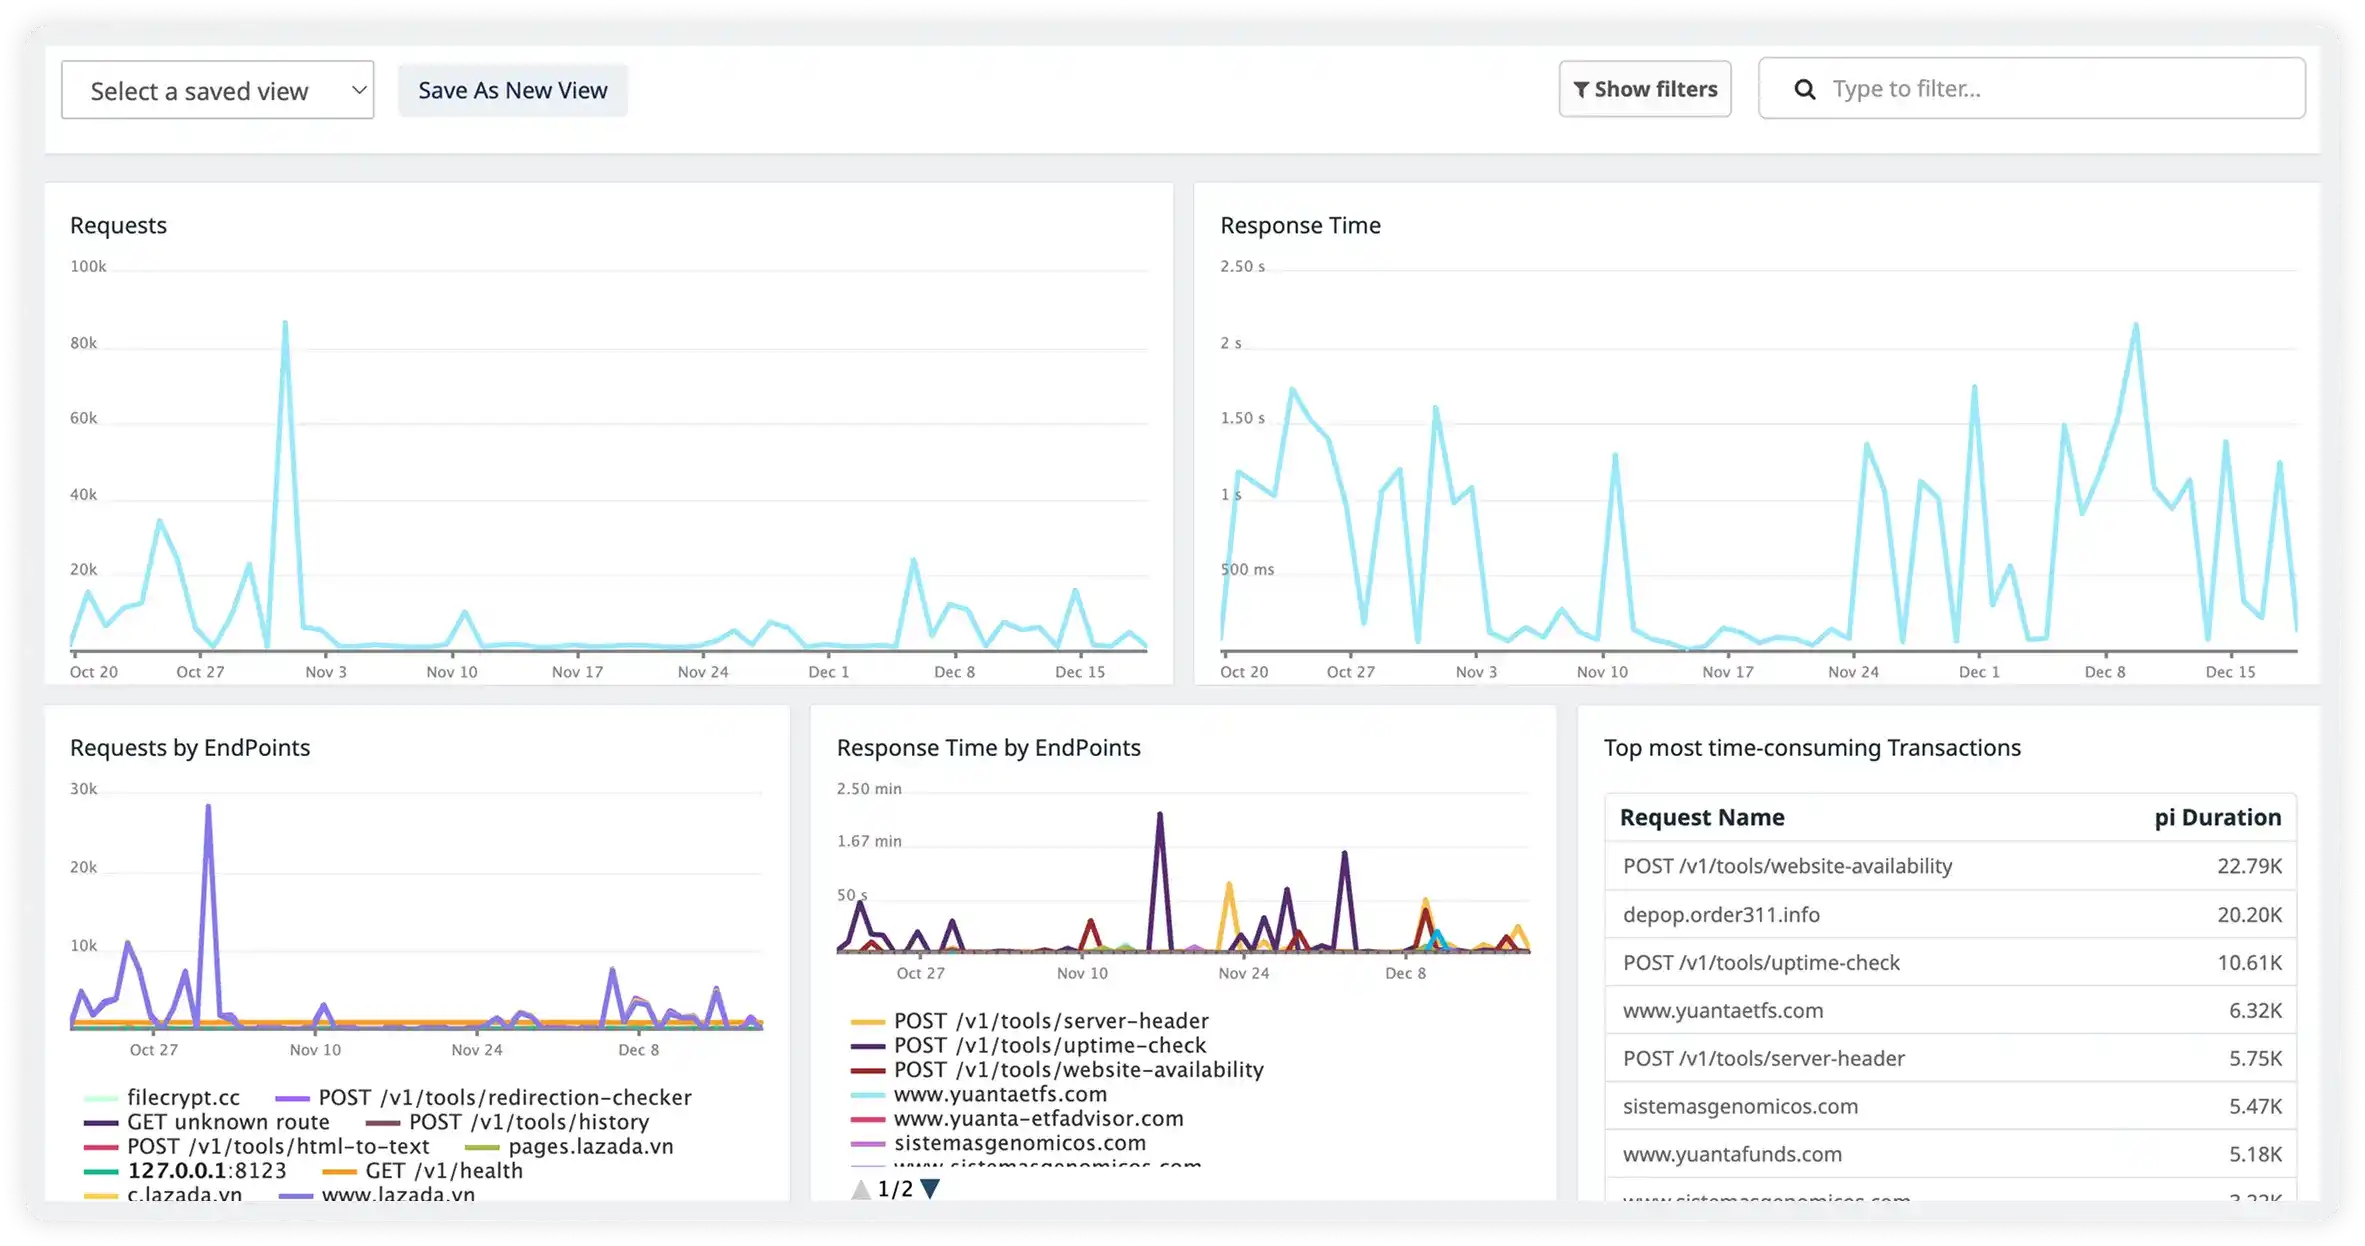
API Analytics
Reveal how APIs behave under load, how consumers interact with them, and where issues affect reliability or speed.
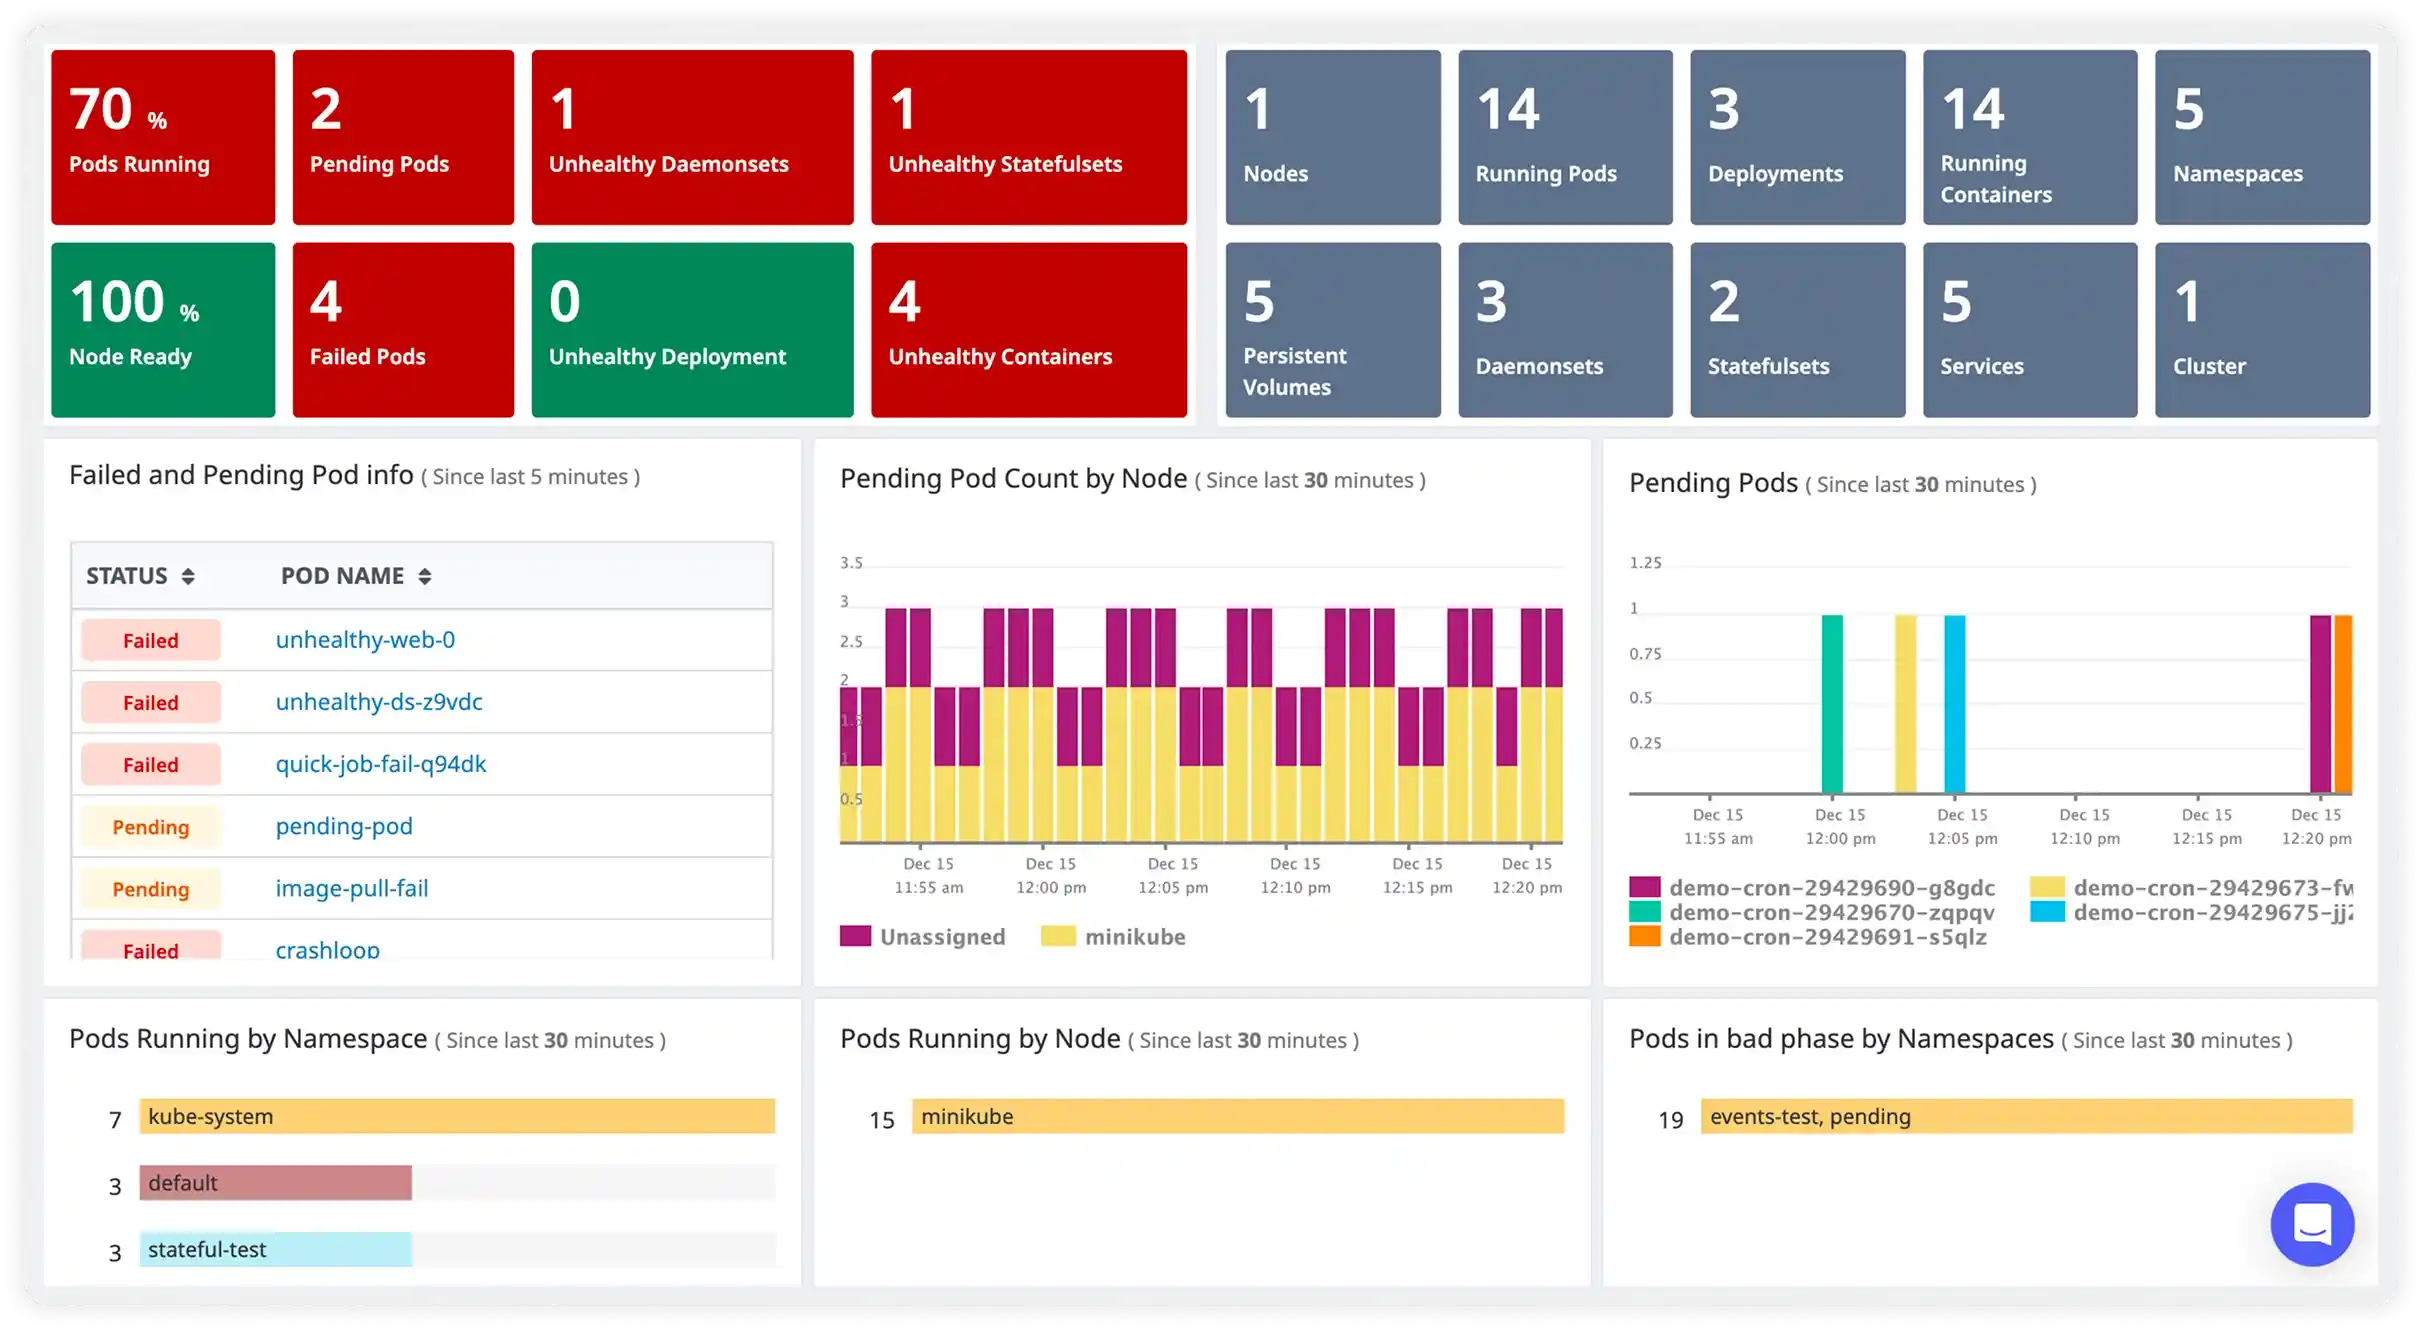
Kubernetes Monitoring
Ensure containerized workloads run reliably by analyzing node performance, pod health, and resource allocation across your clusters.
Infuse brilliance into your stack with Atatus
200+ versatile technologies, frameworks & integrations engineered for frictionless synergy and peak performance.
Measured Results Engineering Teams Care About
40%
Faster incident response
70%
Minimizing downtime
30%
Faster root cause detection
5x
Deployment stability
Existing Platforms
Complex Pricing Models
User-based or data-based pricing that scales unpredictably. Hidden fees, overage charges, and complex billing structures make budgeting difficult.
Difficult Setup & Configuration
Complex deployment processes requiring extensive infrastructure knowledge. Long onboarding times with steep learning curves for teams.
Limited Support Options
Support often restricted to higher-tier plans or business hours. Slow response times during critical production incidents.
Atatus Advantages
Save up to 4x on Cost
Transparent, host-based pricing with no hidden fees or overage charges. Predictable costs that scale with your infrastructure, not your team size.
Lightning-Fast Setup
Deploy monitoring in minutes with simple, straightforward setup. Intuitive dashboards and automated instrumentation get you insights immediately.
24/7 Premium Support
Free 24/7 support included with all plans. Quick response times and dedicated assistance during critical incidents.
Minimal Overhead
Lightweight agents with negligible performance impact. Lower infrastructure requirements reduce operational costs.
Enterprise Security
Data encryption in transit and at rest. SOC 2, GDPR, and ISO 27001 compliant. Enterprise-grade security for all customers.
All-in-One Platform
Full-stack observability in a single platform. No need to stitch together multiple tools or vendors.
Atatus Wins
G2 Honors


Milestones that spark performance excellence
Reflections from clients who've achieved unmatched excellence through innovative strategies.
Read customer stories


