
Root Cause Analysis: How Engineering Teams Fix Production Issues Faster?
When a production incident strikes, a sudden latency spike, a cascading API failure, a service returning 500s at scale, every minute of downtime has a cost. Root cause analysis (RCA) is the process that turns that chaos into a clear answer: what actually broke, and why. Not the symptom that triggered the alert. The underlying cause.
In modern distributed systems, RCA is harder than ever. Services are interconnected, deployments happen continuously, and a single slow database query can silently degrade a dozen downstream services before anyone notices. Platforms like Atatus give engineering teams the distributed tracing, error tracking, and real-time monitoring they need to cut through the noise and reach the root cause faster, without hunting through fragmented logs across five different tools.
This guide covers everything: what RCA is, why it's difficult in distributed architectures, a step-by-step investigation workflow, the metrics that matter, and the observability practices that consistently reduce mean time to resolution (MTTR).
Table of Contents
- What Is Root Cause Analysis (RCA)?
- Why Root Cause Analysis Is Difficult in Modern Distributed Systems?
- Common Causes of Production Incidents
- Step-by-Step Root Cause Analysis Process
- How Distributed Tracing Improves Root Cause Analysis?
- Key Metrics to Monitor During Root Cause Analysis
- Best Practices for Faster Root Cause Analysis
- How Atatus Helps Teams Identify Root Causes Faster?
What Is Root Cause Analysis (RCA)?
Root cause analysis is a structured method for identifying the fundamental cause of a system failure or performance degradation, not just the visible symptom.
| Observable Symptom | Probable Root Cause |
|---|---|
| API response times exceed 3s | Slow N+1 query in the database layer |
| Users seeing intermittent 502 errors | Memory leak causing pod restarts in Kubernetes |
| Frontend JavaScript errors spiking | Third-party CDN timeout cascading upstream |
| Payment service failures | Connection pool exhaustion under load |
| Increased error rate after deployment | Unhandled exception in new code path |
The symptom is what monitoring alerts on. The root cause is what you fix so it doesn't happen again.
In software development, RCA is applied to:
- Production outages - services becoming unavailable
- Performance degradations - latency regressions, throughput drops
- Error rate spikes - exceptions, failed requests, broken integrations
- Data integrity issues - inconsistent writes, race conditions
- Reliability regressions - SLO/SLA breaches
A proper RCA doesn't end with a fix. It ends with a documented understanding of the failure mechanism, so the same issue doesn't recur and similar patterns can be detected earlier.
Why Root Cause Analysis Is Difficult in Modern Distributed Systems?
In a monolithic application, debugging was painful but linear. You had one codebase, one log file, one deployment to blame. In modern distributed architectures, that linearity is gone.
- Microservices complexity: A single user-facing request may traverse 10–20 services before returning a response. Each service has its own deployment cadence, its own failure modes, and its own observability configuration (or lack of it). A failure in any one of them can manifest as a vague error downstream.
- Containerized and ephemeral infrastructure: Kubernetes pods restart and reschedule. Containers are short-lived. The service that caused a spike may no longer exist by the time someone starts investigating. Traditional host-level logging becomes meaningless when the host is a container that terminated two minutes ago.
- Asynchronous processing and event-driven systems: Message queues, event streams, and async workers decouple services in ways that make causal chains invisible. A queue backlog caused by a downstream consumer failure may not surface as an error at all, just a slow degradation that's hard to trace back to its origin.
- Fragmented observability: Many teams operate with logs in one tool, metrics in another, traces nowhere, and error tracking bolted on separately. During an incident, engineers are tab-switching between systems, manually correlating timestamps, and reconstructing timelines from incomplete data.
- Alert fatigue: Poorly tuned monitoring produces hundreds of alerts for a single incident. Teams learn to ignore noise. By the time a genuinely critical alert fires, it's competing with dozens of false positives for attention.
- Lack of end-to-end visibility: Without distributed tracing, you can see that a service is slow, but not why. You can see an error, but not which upstream call triggered it. End-to-end visibility across the full request lifecycle from the user's browser to the database and back is the single biggest gap between teams that resolve incidents in minutes and teams that take hours.
Atatus gives you distributed tracing and APM to find root causes faster.
No credit card required · Set up in under 15 minutes
Common Causes of Production Incidents
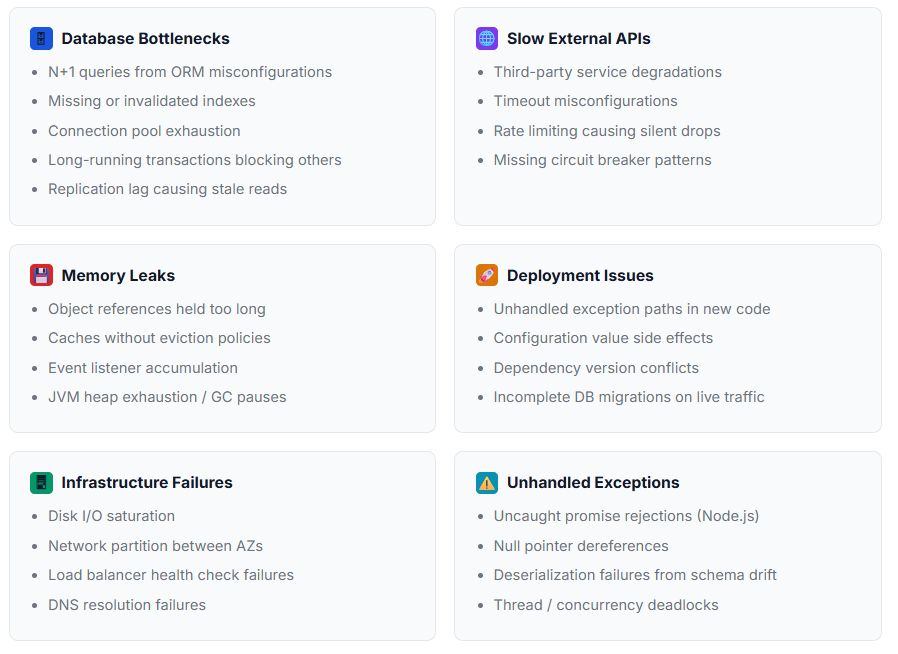
Understanding recurring failure patterns speeds up RCA significantly. These are the causes that account for the majority of production incidents:
Step-by-Step Root Cause Analysis Process
A structured RCA workflow reduces time spent on gut-feel debugging and ensures nothing critical is overlooked. Here's the process engineering teams use to move from alert to resolution systematically.
- Detect the Issue: RCA begins with detection. Ideally this means an automated alert, anomaly detection on error rates, latency thresholds, or Apdex scores, not a customer complaint. Detection should immediately answer: when did the degradation begin, which service or endpoint is affected, and what's the scope. Set up alerts on error rate percentage changes (not absolute counts), p95/p99 latency thresholds, and Apdex drops below your defined baseline.
- Identify Affected Services: Map the blast radius. Which services are degraded? Which are healthy? The service throwing errors is often not the service at fault. Check your service dependency map. If Service A is throwing 503s, it may be because Service B (which A depends on) is responding slowly, causing A's connection pool to exhaust.
- Analyze Traces and Dependencies: This is where distributed tracing becomes indispensable. Pull traces from the incident period. A trace shows the complete lifecycle of a request, every service it touched, every database call, every external API it waited on, and how long each step took.
Look for: spans with unusually high latency, spans that returned errors, cascading timeouts, and missing spans that should exist.
- Correlate Logs, Metrics, and Errors: Traces show you where the problem is. Logs and metrics tell you why. Once you've identified the suspect service from tracing, pull logs from that service during the incident window, check application metrics (CPU, memory, GC pauses, connection pool), and review error tracking for new exception types.
- Isolate the Root Cause: With correlated evidence in hand, form a hypothesis and validate it. Common validation patterns: deployment correlation (did the incident start within minutes of a deploy?), traffic correlation (did it start when traffic reached a specific threshold?), time pattern (does degradation happen at a predictable time?), and single-service isolation (can you reproduce it by calling the suspect service directly?).
- Validate the Fix: Before pushing to production, reproduce the issue in a lower environment if possible, run load tests if the issue was throughput-related, and validate configuration changes in staging. For live incidents where you can't wait, use feature flags or canary deployments to limit blast radius during fix rollout.
- Monitor Post-Resolution Impact: After deploying the fix, watch the key metrics for at least 15-30 minutes: error rate returning to baseline, latency stabilizing, alert recovery, and no secondary incidents. Document everything in a blameless post-mortem such as timeline, root cause, contributing factors, fix applied, and preventive actions.
How Distributed Tracing Improves Root Cause Analysis?
Distributed tracing is the single most impactful capability for reducing RCA time in microservices architectures.
- Request flow visibility: In a distributed system without tracing, a slow API response is an opaque black box. With tracing, you see every service the request passed through, with timing data for each operation. You can immediately identify which service added 2 seconds of latency to a request that should complete in 200ms.
- Service dependency mapping: Traces automatically reveal the actual dependency graph of your system, not the one in your architecture diagram that's six months out of date. When a new service dependency is introduced, it shows up in traces. When a dependency fails, you can see exactly which downstream calls are affected.
- Latency analysis at the span level: Tracing surfaces latency at the granularity of individual operations: a specific SQL query, a specific external API call, a specific internal function. This is incomparably more actionable than a service-level "p95 latency increased by 400ms."
- Transaction-level debugging: For complex business transactions, a checkout flow, a data pipeline, a financial reconciliation job, tracing gives you a complete audit trail of every operation involved. When a transaction fails, you can replay exactly what happened at every step.
Atatus distributed tracing instruments your services automatically and provides end-to-end request visibility across your entire stack. You can see trace waterfalls, identify slow spans, and jump directly from a trace to the associated logs and errors, without switching tools or reconstructing timelines manually.
Key Metrics to Monitor During Root Cause Analysis
RCA investigations move faster when you know which metrics to pull first. These are the signals that most reliably point toward root causes:
- Latency: p50, p95, p99 response times. p99 catches the worst-case experience that bulk averages hide. Monitor by endpoint, service, and database operation.
- Throughput: Requests per second at the service and endpoint level. Queue depth and processing rate for async workers. Database query volume.
- Error Rates: HTTP 4xx and 5xx rates as a percentage, not absolute count. Exception frequency by type and service. Dependency call failure rates.
- Apdex Score: A standardized measure of user-facing performance satisfaction. Drops in Apdex are often the first visible signal of a latency regression.
- Resource Utilization: CPU per service and host. Memory consumption and GC pressure. Container memory limits and OOM kill events. Thread pool saturation.
- Database Metrics: Query execution time by query type. Connection pool utilization and wait time. Lock wait frequency. Slow query log entries.
- External API Performance: Response time by third-party dependency. Timeout and error rates per external service. Circuit breaker state changes.
- Infrastructure: Disk I/O read/write latency. Network bytes in/out, packet loss. Container restart counts. Load balancer backend health.
Atatus APM surfaces all of these in a unified view, with anomaly alerts that notify your team when any metric deviates from its baseline, so you're not manually scanning dashboards during a live incident.
Best Practices for Faster Root Cause Analysis
These practices consistently separate teams that resolve incidents in 15 minutes from teams that take 4 hours.
- Instrument everything: Traces and logs are only useful if they cover failure paths. Instrument error handling branches, retry logic, fallback paths, and background jobs, not just the main request flow.
- Tune alerts to meaningful signals: Alert on percentage changes relative to baseline, not absolute thresholds that break at different traffic levels. Alert on p95 latency, not average latency. Reduce alert noise ruthlessly, every false positive erodes trust in your monitoring.
- Establish service-level objectives (SLOs): Define what "healthy" looks like for every service: acceptable latency, error rate, and availability targets. SLO-based alerting fires when you're approaching a breach, giving you time to investigate before users are impacted.
- Centralize your observability: Teams with logs in one tool, metrics in another, and traces nowhere spend incident time context-switching instead of investigating. Centralized observability, where logs, metrics, traces, and errors are correlated in one platform, is one of the highest-leverage investments an engineering organization can make.
- Use structured logging and trace ID propagation: Structured logs (JSON-formatted with consistent field names) are machine-queryable, unlike free-text logs. Propagate trace context (W3C TraceContext or B3 headers) across all service-to-service calls so a single trace ID can link all spans for a given request, regardless of how many services it touched.
- Document incidents and run blameless post-mortems: Every resolved incident is a learning opportunity. A post-mortem that documents the timeline, root cause, contributing factors, and preventive actions builds institutional knowledge that makes future RCA faster. Reference past post-mortems during new incidents, patterns repeat.
- Maintain a dependency inventory: Know which external services your application depends on, what their SLAs are, and what your fallback behavior is when they degrade. Many production incidents are caused by third-party failures that teams had no contingency plan for.
How Atatus Helps Teams Identify Root Causes Faster?
Atatus is an application performance monitoring and observability platform built for engineering teams who need fast, actionable answers during production incidents, not dashboards that require a data analyst to interpret.
- Distributed Tracing with Automatic Instrumentation: Atatus traces requests automatically across services, databases, and external APIs. When a performance issue surfaces, you can pull a trace waterfall showing every operation in the request lifecycle, with precise timing for each span. No manual instrumentation required for most common frameworks.
- APM with Service-Level Health Visibility: The APM dashboard surfaces service health at a glance: throughput, error rate, latency, and Apdex score, all in real time, all historically queryable. You can drill from a service-level anomaly directly into the transactions driving it.
- Error Tracking Integrated with Traces: Atatus error tracking captures unhandled exceptions with full stack traces, linked to the distributed trace that triggered them. When an exception occurs, you can see which request caused it, which service originated it, and the full upstream call chain, without cross-referencing multiple tools.
- Real-Time Alerting on What Matters: Configure alerts on any metric, latency thresholds, error rate percentages, Apdex drops, dependency failure rates, with smart baselines that reduce false positives. Get notified in Slack, PagerDuty, or your preferred incident management tool.
- Database and External Dependency Monitoring: Atatus surfaces slow queries, connection pool saturation, and external API performance as first-class observability signals, not buried in raw logs. During RCA, you can immediately see if the problem traces back to a database operation or a third-party service.
- Transaction Monitoring for Complex Flows: For multi-step business processes, Atatus transaction monitoring lets you track the end-to-end performance of critical flows, checkout, data ingestion, API pipelines, and alerts when transaction success rates or durations deviate from normal.
Engineering teams using Atatus typically reduce MTTR significantly by eliminating the tool-switching and manual correlation that consumes most incident investigation time. The signal is there when you need it, connected to everything else relevant to the investigation.
Conclusion
Root cause analysis is not a post-incident formality. It's the discipline that separates teams who fix the same problem repeatedly from teams who fix it once and move on.
In modern distributed systems, RCA requires more than intuition and log grepping. It requires end-to-end visibility across service boundaries, correlated data across logs, metrics, and traces, and tooling that connects the observable symptom back to its underlying cause quickly.
The teams that consistently reduce MTTR share a common profile: they've invested in observability before incidents happen, they have distributed tracing in place, they know what normal looks like, so they recognize abnormal immediately, and they've built post-mortem culture that converts each incident into a future prevention.
If your team is currently spending hours piecing together incident timelines from fragmented tools, that time is costing you in downtime, developer productivity, and customer trust.
Run Your Next RCA in Minutes, Not Hours
Get distributed tracing, APM, and error tracking in one platform. No credit card required.
Frequently Asked Questions
1) What is root cause analysis in software development?
Root cause analysis (RCA) in software development is the process of identifying the underlying technical cause of a production incident, performance degradation, or error, rather than just treating the visible symptom. It involves analyzing distributed traces, logs, metrics, and error data to trace a failure back to its origin, such as a slow database query, a misconfigured service, or an unhandled exception introduced in a deployment.
2) Why is distributed tracing important for root cause analysis?
Without distributed tracing, a slow or failing request in a microservices environment is nearly impossible to diagnose precisely. Distributed tracing shows every service the request touched, every database and external API call it made, and exactly how long each step took. This makes it possible to pinpoint a slow span, say, a specific SQL query in a specific service, rather than narrowing down a 10-service call chain by trial and error.
3) What tools help with root cause analysis?
Effective RCA requires tools that cover distributed tracing (to map request flows), APM (to monitor service health), error tracking (to capture exceptions with context), and log management (for detailed event data). Platforms like Atatus combine these capabilities in a unified interface, so engineers can move from alert to root cause without switching between multiple disconnected tools.
4) How does observability reduce MTTR?
Observability reduces mean time to resolution by giving engineering teams the data they need to answer "what broke, when, and why" without manual investigation. When logs, metrics, traces, and errors are correlated in one platform, teams spend less time reconstructing incident timelines and more time validating fixes. The biggest MTTR gains come from distributed tracing and automated alerting, both of which allow teams to identify root causes in minutes rather than hours.
5) What's the difference between monitoring and observability?
Monitoring tells you when something is wrong. Observability tells you why. Monitoring is about tracking predefined metrics and alerting when they breach thresholds. Observability is about having sufficient instrumentation, traces, logs, metrics, that you can ask arbitrary questions about your system's behavior and get answers. RCA requires observability, not just monitoring.
6) What is MTTR and how do you measure it?
MTTR (mean time to resolution) is the average time between when an incident is detected and when it is fully resolved. It's calculated as: total resolution time across all incidents ÷ number of incidents. MTTR is one of the four key DORA metrics for engineering performance. Reducing MTTR requires a combination of faster detection (better alerting), faster diagnosis (better observability), and faster deployment of fixes (CI/CD and feature flags).
#1 Solution for Logs, Traces & Metrics
 APM
APM
Kubernetes
Logs
Synthetics
RUM
Serverless
Security
More


![New Relic vs Splunk - In-depth Comparison [2026]](/blog/content/images/size/w960/2024/10/Datadog-vs-sentry--19-.png)