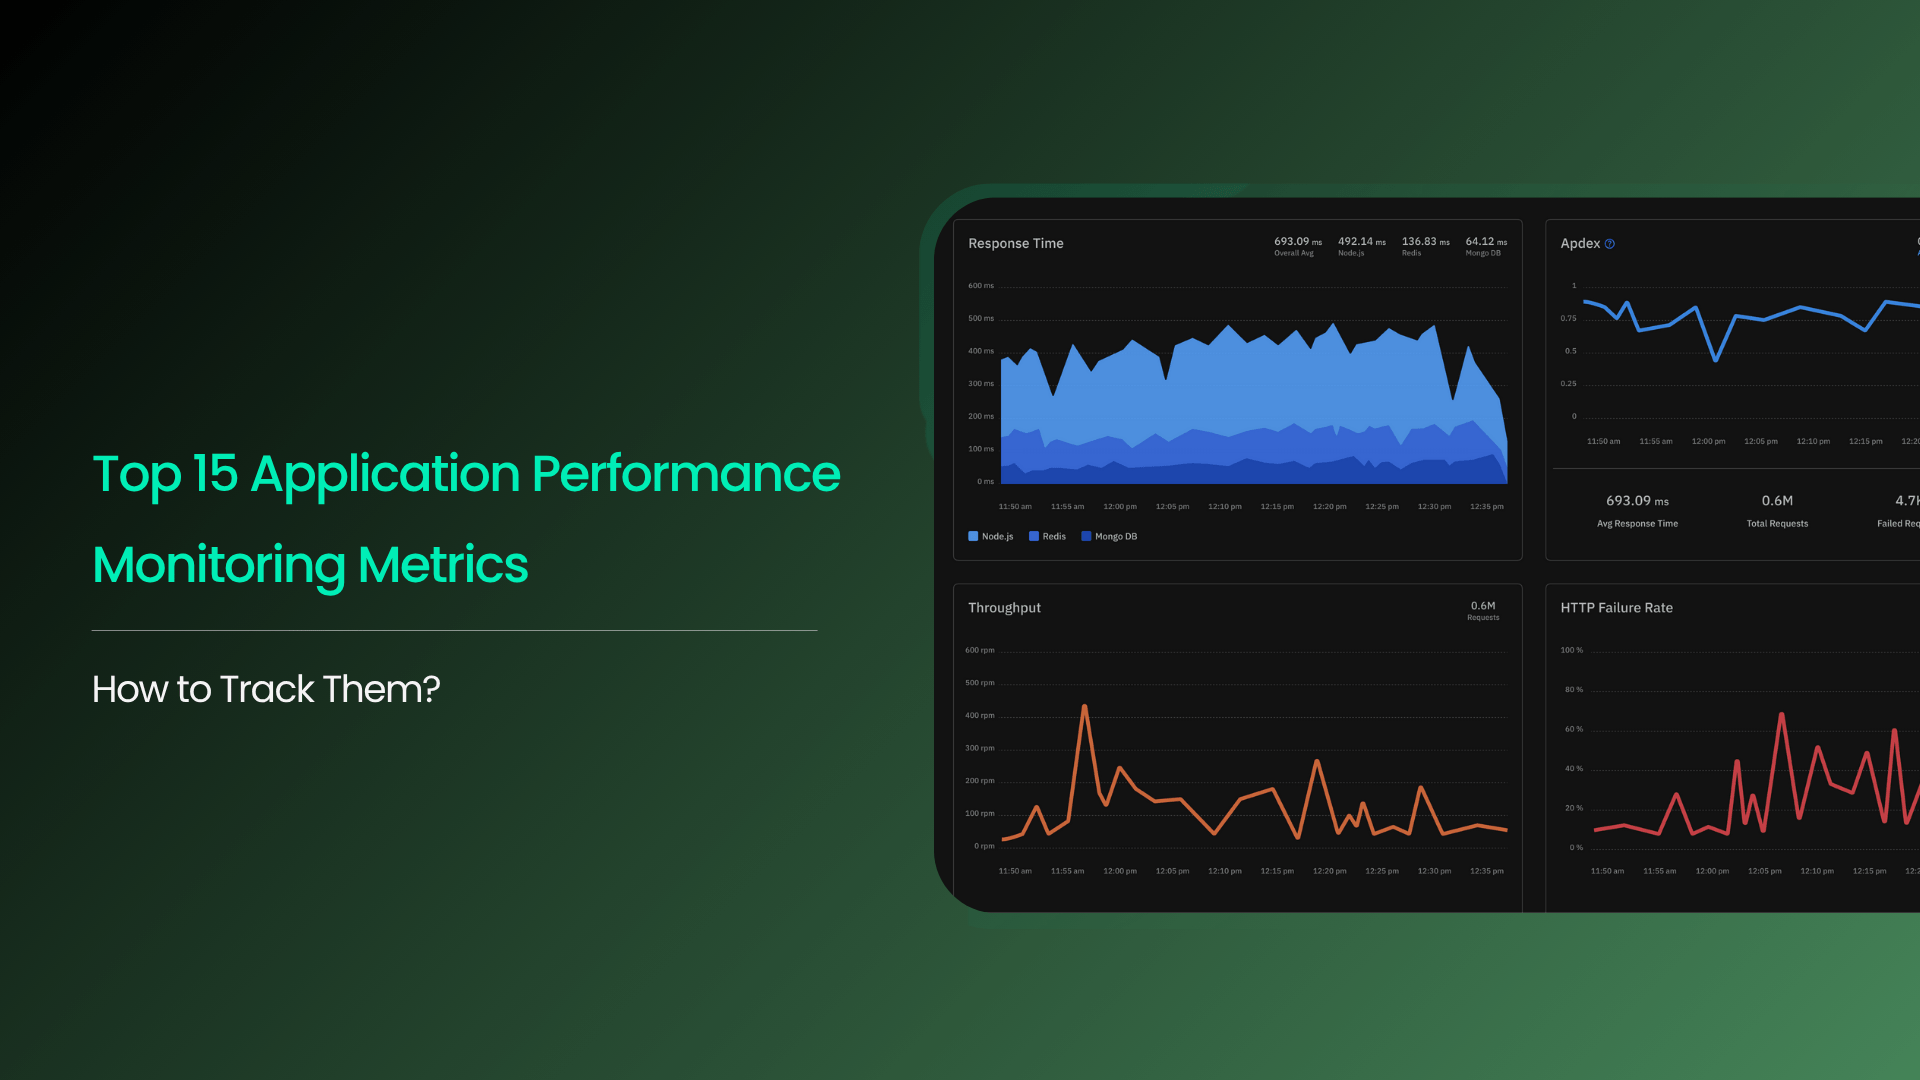
Top 15 Application Performance Metrics for Developers and SREs in 2026
Learn the 15 essential APM metrics every developer and SRE must track. Discover how the right APM tool helps boost performance, reliability, and user experience at scale.


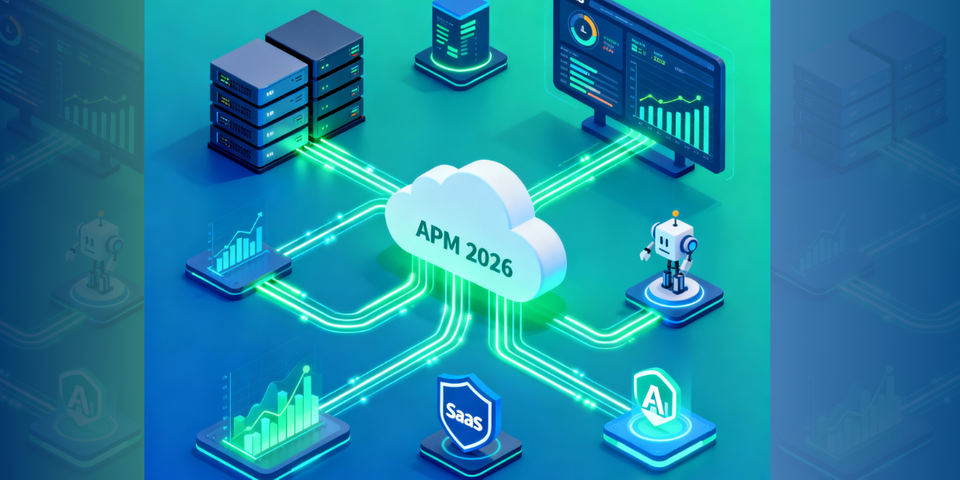
![Top 10 APM Tools [2026 Guide]](/blog/content/images/size/w960/2025/11/apm-tools-2026.png)