10 Best Practices for Proactive Database Performance Monitoring to Prevent Downtime
Databases are the core of modern applications, whether it is an e-commerce platform, a banking system, or a social media app. Slow database performance or unexpected downtime can cause serious problems, from lost revenue to poor customer experience.
Proactive database performance monitoring helps teams identify issues before they escalate. Unlike reactive monitoring, which only addresses problems after they occur, proactive monitoring ensures your database remains fast, stable, and reliable.
In this blog, we will see 10 best practices for proactive database performance monitoring to prevent downtime. These tips are aimed at developers, DevOps engineers, SREs, and database administrators who want to keep their databases running optimally.
Table of Contents:
- Understand Your Database Metrics
- Set Up Alerts and Thresholds
- Regularly Optimize Queries and Indexes
- Monitor Database Connections
- Perform Regular Backups and Test Restores
- Use Database Monitoring Tools
- Track Long-Term Trends and Patterns
- Conduct Security and Permission Audits
- Plan for Scaling and High Availability
- Regularly Test and Review Your Monitoring Strategy
1. Understand Your Database Metrics
Monitoring begins with understanding what to measure. Key metrics such as CPU usage, memory consumption, query execution time, disk I/O, and database locks provide insight into your system’s health.
For example, a sudden spike in query execution time may indicate a poorly optimized query or increased traffic. Monitoring CPU and memory usage can highlight resource bottlenecks that affect application performance. Understanding normal baseline performance allows you to identify abnormal behaviour quickly.
Best Practices:
- Track slow queries and resource usage consistently.
- Establish baseline metrics for normal database performance.
- Use dashboards to visualise metrics in real-time for faster analysis.
2. Set Up Alerts and Thresholds
Even if you are tracking metrics, issues can be missed without alerts. Alerts help notify teams when performance crosses predefined thresholds.
For instance, setting an alert for memory usage above 80% or query execution time above 2 seconds allows teams to act before users experience slowdowns. Alerts can be sent via email, SMS, or integrated with team communication tools like Slack.
Best Practices:
- Set alerts for CPU, memory, disk I/O, and query execution time.
- Customise thresholds based on production, staging, or test environments.
- Use automated alerts to reduce manual monitoring effort and response time.
3. Regularly Optimize Queries and Indexes
Poorly optimized queries and missing indexes are common causes of database slowdowns. Monitoring tools can help identify queries that take longer than expected. Optimizing these queries can significantly improve performance.
Indexes speed up read operations but can slow down writes if not managed carefully. Regularly reviewing and updating indexes ensures that your database performs well under both read and write operations.
Best Practices:
- Analyze slow queries using monitoring or profiling tools.
- Add indexes for frequently queried columns.
- Remove unused or redundant indexes to improve write performance.
4. Monitor Database Connections
Excessive database connections can overwhelm the server and cause downtime. Monitoring active connections ensures the database can handle peak traffic efficiently.
Connection pooling allows multiple applications to share a smaller number of connections, reducing overhead. Setting alerts for high connection counts ensures teams are aware of potential overloads.
Best Practices:
- Monitor real-time active connections.
- Implement connection pooling to reduce load.
- Alert the team when connection counts exceed safe limits.
5. Perform Regular Backups and Test Restores
Backups are the safety net for your database. However, backups are only useful if they are reliable and restorable. Automated backup schedules help ensure regular snapshots of your data.
Testing restores verifies that backups work correctly. Without testing, you risk discovering a failed backup only during a real disaster. Backup policies should include multiple storage locations, such as on-premise and cloud, to protect against data loss.
Best Practices:
- Schedule automated backups daily, weekly, or as needed.
- Test restores periodically to confirm backup integrity.
- Store backups in multiple secure locations to prevent data loss.
6. Use Database Monitoring Tools
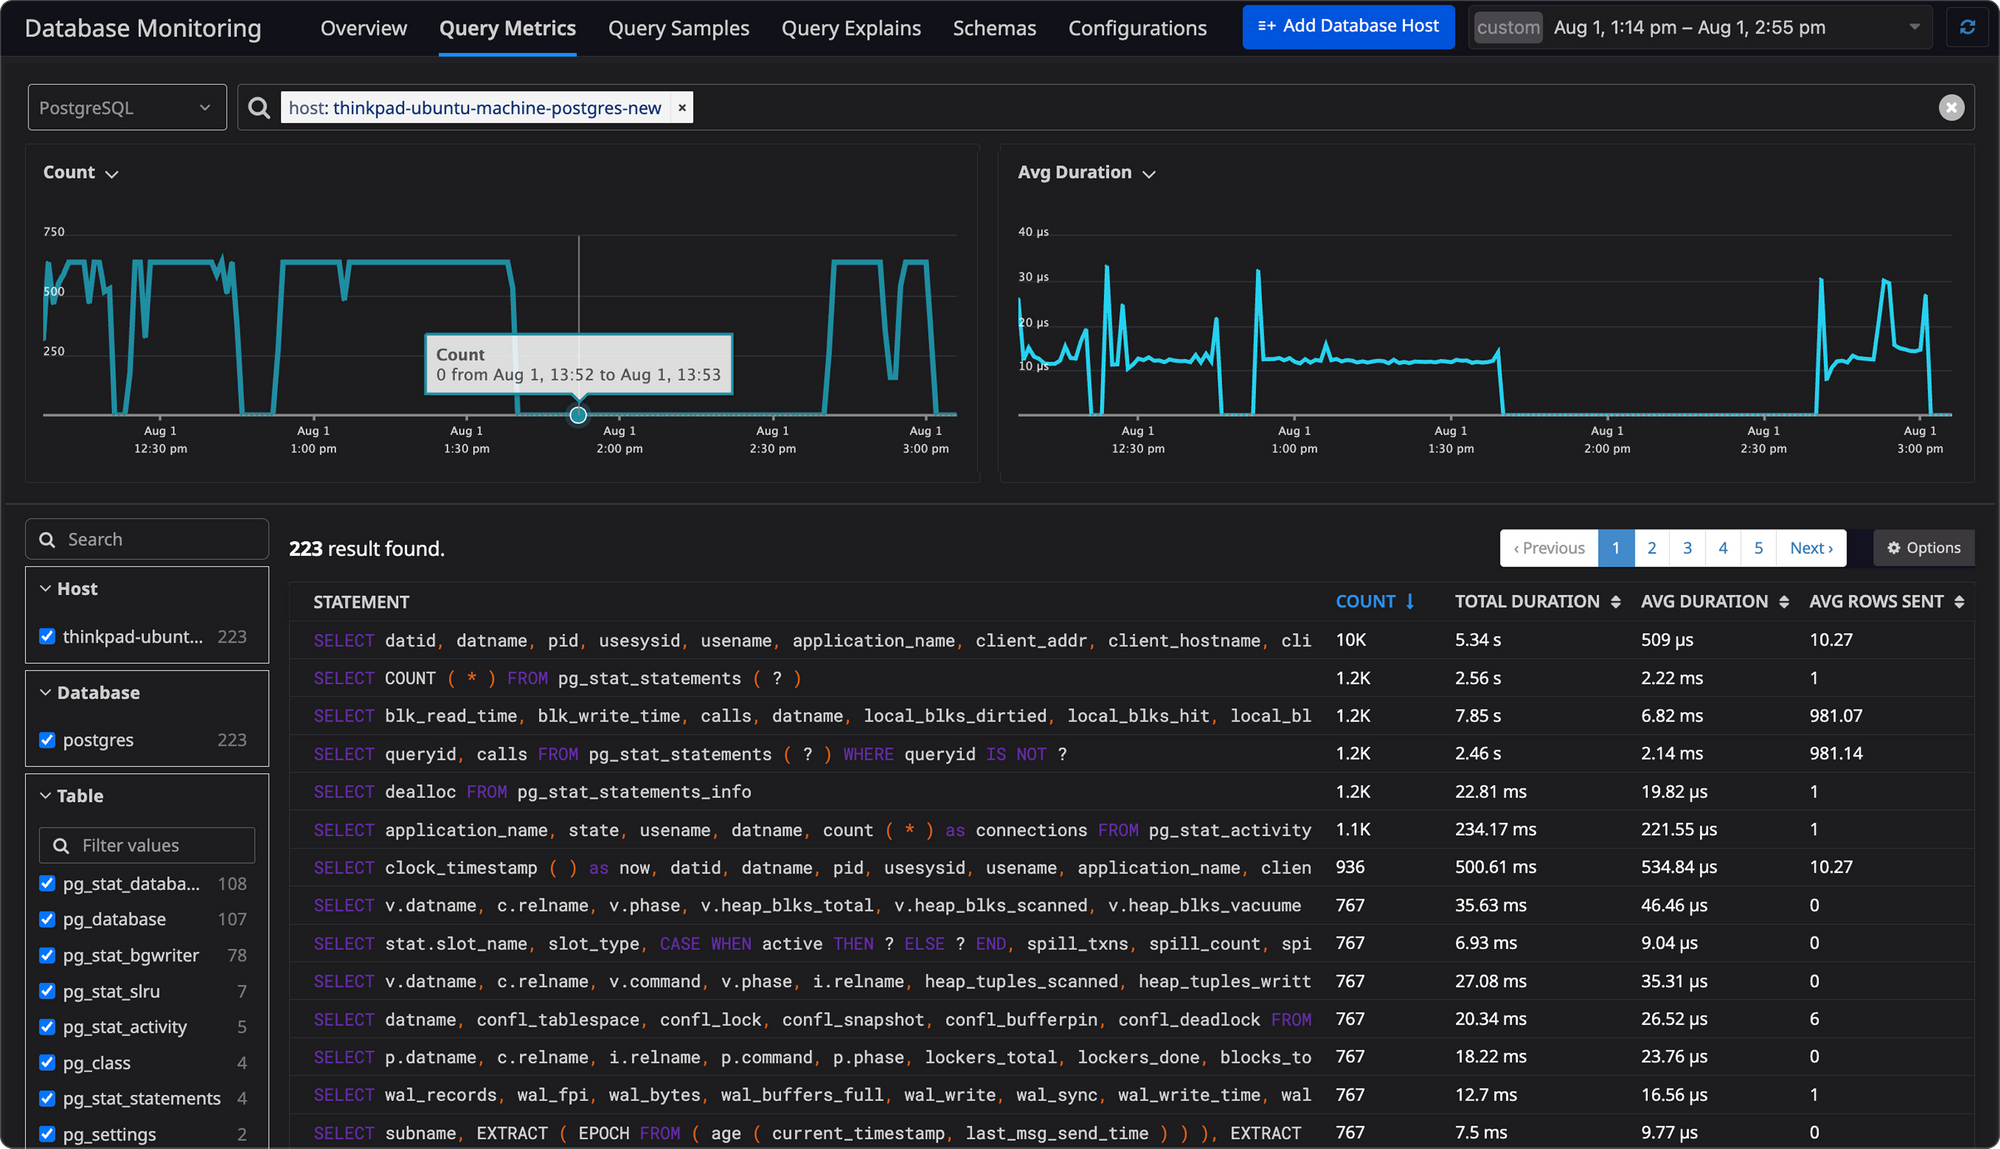
Manual monitoring is inefficient and can miss critical issues. Database monitoring tools provide real-time insights and automate the tracking of key metrics.
Tools like Atatus, Datadog, and New Relic allow teams to view dashboards with CPU, memory, I/O, and query performance metrics. They also provide alerts, historical trends, and analytics to detect and resolve issues proactively.
Facing Slow Queries or High DB Load?
Query bottlenecks, resource spikes, and connection issues can degrade application performance. Atatus Database Monitoring gives you real-time visibility into queries, CPU, memory, and I/O to quickly identify and fix problems.
Explore Database MonitoringBest Practices:
- Implement monitoring tools for real-time insights.
- Set up dashboards to track key performance metrics.
- Automate alerts for slow queries, high resource usage, and unusual patterns.
7. Track Long-Term Trends and Patterns
Short-term monitoring is useful, but tracking trends over time helps identify recurring issues and plan capacity.
For example, if traffic spikes every month, monitoring trends allows teams to optimise resources in advance. Long-term data helps identify slow degradation in performance, enabling proactive fixes before users are affected.
Best Practices:
- Analyse daily, weekly, and monthly performance trends.
- Detect recurring spikes or seasonal load issues.
- Plan capacity and scale resources proactively based on trend data.
8. Conduct Security and Permission Audits
Security issues can affect database performance and uptime. Uncontrolled access or unauthorized queries can slow down the system.
Regular audits of user permissions ensure only authorized personnel can make changes or run heavy queries. Monitoring unusual access patterns can alert teams to potential security threats.
Best Practices:
- Regularly review user roles and permissions.
- Monitor unusual database activity.
- Remove inactive accounts to maintain security and performance.
9. Plan for Scaling and High Availability
Proactive monitoring helps teams plan for scaling databases and ensuring high availability.Scaling can be vertical (adding resources to a single server) or horizontal (adding more servers).
High availability setups, such as replication and load balancing, ensure that if one server fails, others can take over. Monitoring performance during scaling changes ensures smooth operation without downtime.
Best Practices:
- Implement replication for redundancy.
- Use load balancing to distribute traffic evenly.
- Monitor performance during scaling to detect bottlenecks.
10. Regularly Test and Review Your Monitoring Strategy
Monitoring setups are not set and forget. Traffic patterns, database queries, and infrastructure evolve over time. Regular reviews ensure that alerts, dashboards, and thresholds remain effective.
Teams should test alert systems and review historical trends to adjust monitoring parameters. Continuous improvement helps maintain peak performance and prevents unexpected downtime.
Best Practices:
- Audit monitoring configurations periodically.
- Test alerts and notification systems.
- Update thresholds and dashboards as performance patterns change.
Proactive database performance monitoring is critical to ensure applications remain fast, stable, and available. By understanding metrics, setting alerts, optimizing queries, monitoring connections, performing backups, using monitoring tools, tracking trends, auditing security, planning for scaling, and reviewing your strategy, you can prevent downtime and maintain reliable performance.
Implementing these 10 best practices ensures developers, DevOps engineers, and SREs can keep databases healthy, deliver better user experiences, and avoid costly downtime. Start monitoring proactively today to maintain peak database performance.
What's Next?
Start Proactive Database Monitoring Today
Take full control of your database performance. Monitor metrics, detect anomalies, and optimize queries in real time with Atatus. Keep your applications fast, stable, and reliable.
Stop Performance Issues Now#1 Solution for Logs, Traces & Metrics
![]() APM
APM
![]() Kubernetes
Kubernetes
![]() Logs
Logs
![]() Synthetics
Synthetics
![]() RUM
RUM
![]() Serverless
Serverless
![]() Security
Security
![]() More
More