Unified Observability for Cloud-Native Infrastructure
Get complete visibility of your infrastructure to diagnose and resolve performance issues that impact your business. Make better business decisions by correlating application metrics, logs and traces to troubleshoot problems faster.
73%
Faster Detection
10s
Metric Granularity
80%
Less Alert Noise
Everything Engineering Teams Need for Full Infrastructure Observability
One platform for servers, containers, Kubernetes, and multi-cloud. No stitching tools together. Just full-stack visibility from day one.
Real-Time Infrastructure Metrics
Track CPU, memory, disk I/O, and network throughput across every host in real time with 10-second granularity to spot bottlenecks before they cascade.
Multi-Cloud & Hybrid Visibility
Native cloud infrastructure monitoring for AWS, Azure, and GCP — plus on-prem servers in a single pane of glass for hybrid cloud monitoring at scale.
Kubernetes & Container Monitoring
Auto-discover pods, nodes, and namespaces. Correlate cluster health with application performance for Kubernetes monitoring that just works.
AI-Powered Anomaly Detection
Machine learning baselines learn your infrastructure metrics patterns and flag deviations automatically — cutting alert noise by up to 80%.
Smart Alerting & Root Cause Analysis
Intelligent alert correlation, on-call routing, and one-click root cause analysis. Cut MTTR with alerts that tell you what broke and why.
Unified Logs, Metrics & Traces
Correlate infrastructure metrics with application logs and distributed traces. True monitoring and observability — without juggling five tools.
Infrastructure Insights
That Keep Systems Reliable
Comprehensive monitoring designed to maintain performance across complex infrastructure layers.
Identify Inefficient Resource Usage Across Servers
Quickly spot underutilized, overloaded, or imbalanced servers using visual heatmaps that highlight CPU, memory, and disk consumption trends.
Analyze Which Processes Impact Performance Most
Break down CPU, memory, and file descriptor usage by process to understand how individual services affect system performance and reliability.
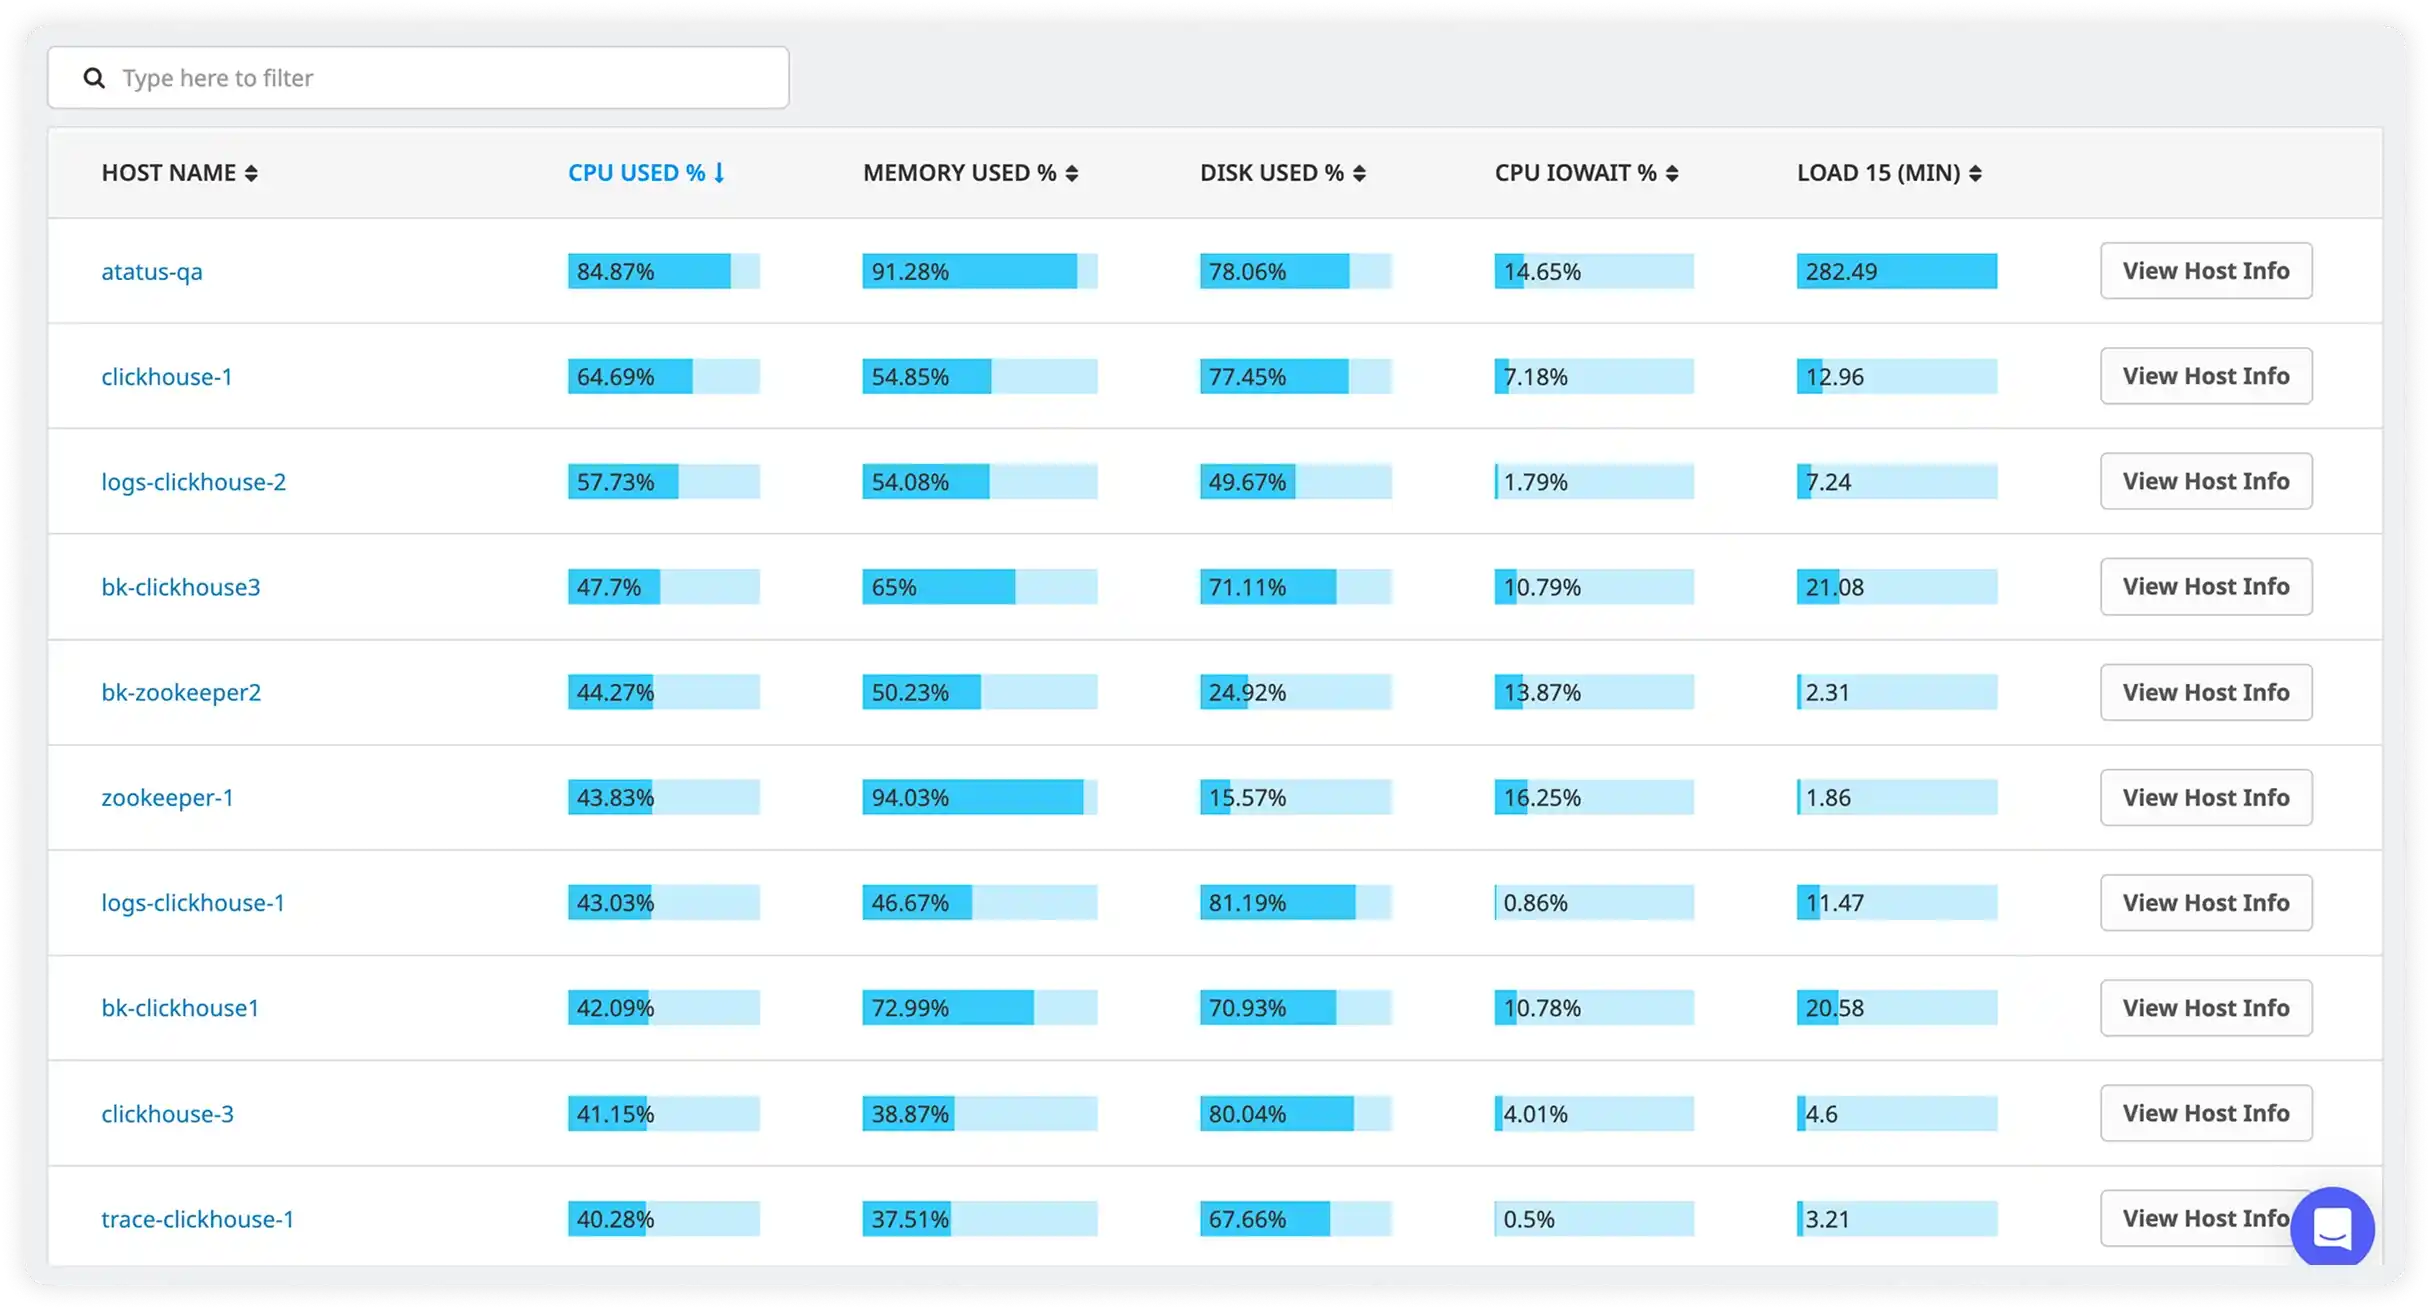
Compare Host Performance to Detect Outliers
Sort and analyze hosts based on utilization, IO wait, and load averages to uncover performance anomalies and capacity risks early.
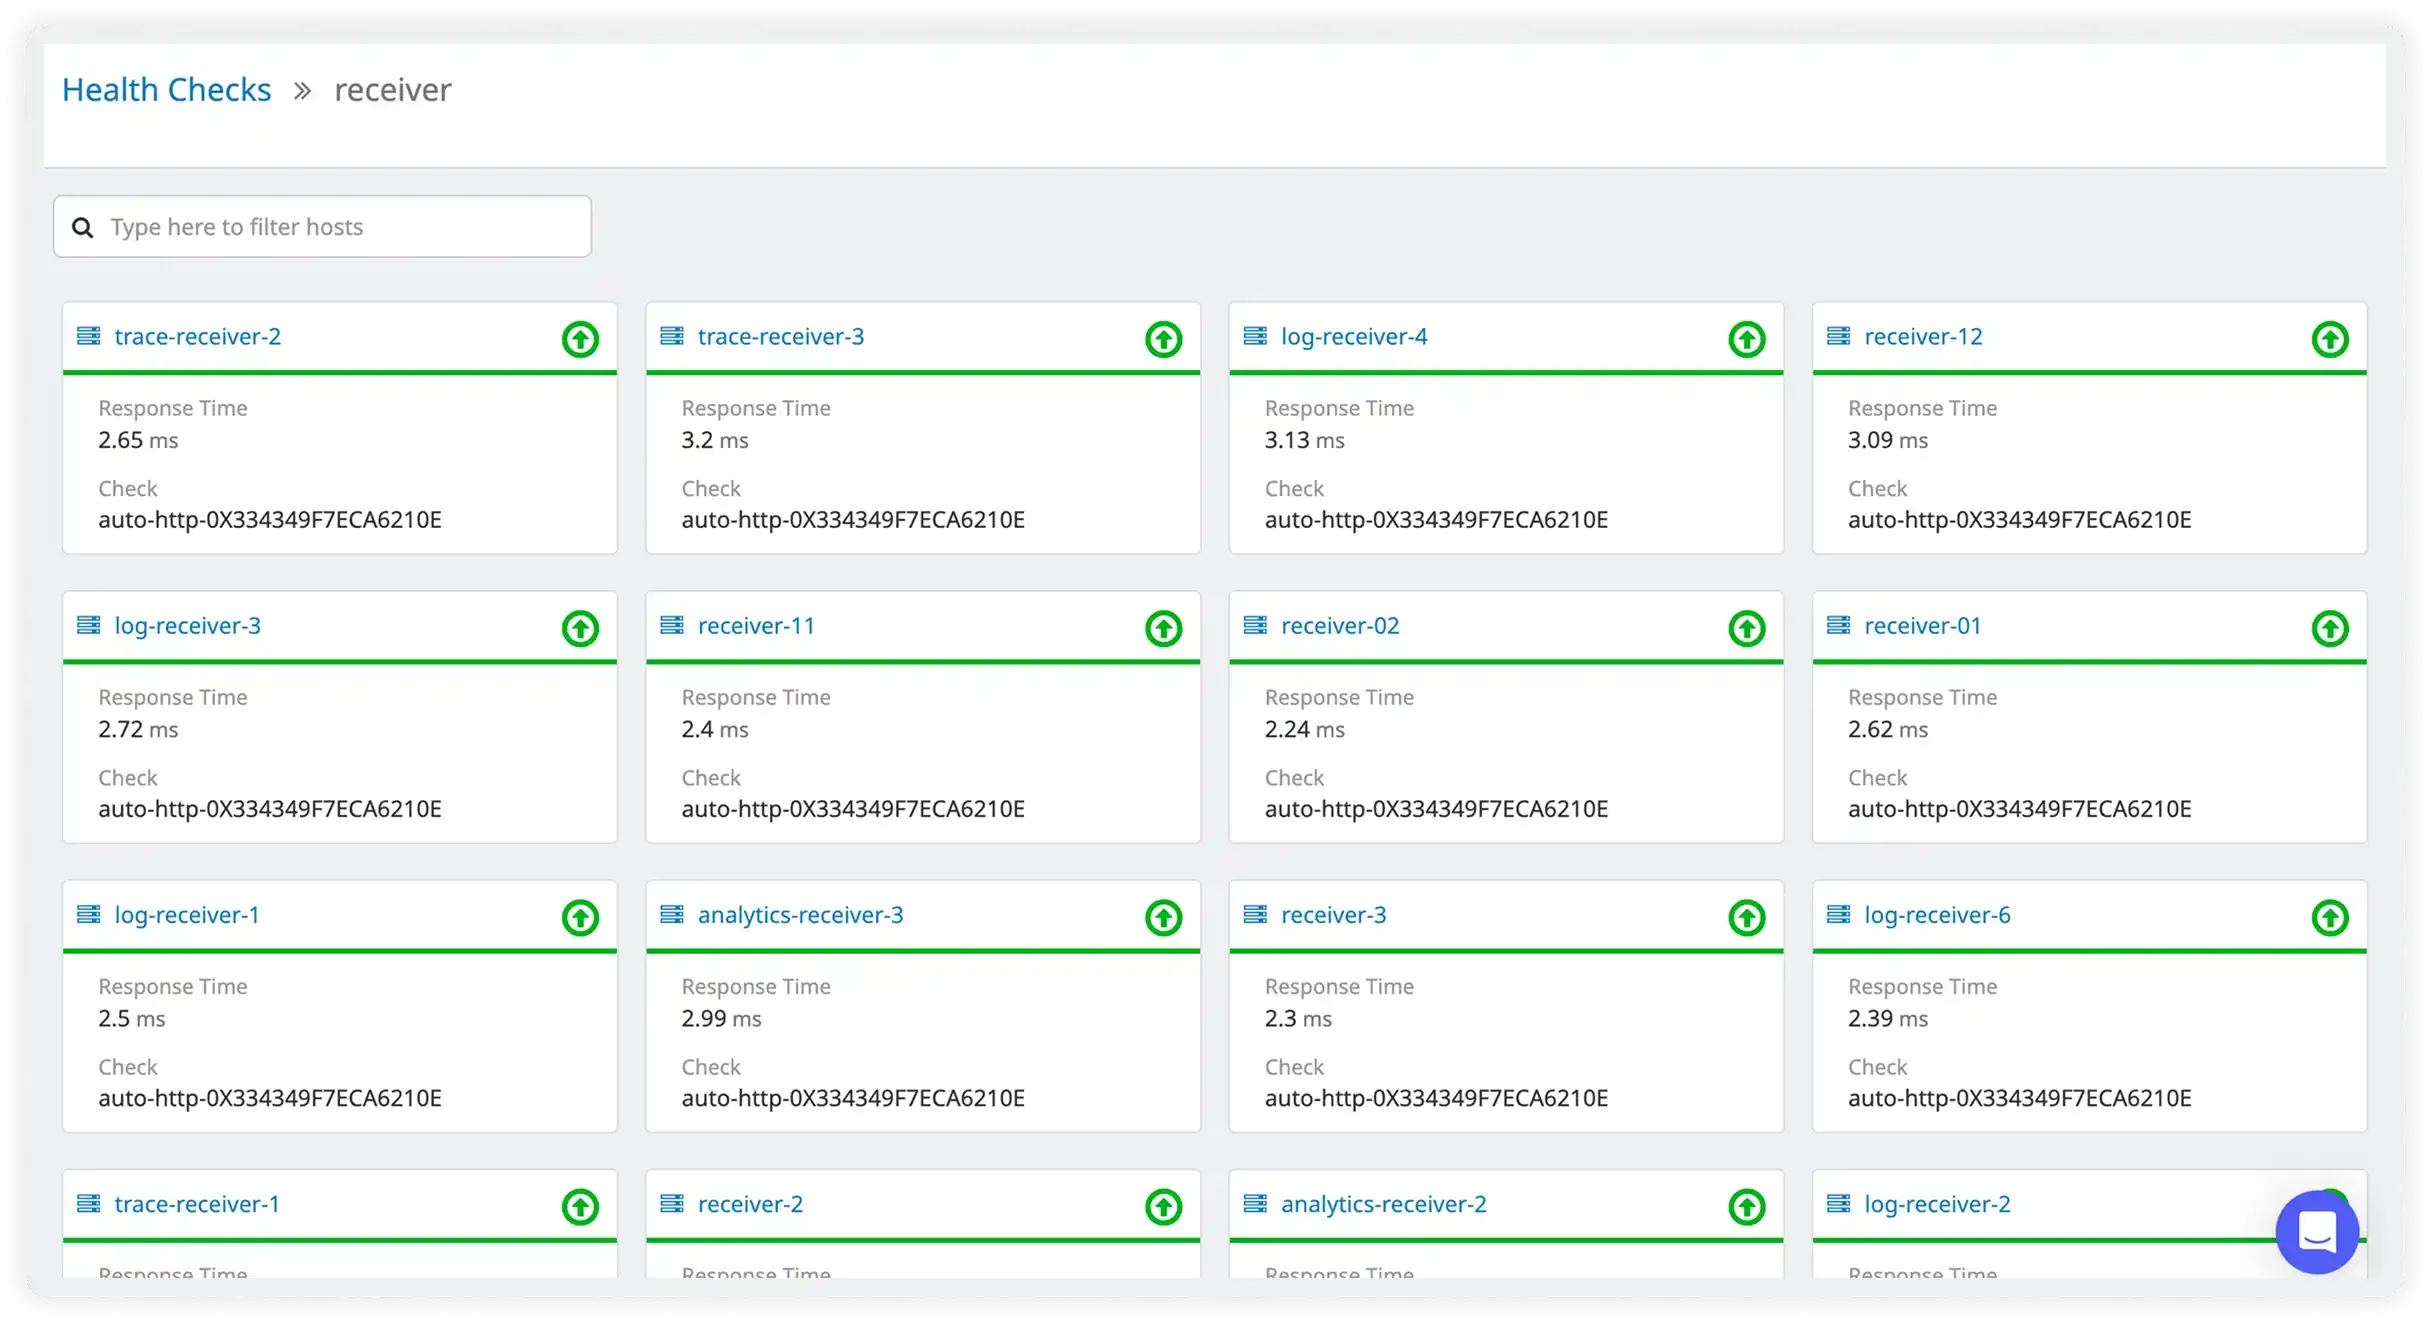
Monitor Service Availability and Response Times
Track service-level health checks to ensure applications remain responsive and meet reliability expectations across environments.
Optimize Your Infrastructure in Real-Time
Get real business value across your server landscape by monitoring the health and performance of your services, hosts, containers and resources.
Host Monitoring
Get an enhanced overview of your servers and containers, with a summary of CPU, memory, disk, network utilization in a single view.
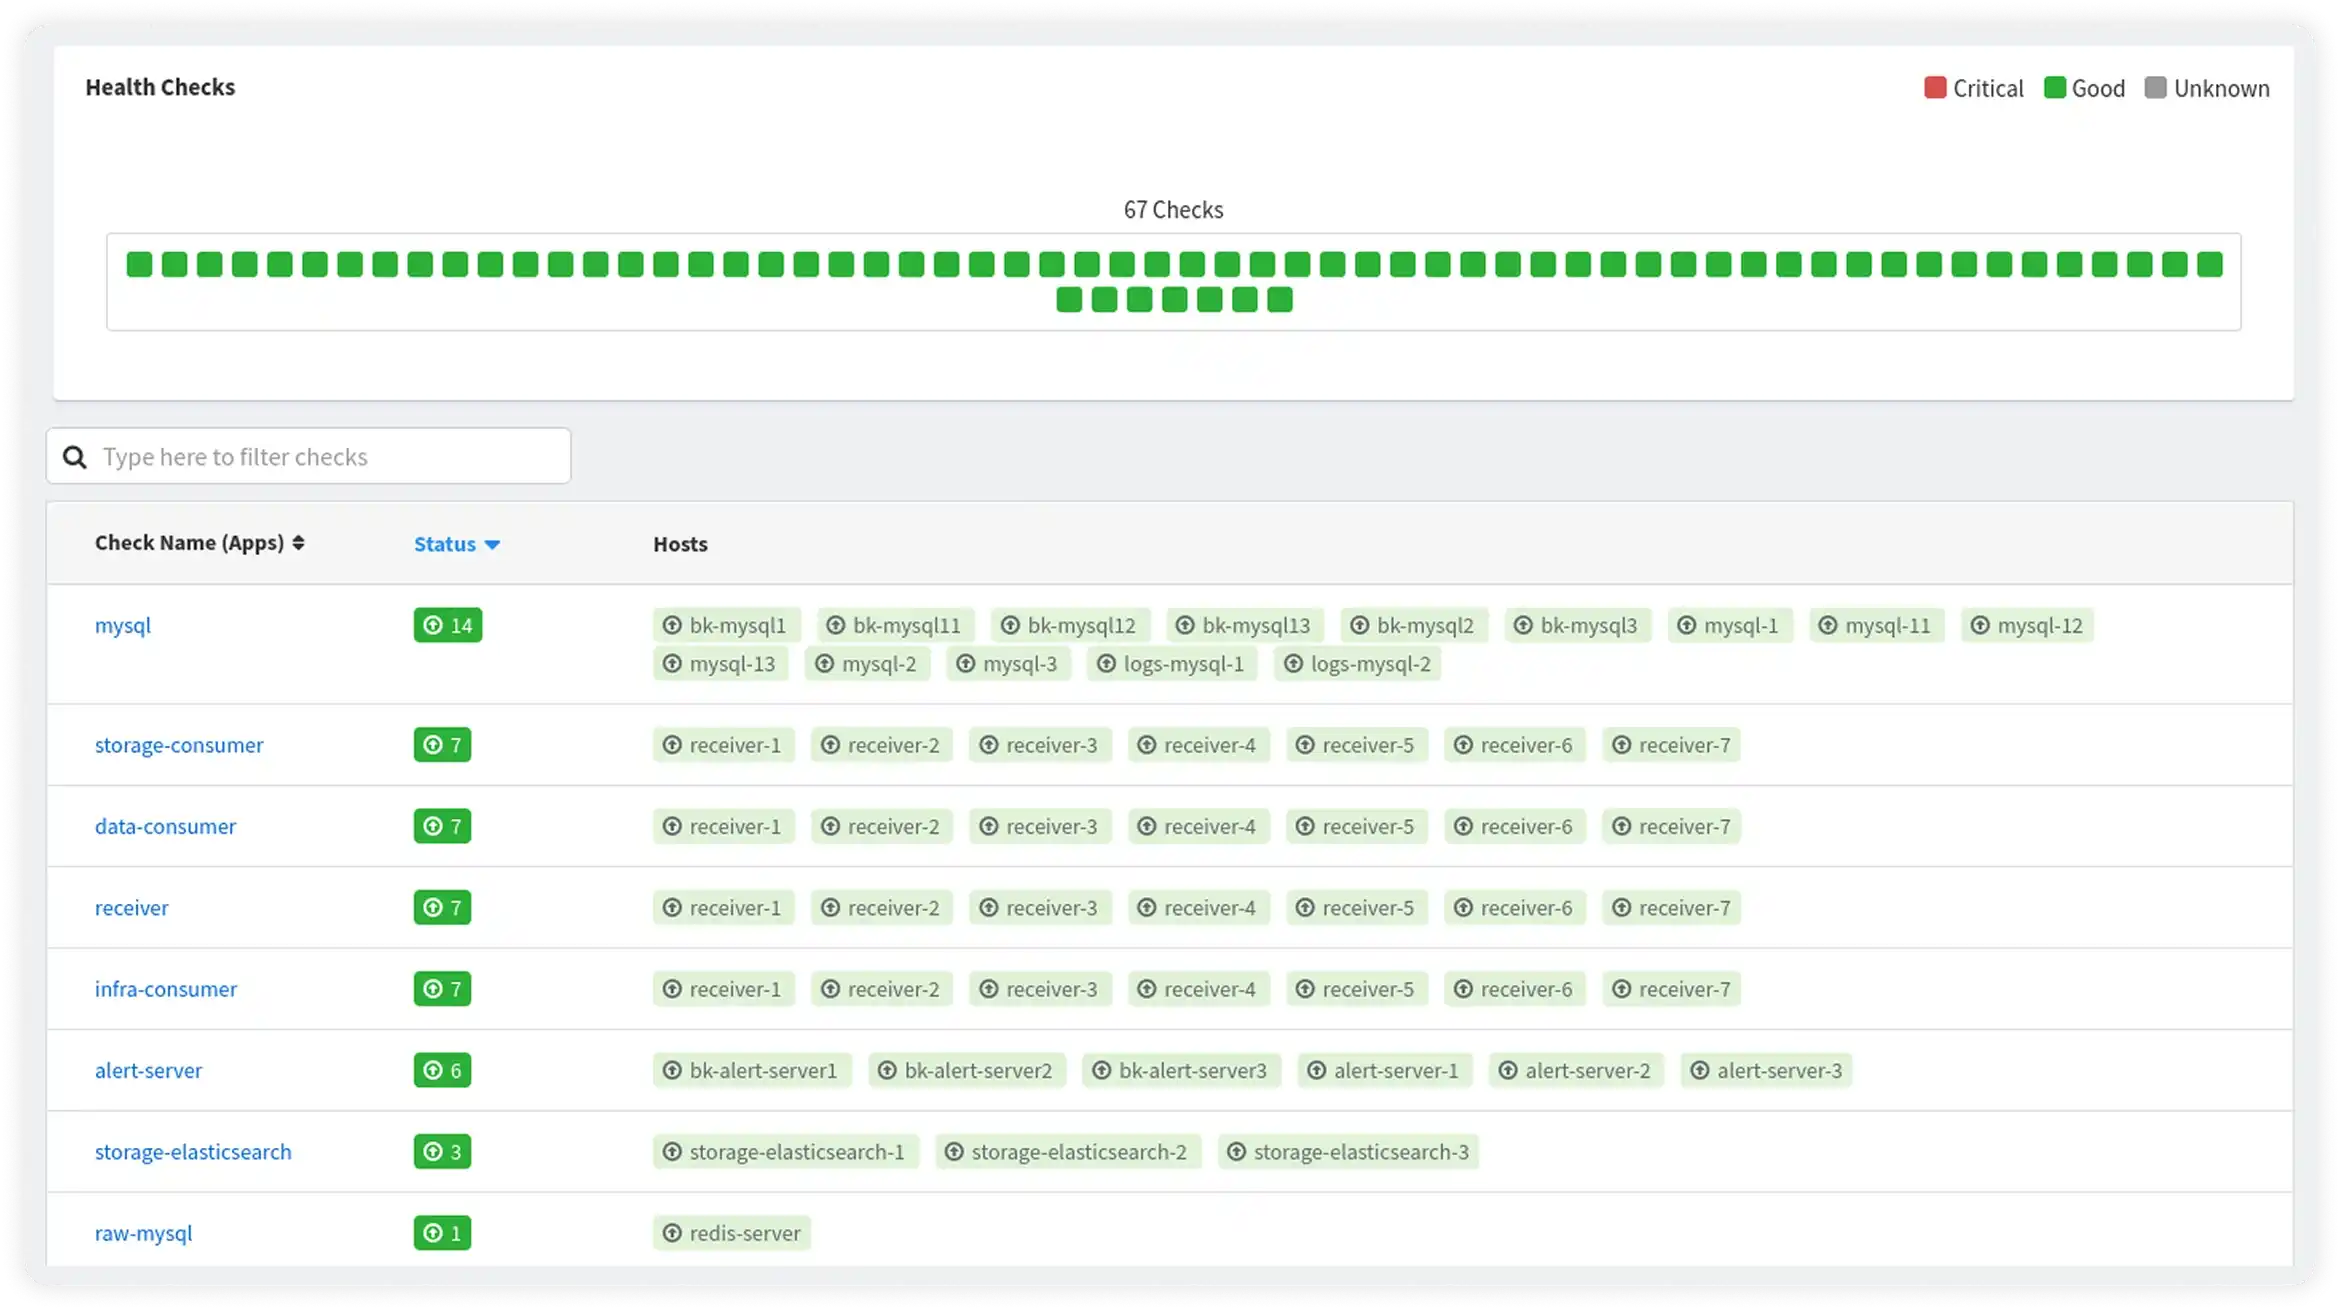
Health Checks
Set up health checks to monitor health (uptime) of apps or services running on your servers. Get notified on any impact to the services.
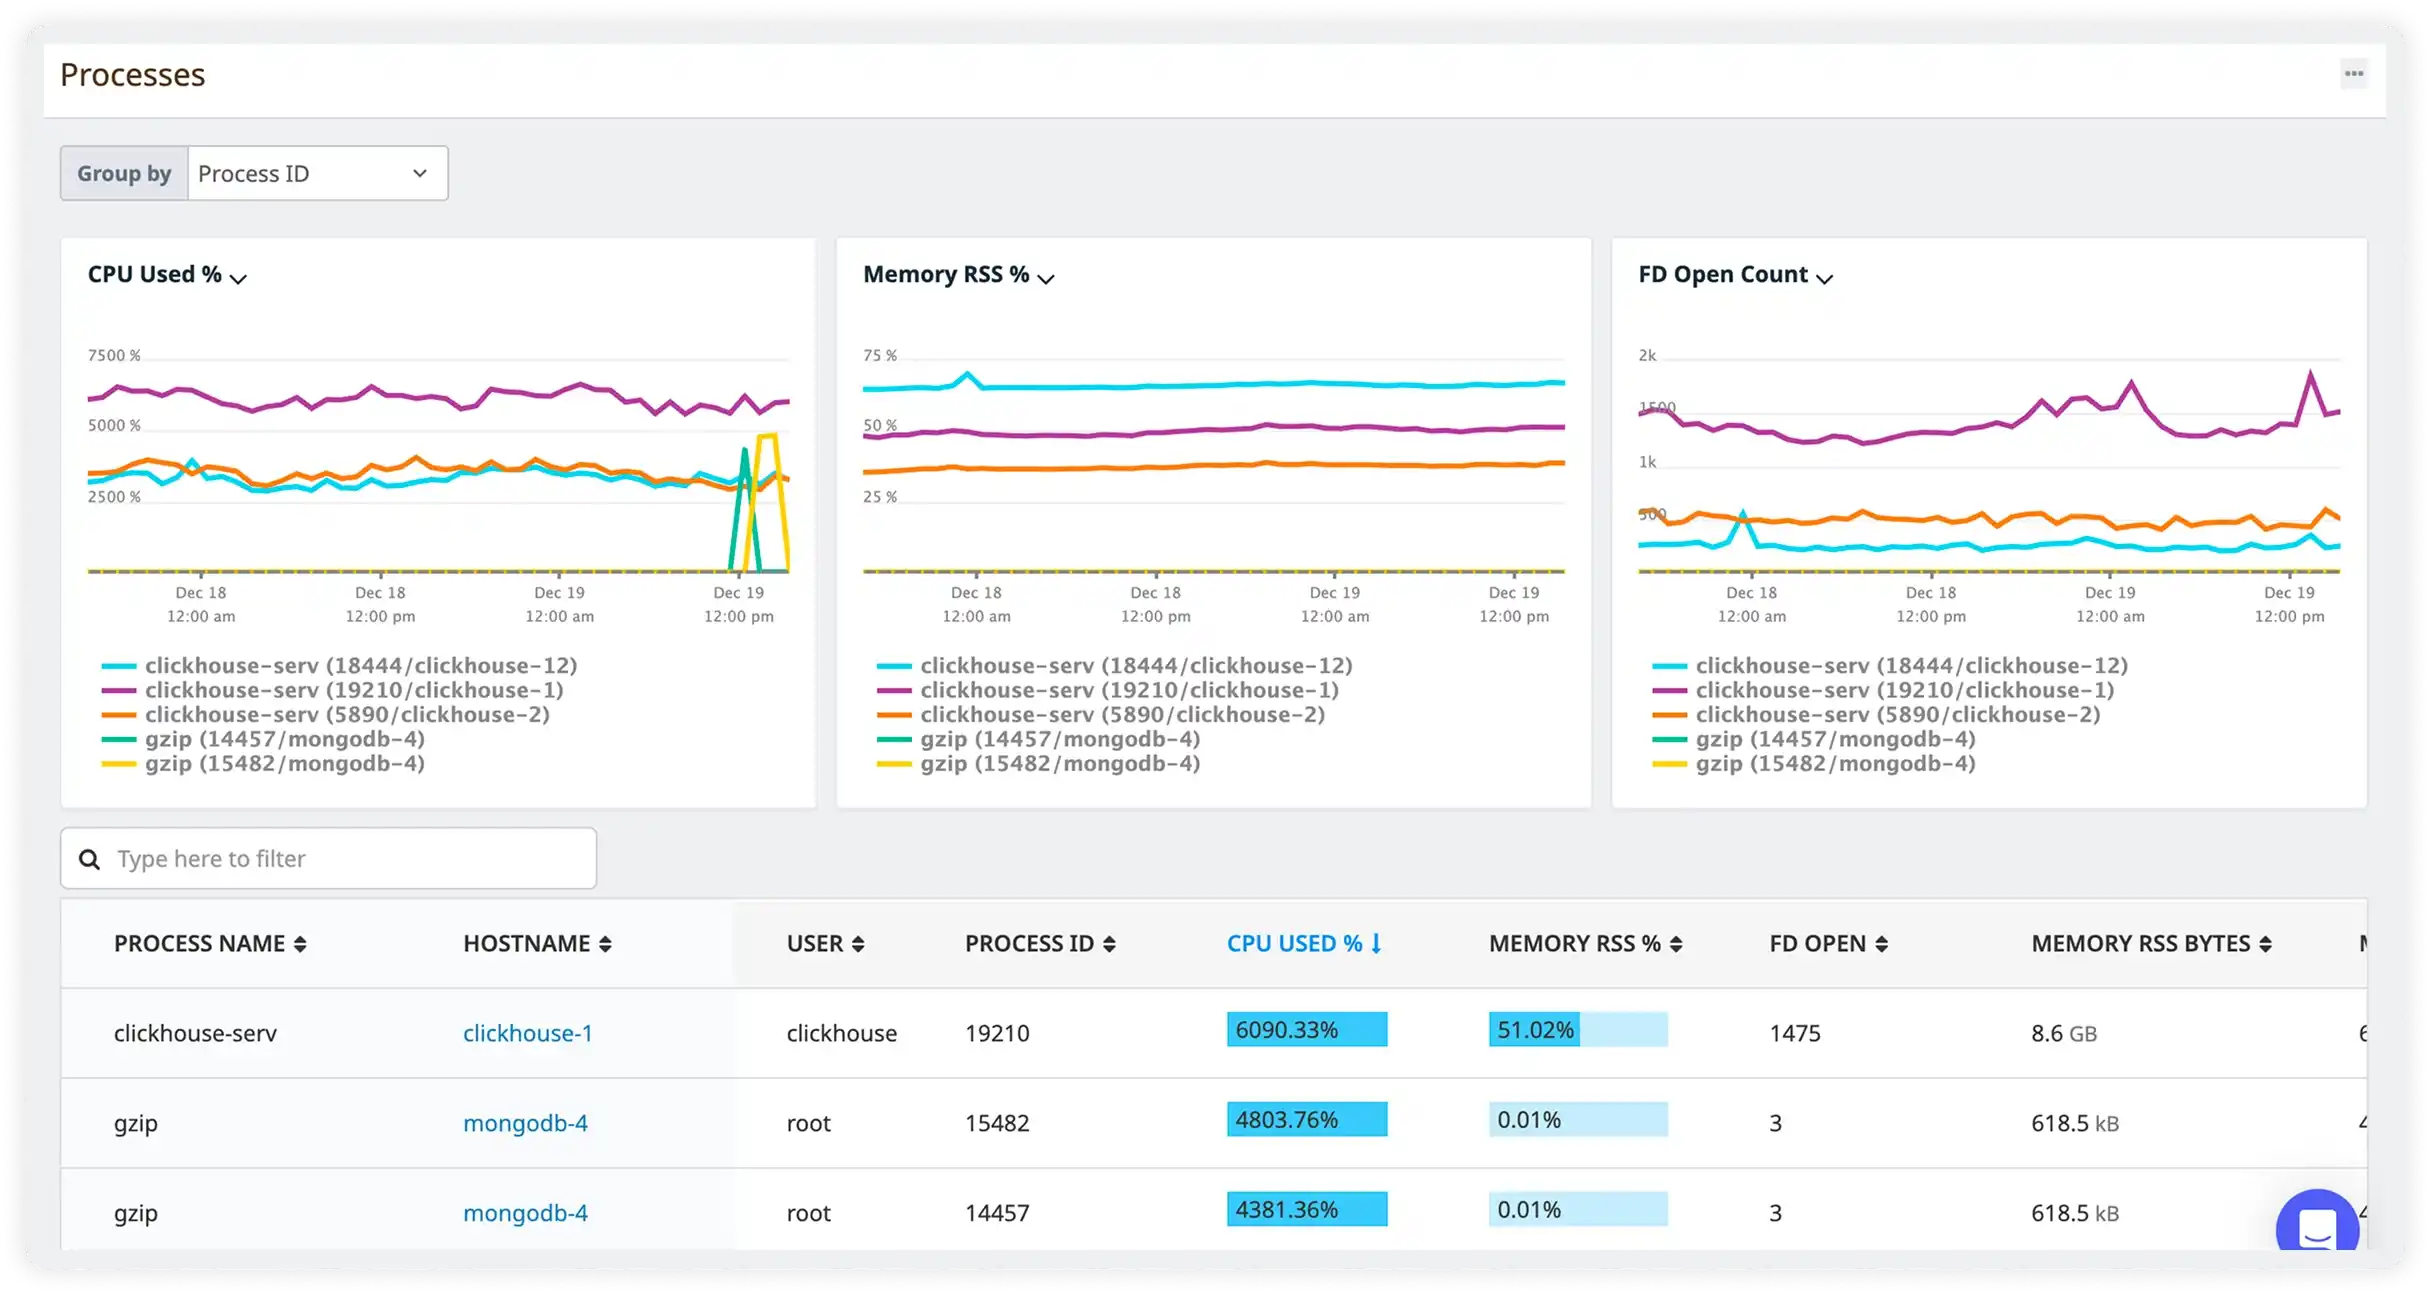
Process Monitoring
See the summary of all your resources per process, including CPU, memory, storage and network, with detailed data for troubleshooting issues.
Inventory Tracking
Search, filter and group packages, inventory data to identify security vulnerabilities, mismatches, and any user action on your servers.
Built for Teams Who Run Infrastructure and Care About Reliability
See how engineering organizations use Atatus infrastructure monitoring to ship faster and stay up.
Prevent Outages Before They Hit Revenue
Detect saturating disks, memory leaks, and degraded nodes hours before downtime. SRE teams cut Sev-1 incidents by up to 60% with proactive infrastructure health monitoring.
Ship Faster With Confidence
Pre-production and production DevOps monitoring in one workflow. Catch performance regressions before deploy, monitor canaries in real time, and roll back instantly.
Right-Size Workloads, Cut Cloud Waste
Surface under-utilized instances and idle resources. Combine infrastructure analytics with cost data to inform capacity planning backed by real usage.
Tame Cluster Sprawl
End-to-end container monitoring and Kubernetes operations visibility. Track resource quotas, pod restarts, scheduling failures, and node pressure.
Start Monitoring in Under 5 Minutes
Three simple steps to complete observability. No credit card required.
Two-minute set up
Deploy and get started within minutes in seeing key server performance metrics for actionable insights. Just start collecting data and solving issues now.
Correlate Infra with APM
Troubleshooting becomes easier if you are able to correlate the host metrics with the APM slow traces and errors. Get connected context with unified monitoring.
Smart alerting
Setup alerts to automatically monitor your infrastructure for downtime, increase in CPU, memory, disk and storage consumption. Get notified through various channels.
We'd tried a few monitoring tools before Atatus. The difference was how quickly everything made sense including CPU spikes, memory leaks, pod restarts connected in one place. Our on-call rotation is calmer, our deploys are more confident, and we stopped losing hours trying to trace what actually caused an incident.