
Ensure Uptime with 24x7 Synthetic Monitoring
Simulate user interaction with Synthetic(Uptime) Monitoring to test your website or application's availability. Check the slowness and functionality of your application to get accurate and actionable insights in an intuitive dashboard.
<30s
Downtime detection latency
20+
Global monitoring locations
99.9%
Uptime achievable
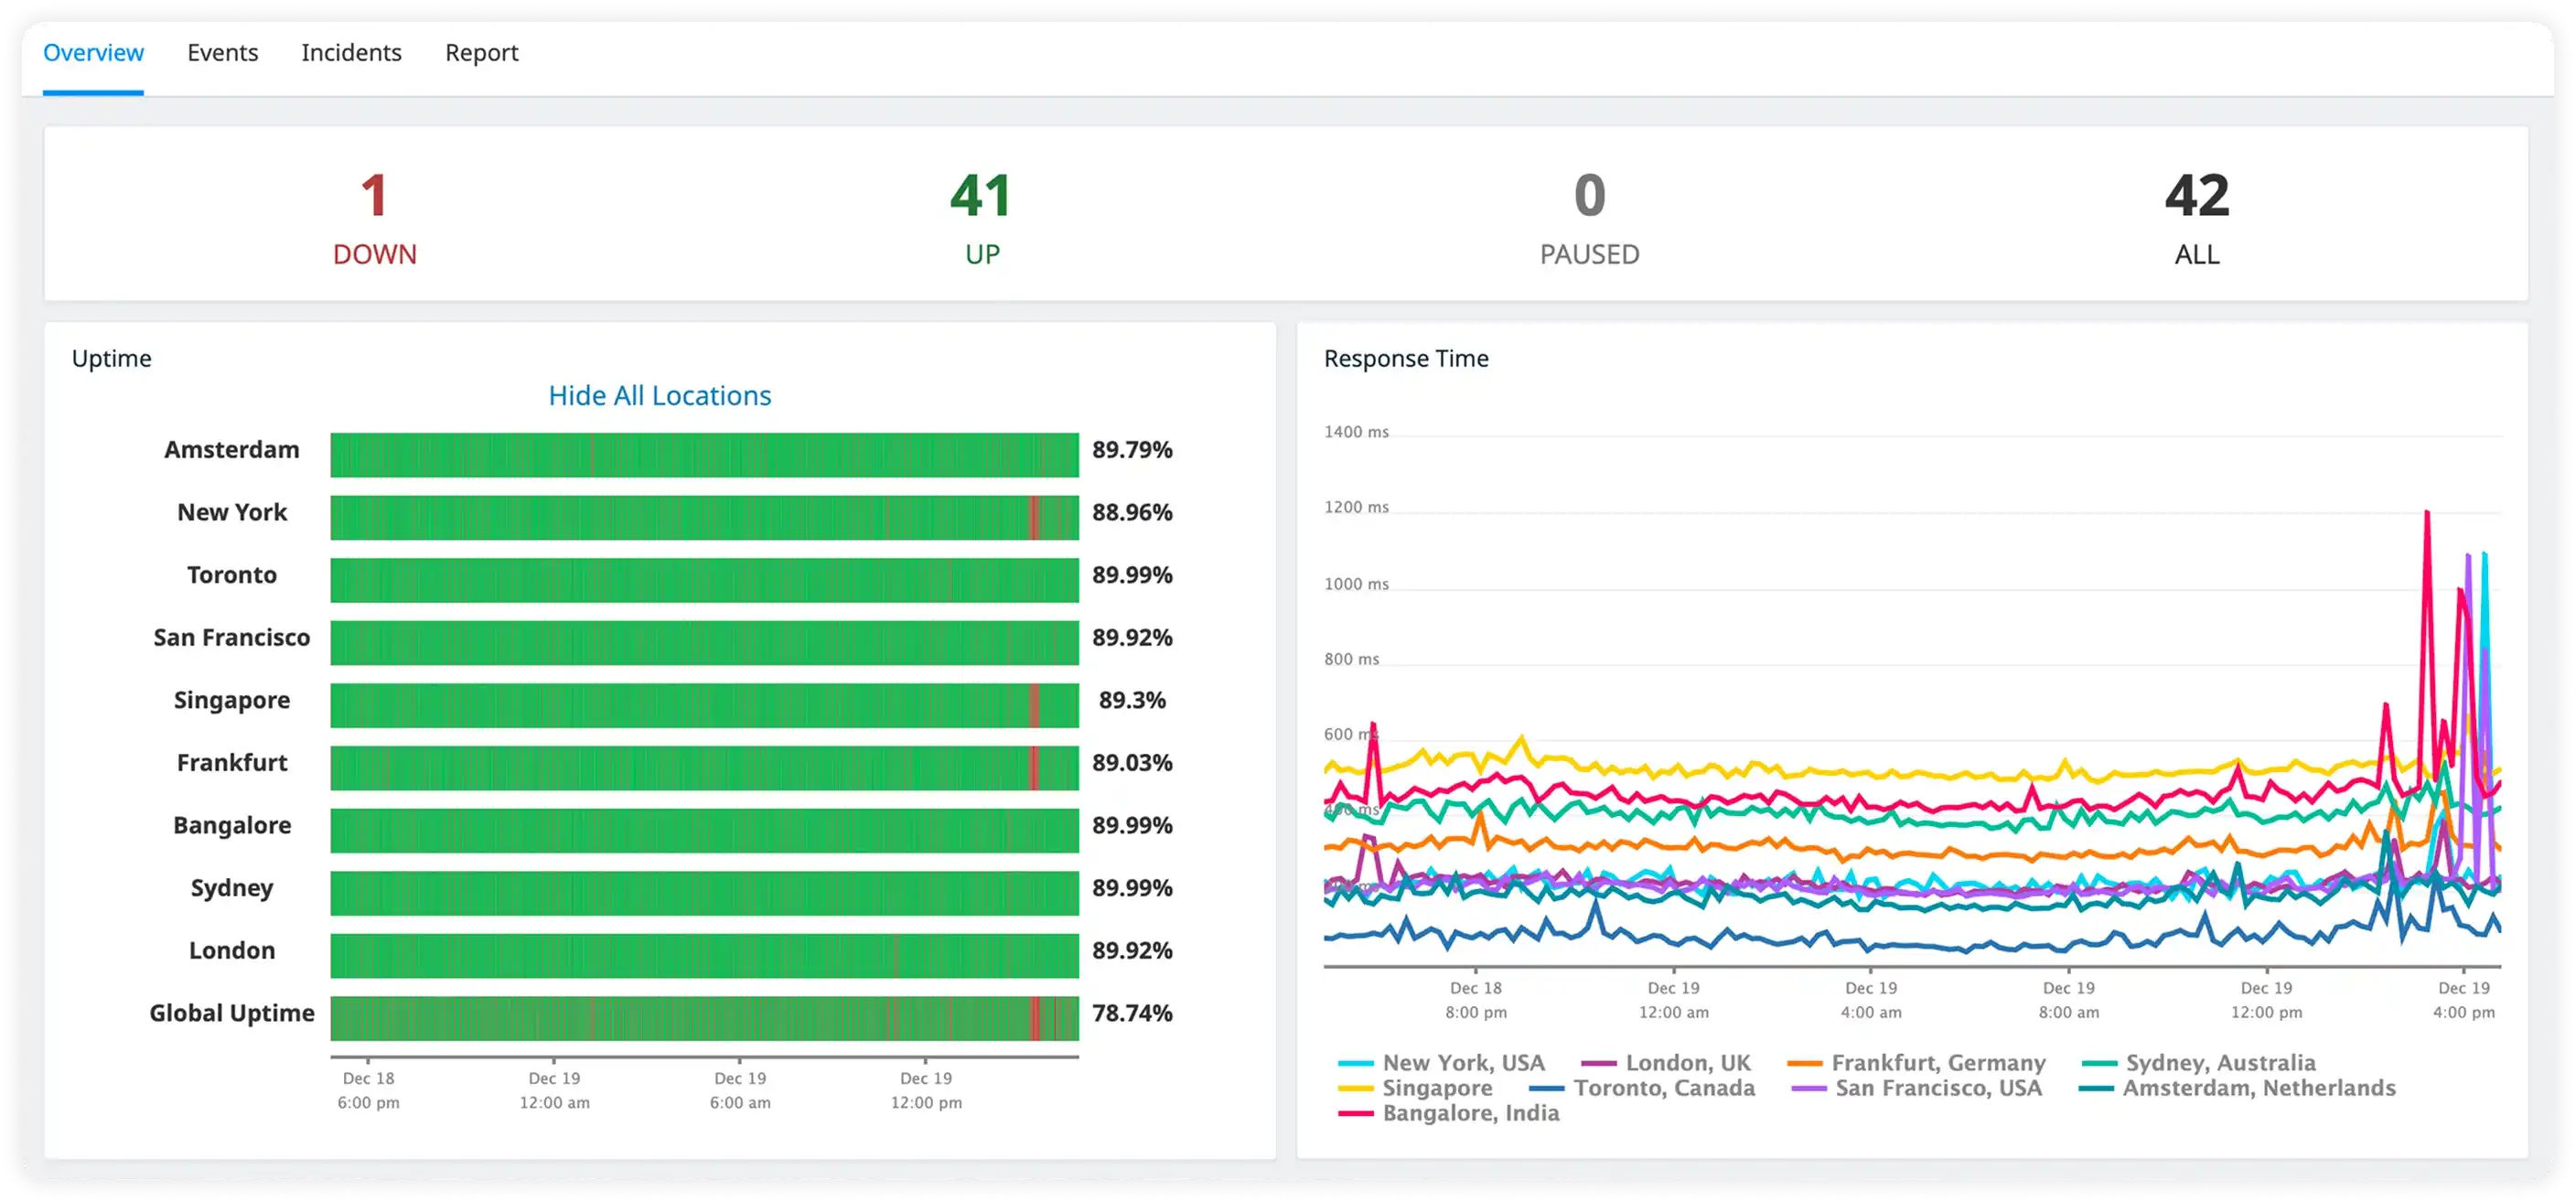
From real-time checks to multi-step transaction testing
Every tool built to eliminate downtime before it reaches users. No sampling. No lag.
Proactive synthetic monitoring
Run continuous simulated checks 24/7 from global locations. Catch failures before real users encounter them. Sub-30-second detection latency from any region.
Multi-step transaction monitoring
Simulate complete user flows like login, checkout, form submission. Validate every step end-to-end so failures in critical flows are caught immediately, not after revenue is lost.
API endpoint monitoring
Validate REST and GraphQL endpoints with single and chained API checks. Assert response codes, body content, headers, and latency thresholds. Detect broken integrations instantly.
Global performance benchmarking
Measure response times and availability from multiple geographic locations simultaneously. Identify region-specific slowdowns and ensure a consistent experience for every user, everywhere
Instant downtime alerts & escalation
Multi-channel delivery via Slack, PagerDuty, OpsGenie, Jira, email, and SMS. Route alerts by severity and environment. Your team owns the incident before the first support ticket.
Root cause visibility across your stack
Correlates synthetic failures with APM traces, logs, and infrastructure metrics. Distinguish between app bugs, dependency failures, and infrastructure exhaustion automatically.
Everything You Need to
Stay Online 24/7
Comprehensive uptime monitoring features that help you detect and resolve issues before they impact users
Continuous Uptime Monitoring
Monitor websites and services continuously to detect outages instantly. Get clear visibility into availability so teams can respond quickly and reduce user and business impact.
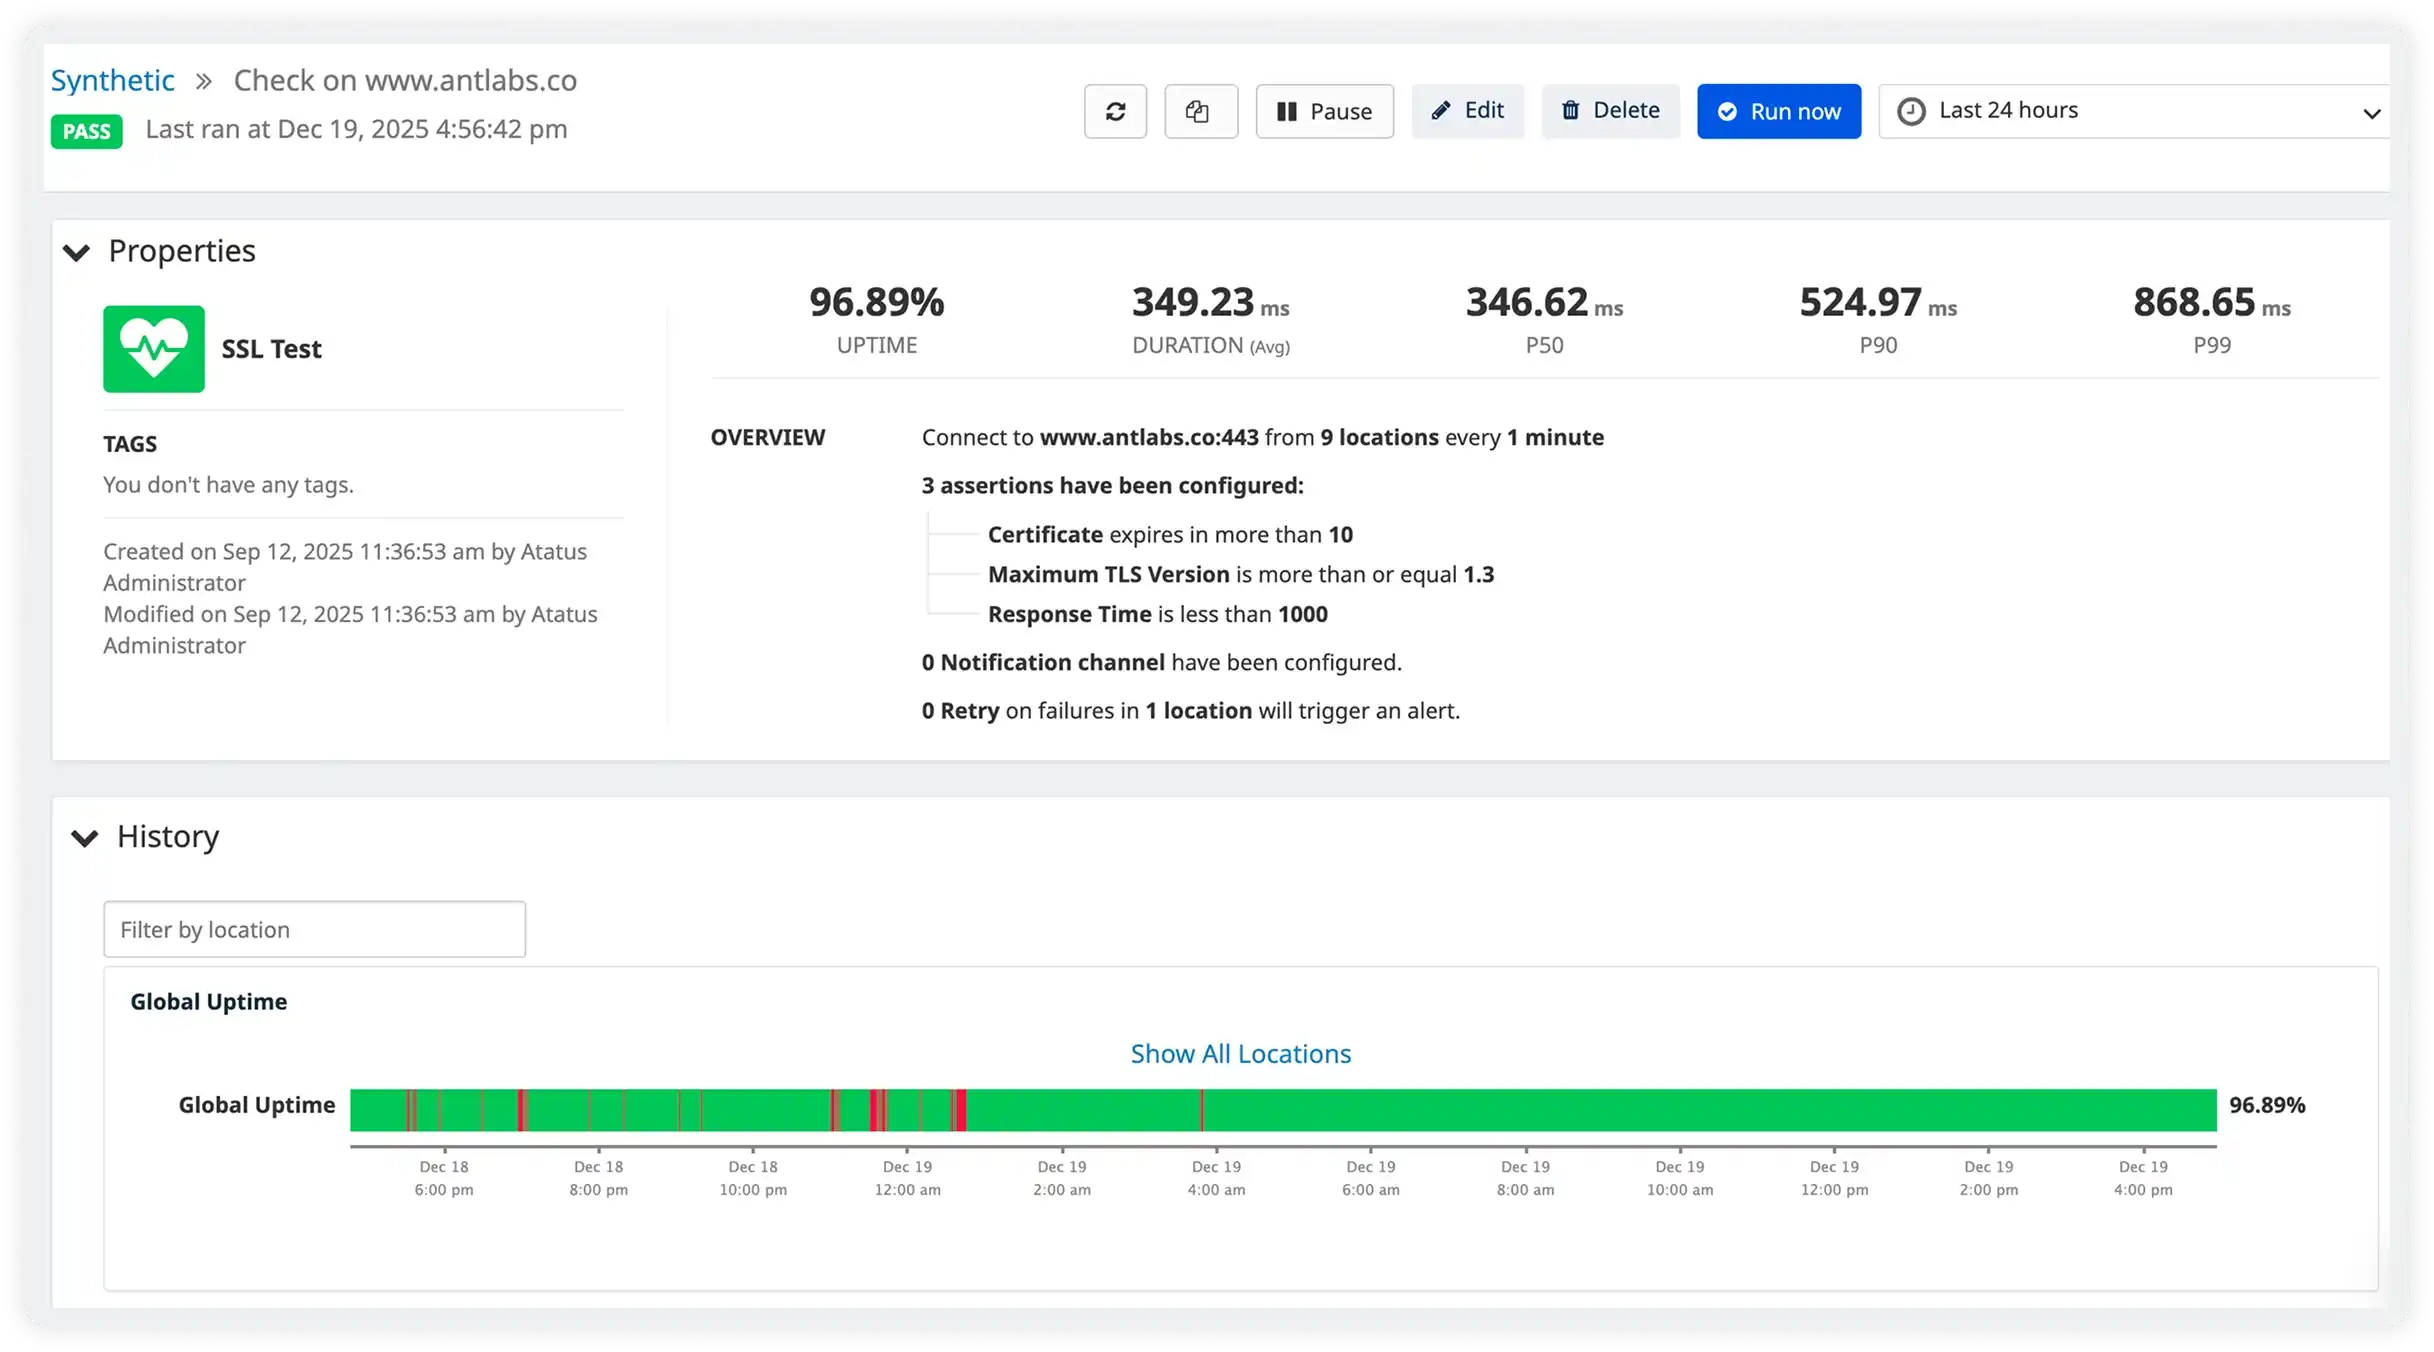
Response Time and Performance Trends
Track website and API response times over time to identify slowdowns, latency spikes, and performance regressions before they affect real users.
Synthetic Browser Testing
Run synthetic browser checks to simulate real user journeys and validate page load performance, flows, and functionality beyond basic uptime monitoring.
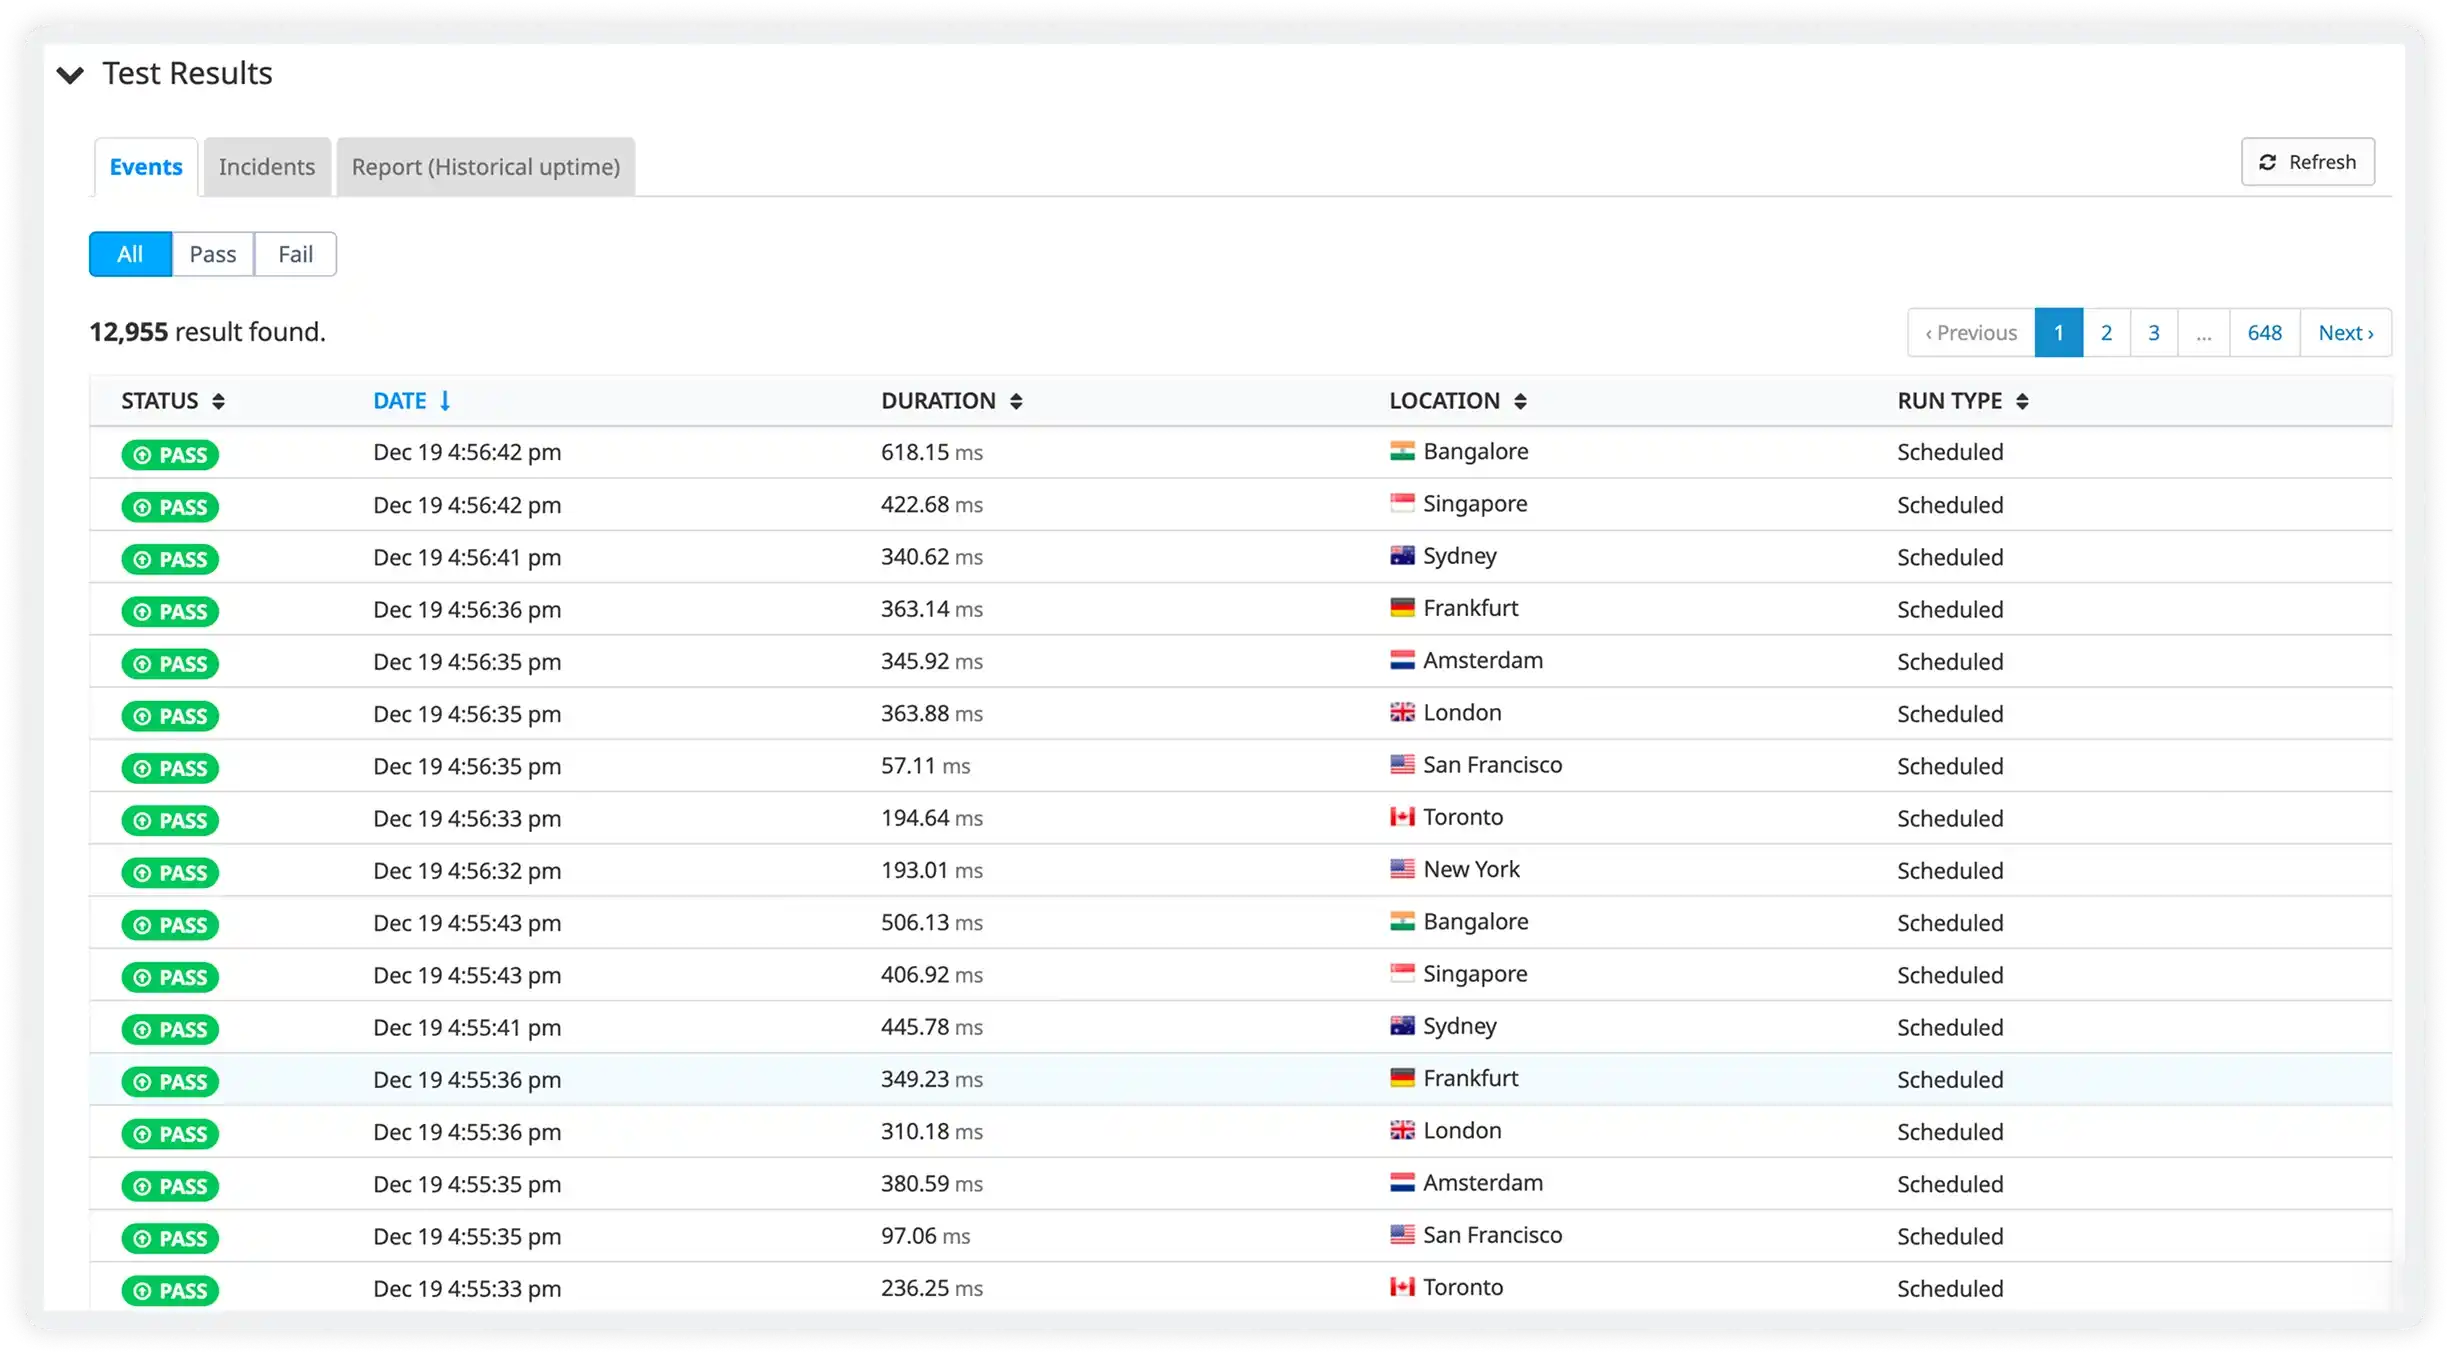
API and Multi-Step API Checks
Validate APIs with single and multi-step checks to ensure availability, correct responses, and end-to-end workflow reliability across dependent services.
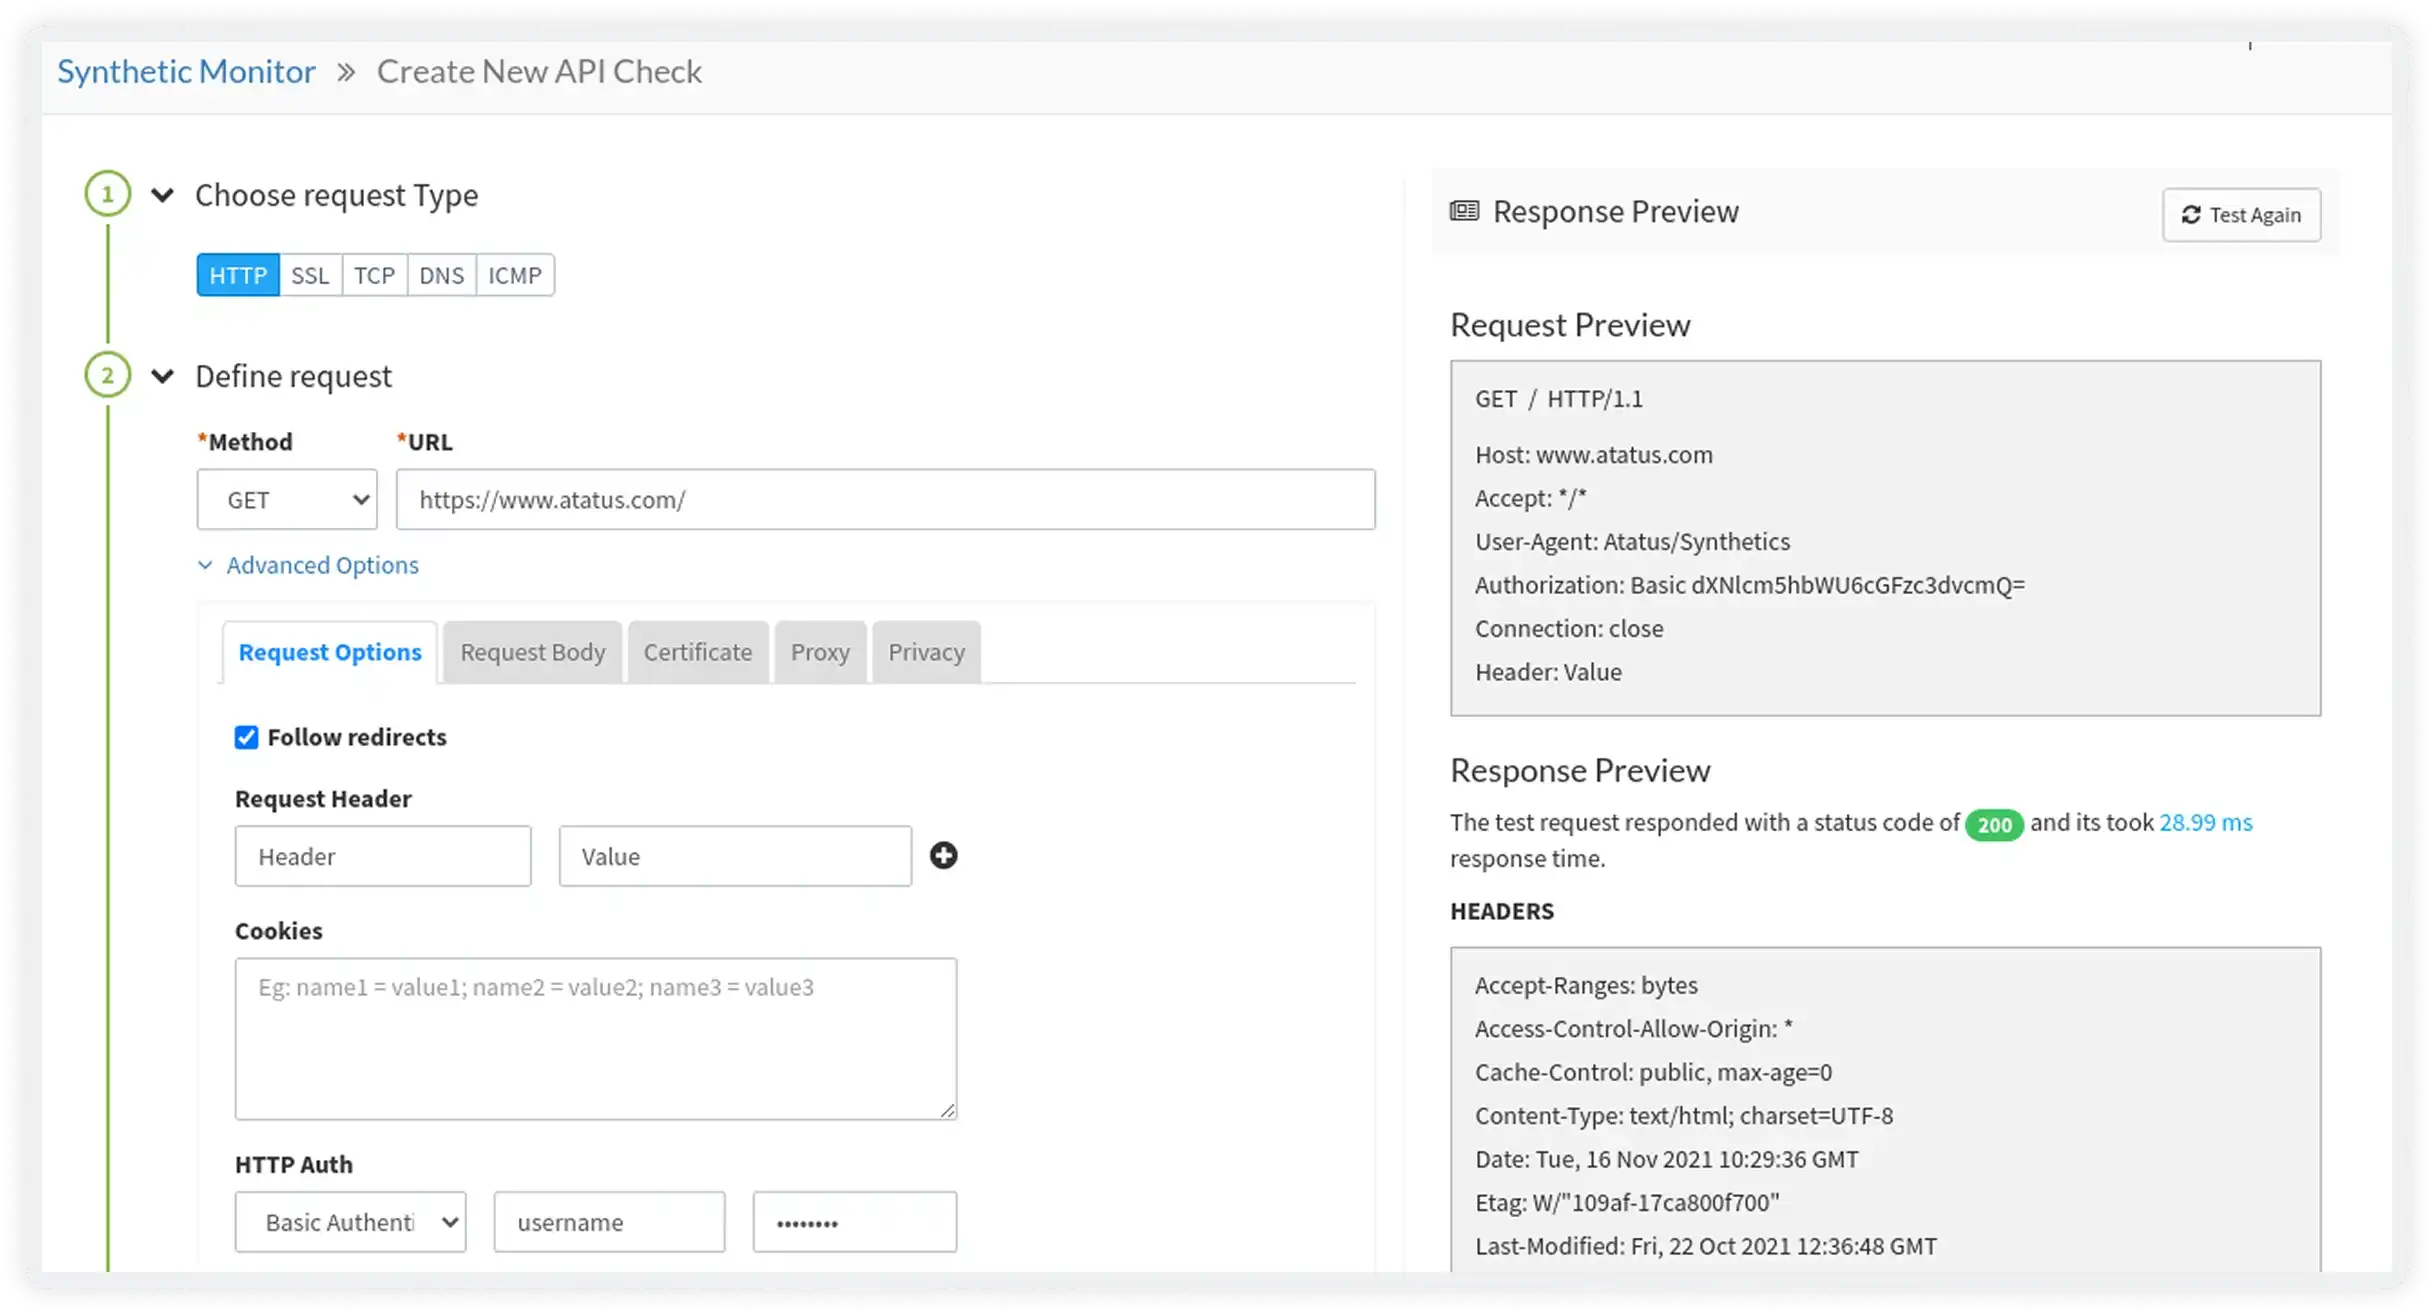
Monitoring Events, Reports, and Incident History
Track monitoring events, check results, incidents, and historical trends in one place to analyze reliability, share reports, and improve incident response over time.
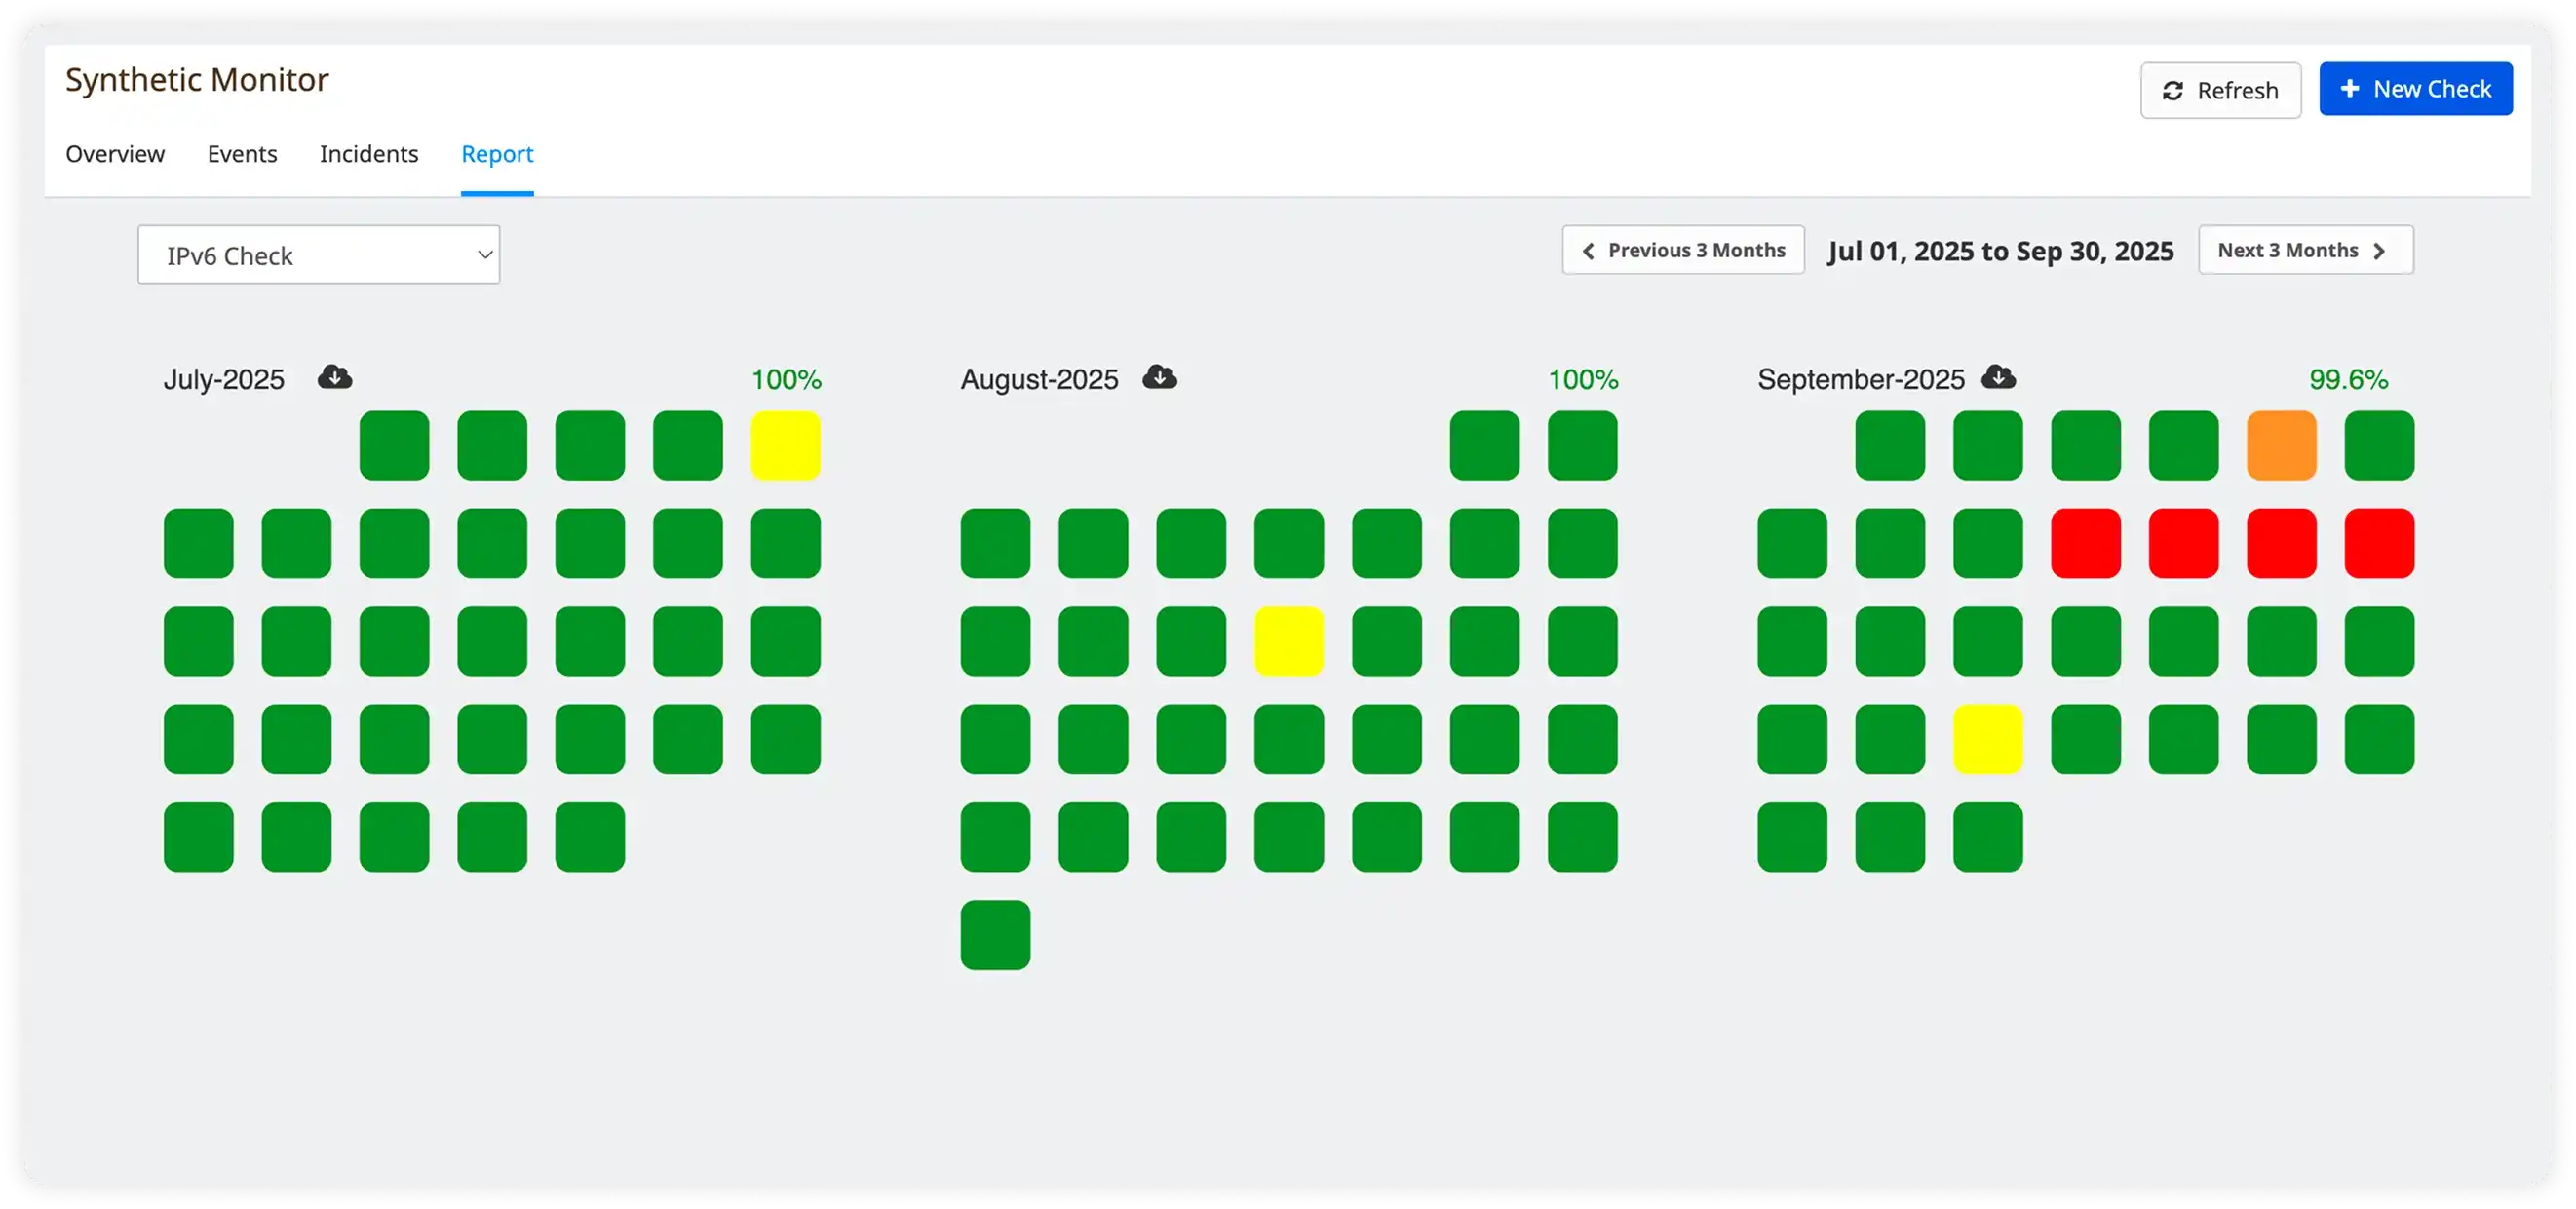
Never Miss a
Downtime Again
Proactive monitoring that detects issues before your users do. Stay online, stay ahead.
24/7 Availability Monitoring
Gain full-stack observability into the quality of your network devices by constantly pinging the network hosts to detect the outages.
Multi-Location Checks
Monitor the availability of any specific ports such as HTTP, SSL, TCP and ICMP at the set frequency from different locations.
Instant Downtime Alerts
Validate request and response headers with Response Integrity Monitoring for precise, reliable data exchange.
Business impact
What engineering teams actually achieve?
Real outcomes from teams using Atatus Synthetic Monitoring in production to protect revenue and reliability.
Faster mean time to resolution
Full stack failure context compresses investigation from 2+ hours to under 20 minutes. No more manual log correlation.
Reduction in false-positive alert noise
Atatus deduplicates and correlates checks across locations - surfacing real failures, not transient network blips.
Time to detect any endpoint failure
Check results, assertion failures, and response data captured automatically. No manual investigation required.
Uptime SLA compliance achievable
Proactive monitoring catches exceptions before they compound. Protect revenue and avoid SLA breach penalties.
Detection to first alert
Real-time alerts fire before users notice anything is wrong. Engineering owns the incident before support gets the call.
Surprises in production
Continuous synthetic checks mean your team knows about every failure, slowdown, and degradation before any customer reports it.
Start Monitoring in Under 5 Minutes
Three simple steps to 24/7 uptime monitoring. No credit card required.
Easy Setup
Deploy and get started within minutes in seeing key site metrics for actionable insights. Just start monitoring website and solving issues now.
Configure Monitoring
Set the desired conditions and test frequency time with the options provided by Atatus to monitor your endpoints.
Get Instant Alerts
Monitor the response time of API and web pages in the all-in-one unified dashboard to ensure your site responds as expected.