
Know Exactly Why Your APIs Are Slow, Failing, or Costing You Customers
Simulate user interaction with Synthetic(Uptime) Monitoring to test your website or Atatus API Analytics provides instant visibility into API health, detects slowdowns before they impact users, and helps you deliver flawless digital experiences.
65%
Response Optimization
30s
Error Detection
4×
Root Cause Analysis
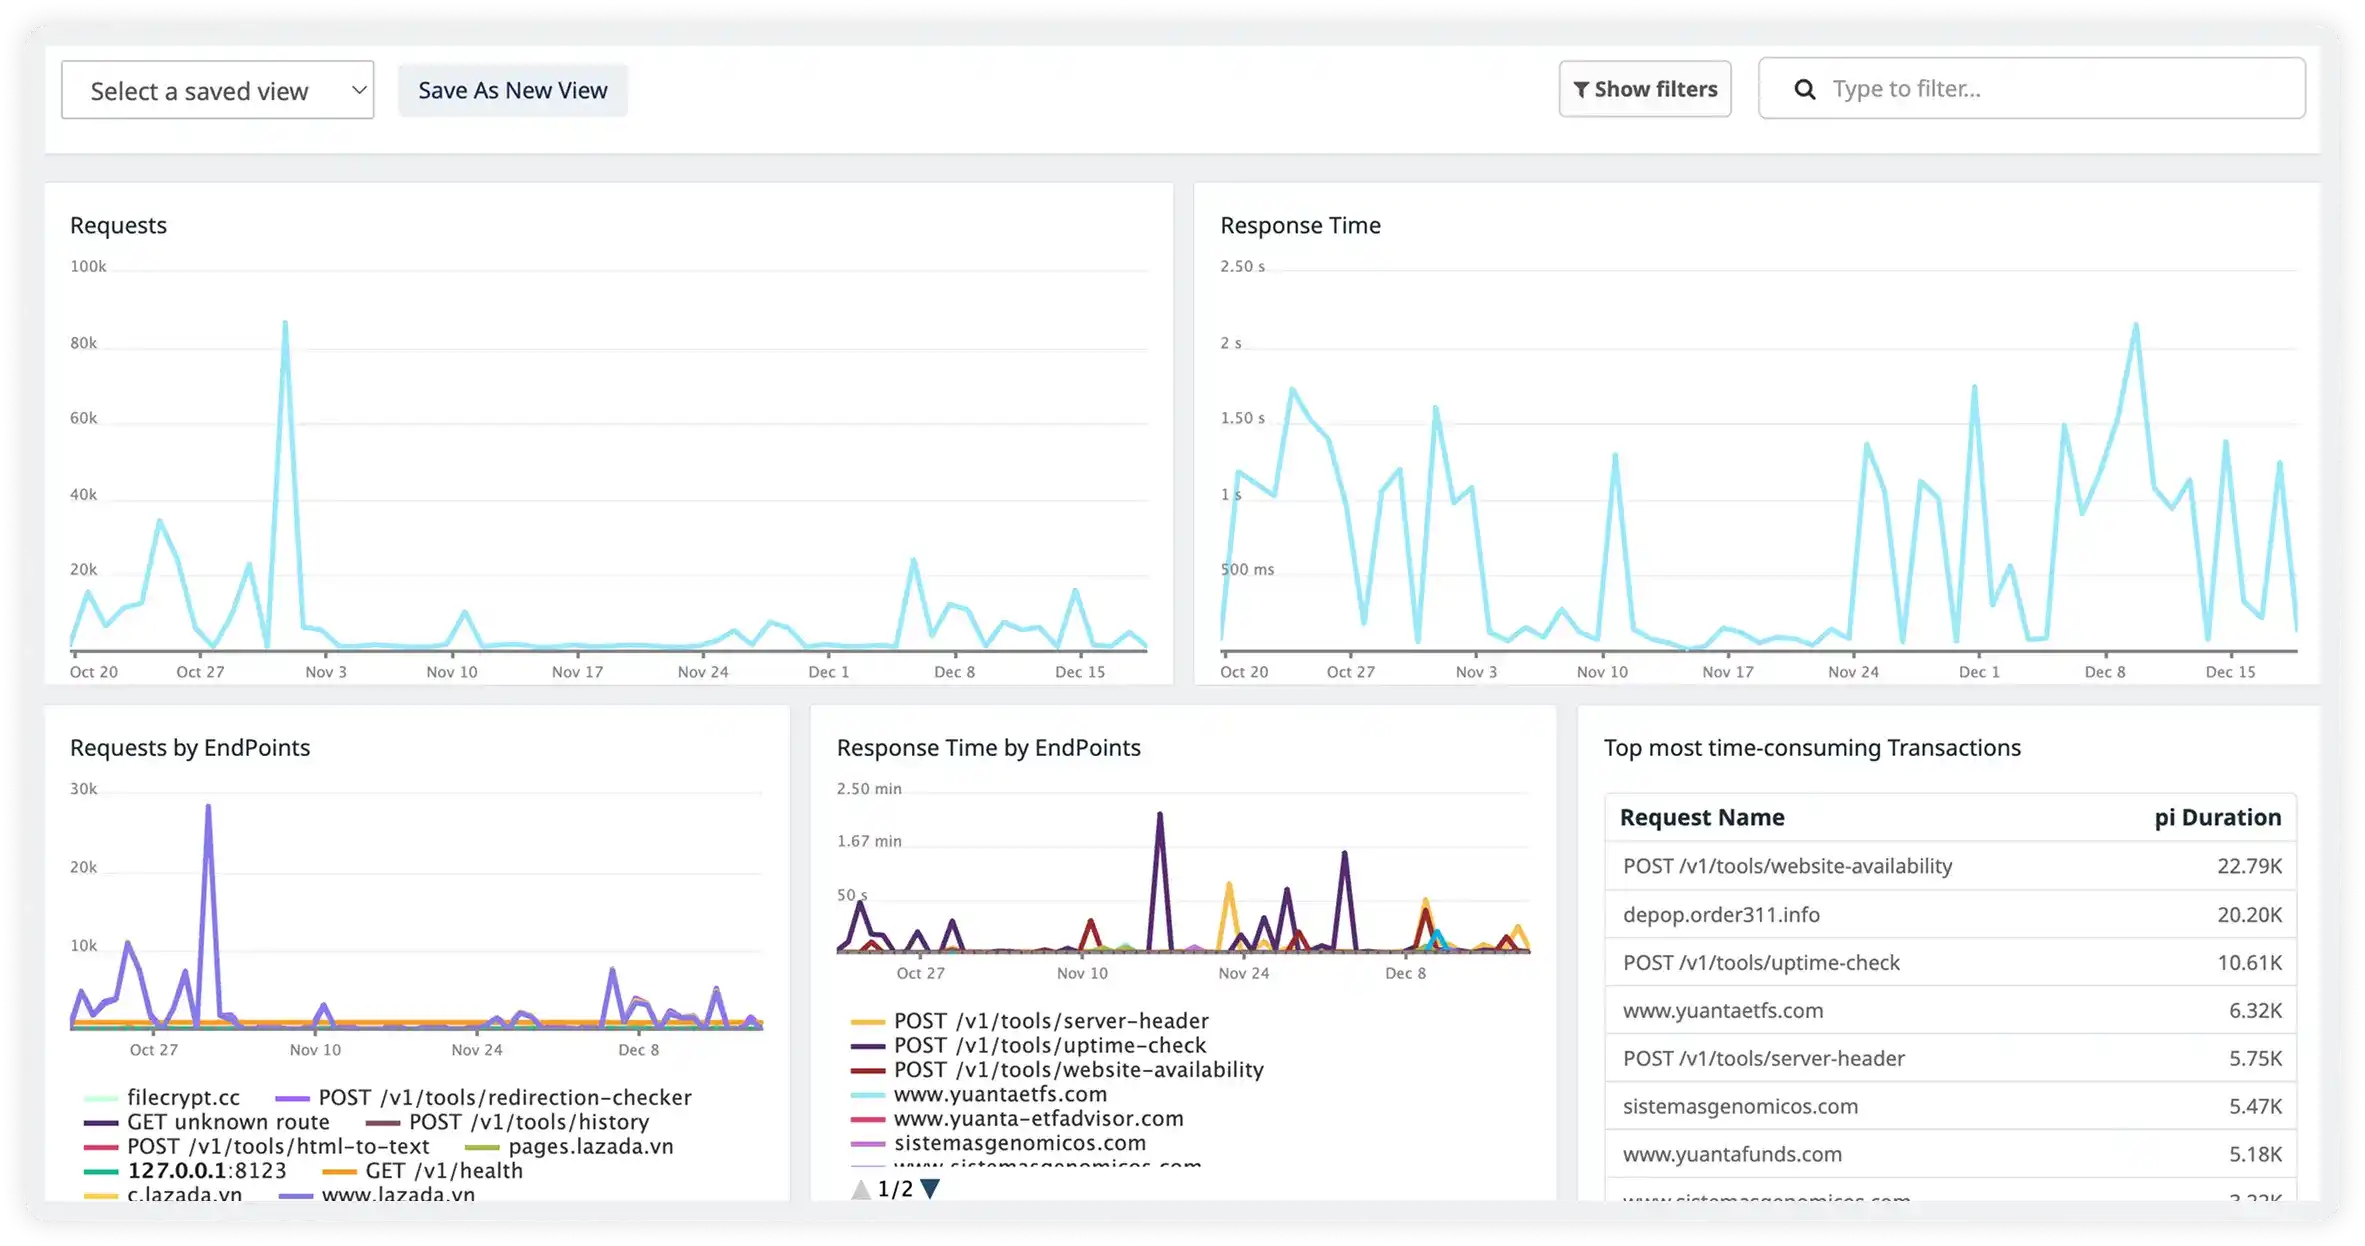
Everything Engineering Teams Need for Full API Observability
From REST API monitoring to GraphQL performance, from request-level tracing to SLA alerting. Atatus covers every dimension of API analytics.
Real-Time API Response Time Monitoring
Track mean, median, P95, and P99 latency per endpoint in real time. Instantly pinpoint slow API calls dragging down user experience before users notice the lag. API latency tracking across every request.
API Traffic Analytics & Throughput
Understand your API traffic analytics including request volume spikes, traffic distribution by endpoint, geographic usage patterns, and peak-load behavior. Plan capacity before it becomes an incident.
API Dependency Visibility
Map every downstream API call your services make. See third-party API performance, external service latency, and dependency health, so you know if that checkout slowdown is your code or Stripe's. True API observability requires seeing the whole chain.
Performance Trends Over Time
View week-over-week, month-over-month API performance monitoring trends. Detect gradual latency creep before it becomes a P1 incident. Compare API behavior across releases to catch performance regressions instantly.
Root Cause Analysis for API Slowdowns
When an API slows or fails, Atatus traces the issue back to its source - a slow database query, a memory-starved container, a breaking third-party dependency, or a code regression. Get answers in seconds, not hours of log-grepping.
Developer-Friendly Dashboards & Alerts
Pre-built dashboards for API analytics that are actually useful out of the box. Customize views by endpoint, team, service, or customer. Set smart alert thresholds, get Slack and PagerDuty notifications, and spend less time in the tool, more time fixing things.
Everything You Need to
Monitor Your APIs
Complete API analytics and monitoring features that help you deliver exceptional API experiences
Dedicated API Analytics for Deep API Insights
Atatus offers API Analytics as a standalone product, giving deep visibility into every API, request pattern, and payload behavior. Track API usage, performance, and shaping to understand how APIs are consumed and optimized.
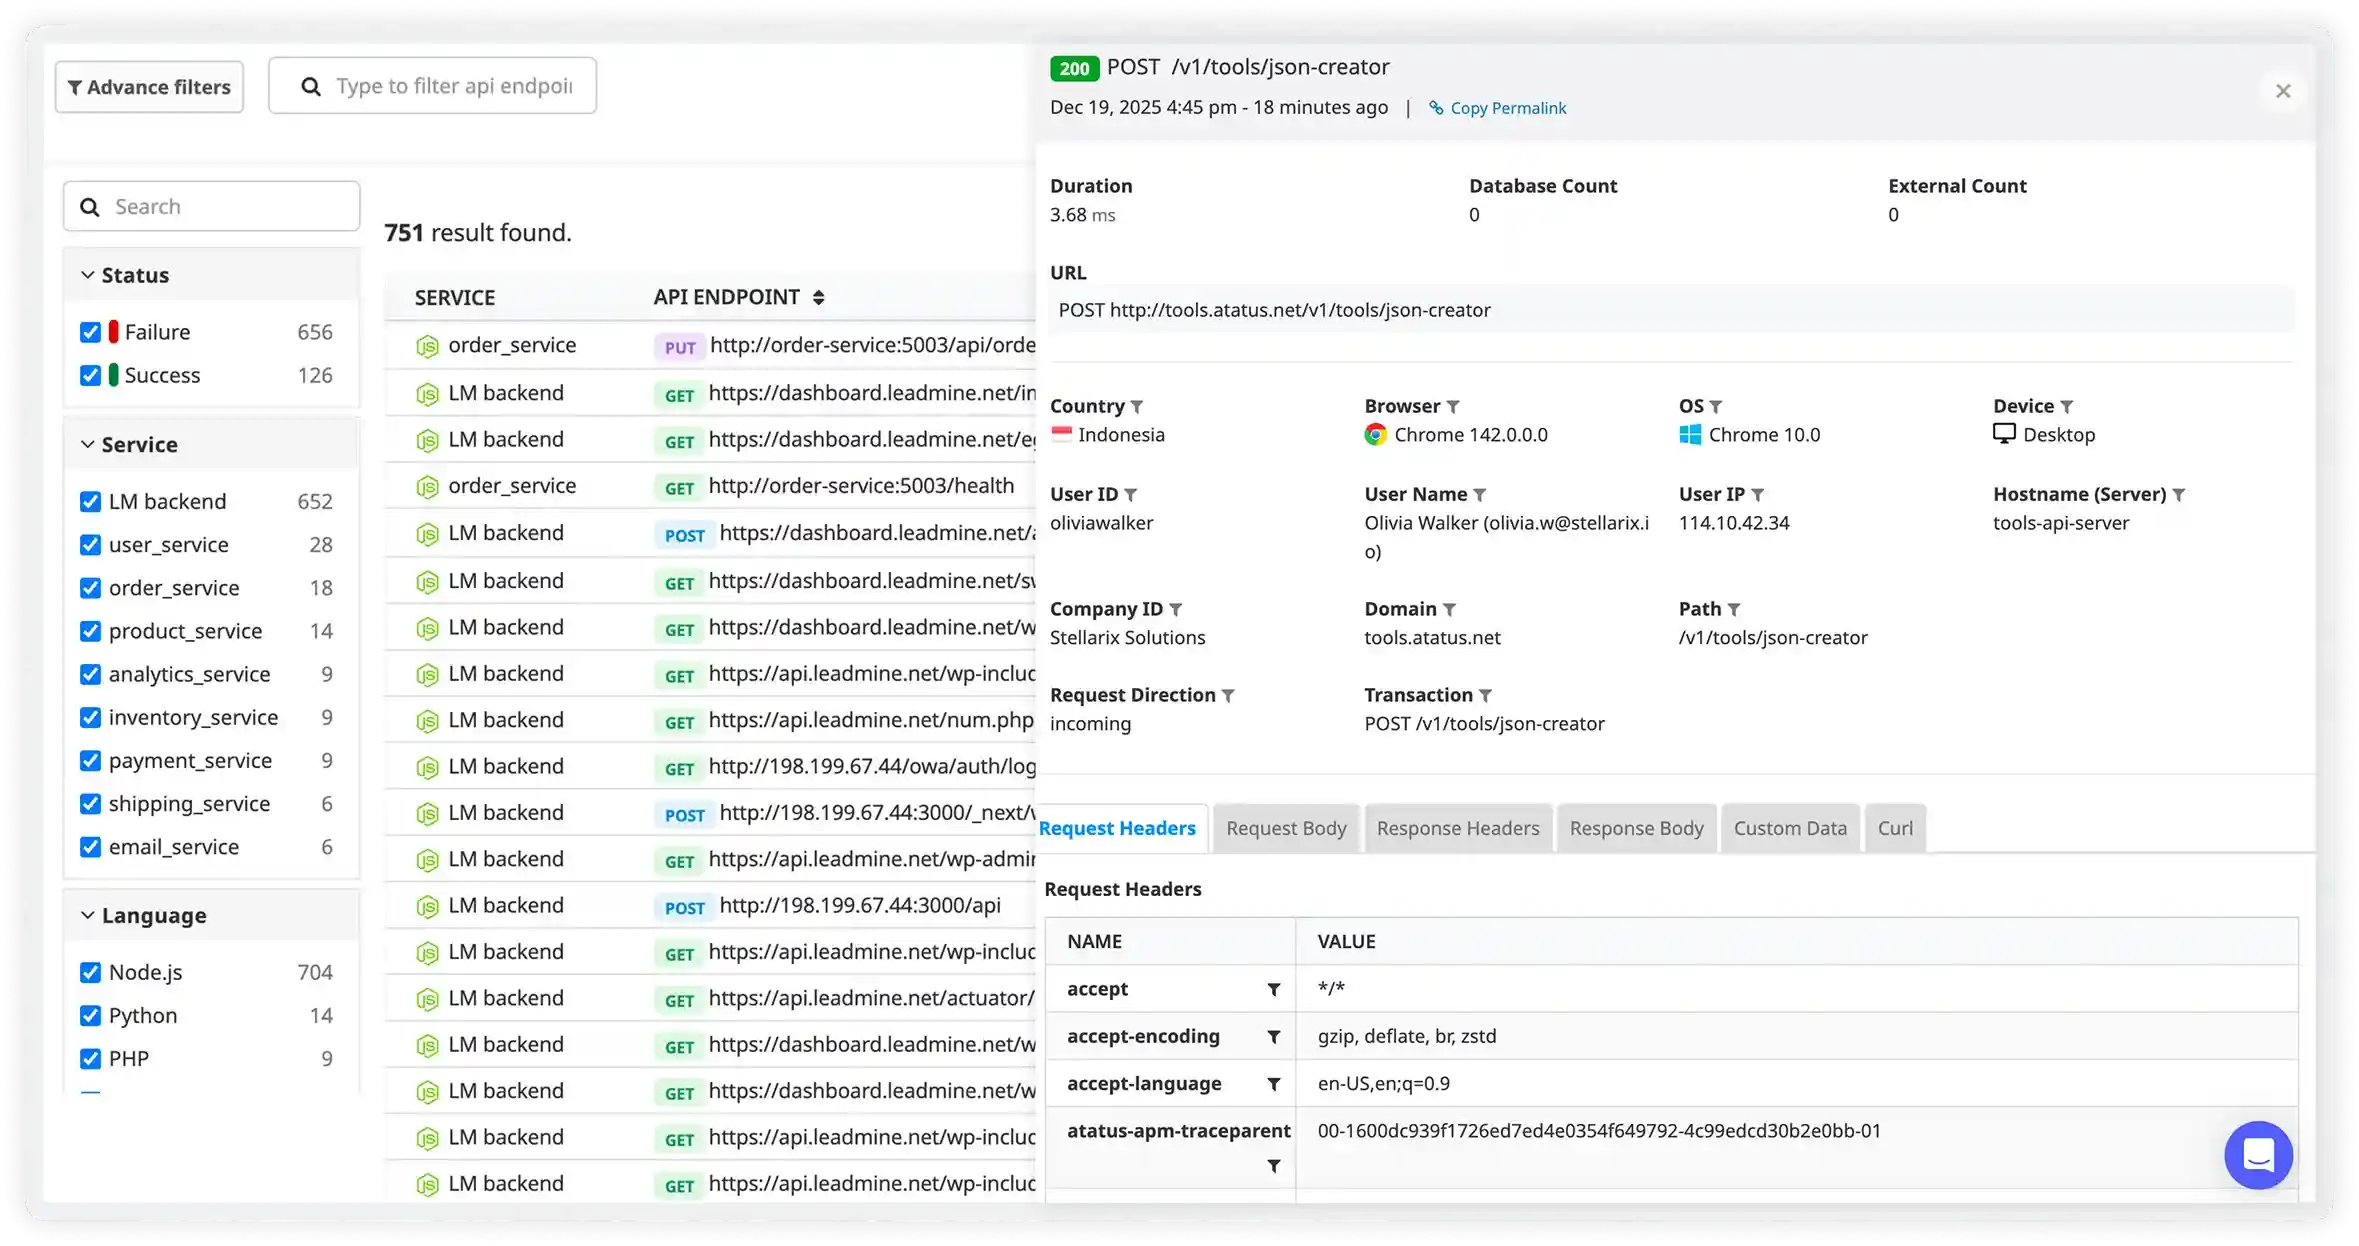
Endpoint-level Performance Intelligence
Monitor each API endpoint with detailed metrics on response time, throughput, and latency trends. Quickly identify slow or overloaded endpoints that directly impact application performance and user experience.
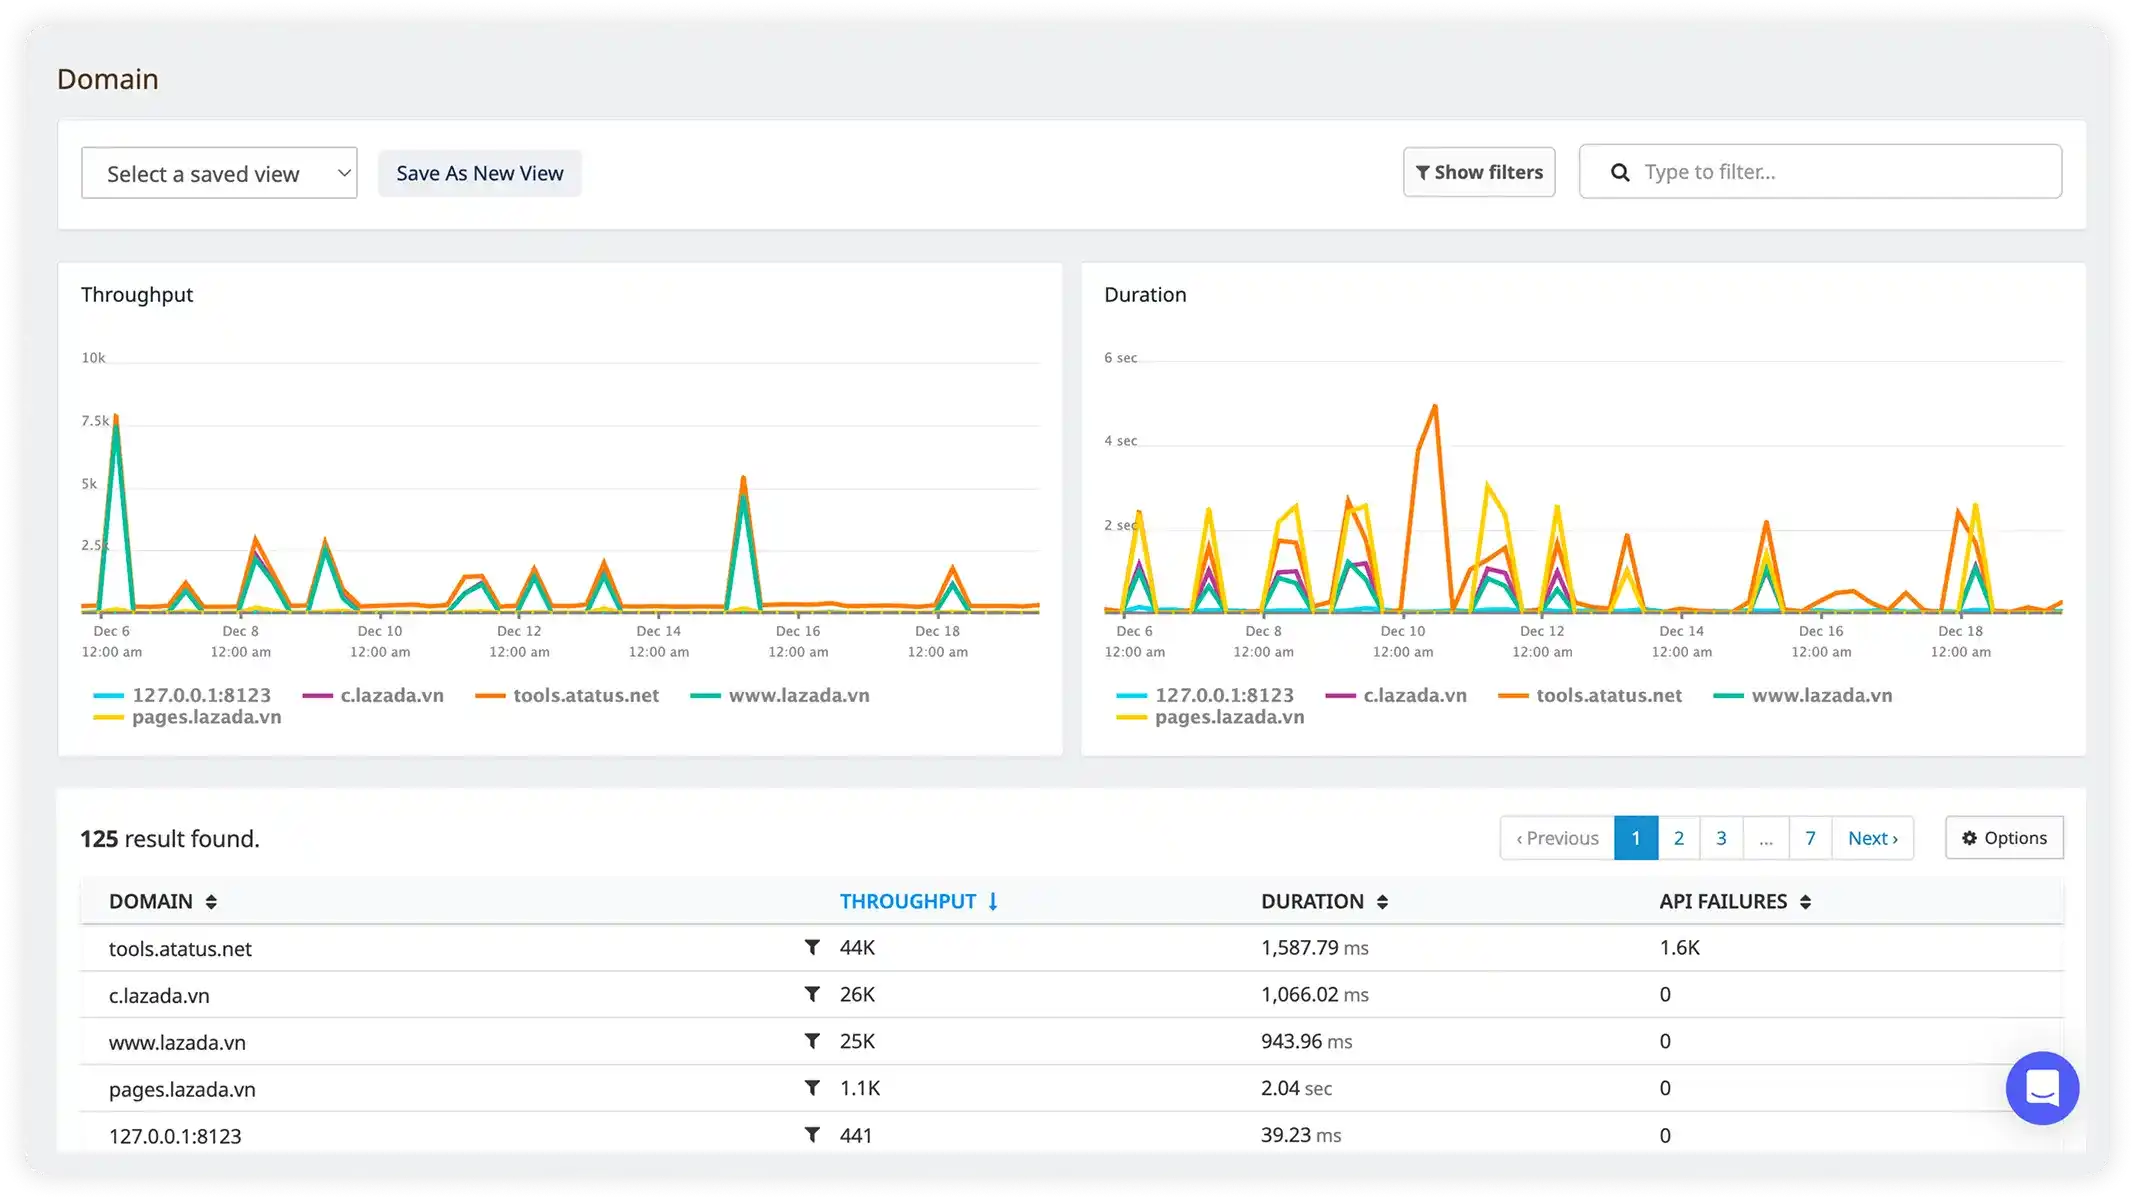
Real-Time API Request and Failure Tracking
Track every incoming and outgoing API request with error rates and status codes in real time. Instantly detect failed or unstable APIs and resolve issues before they affect downstream services or users.
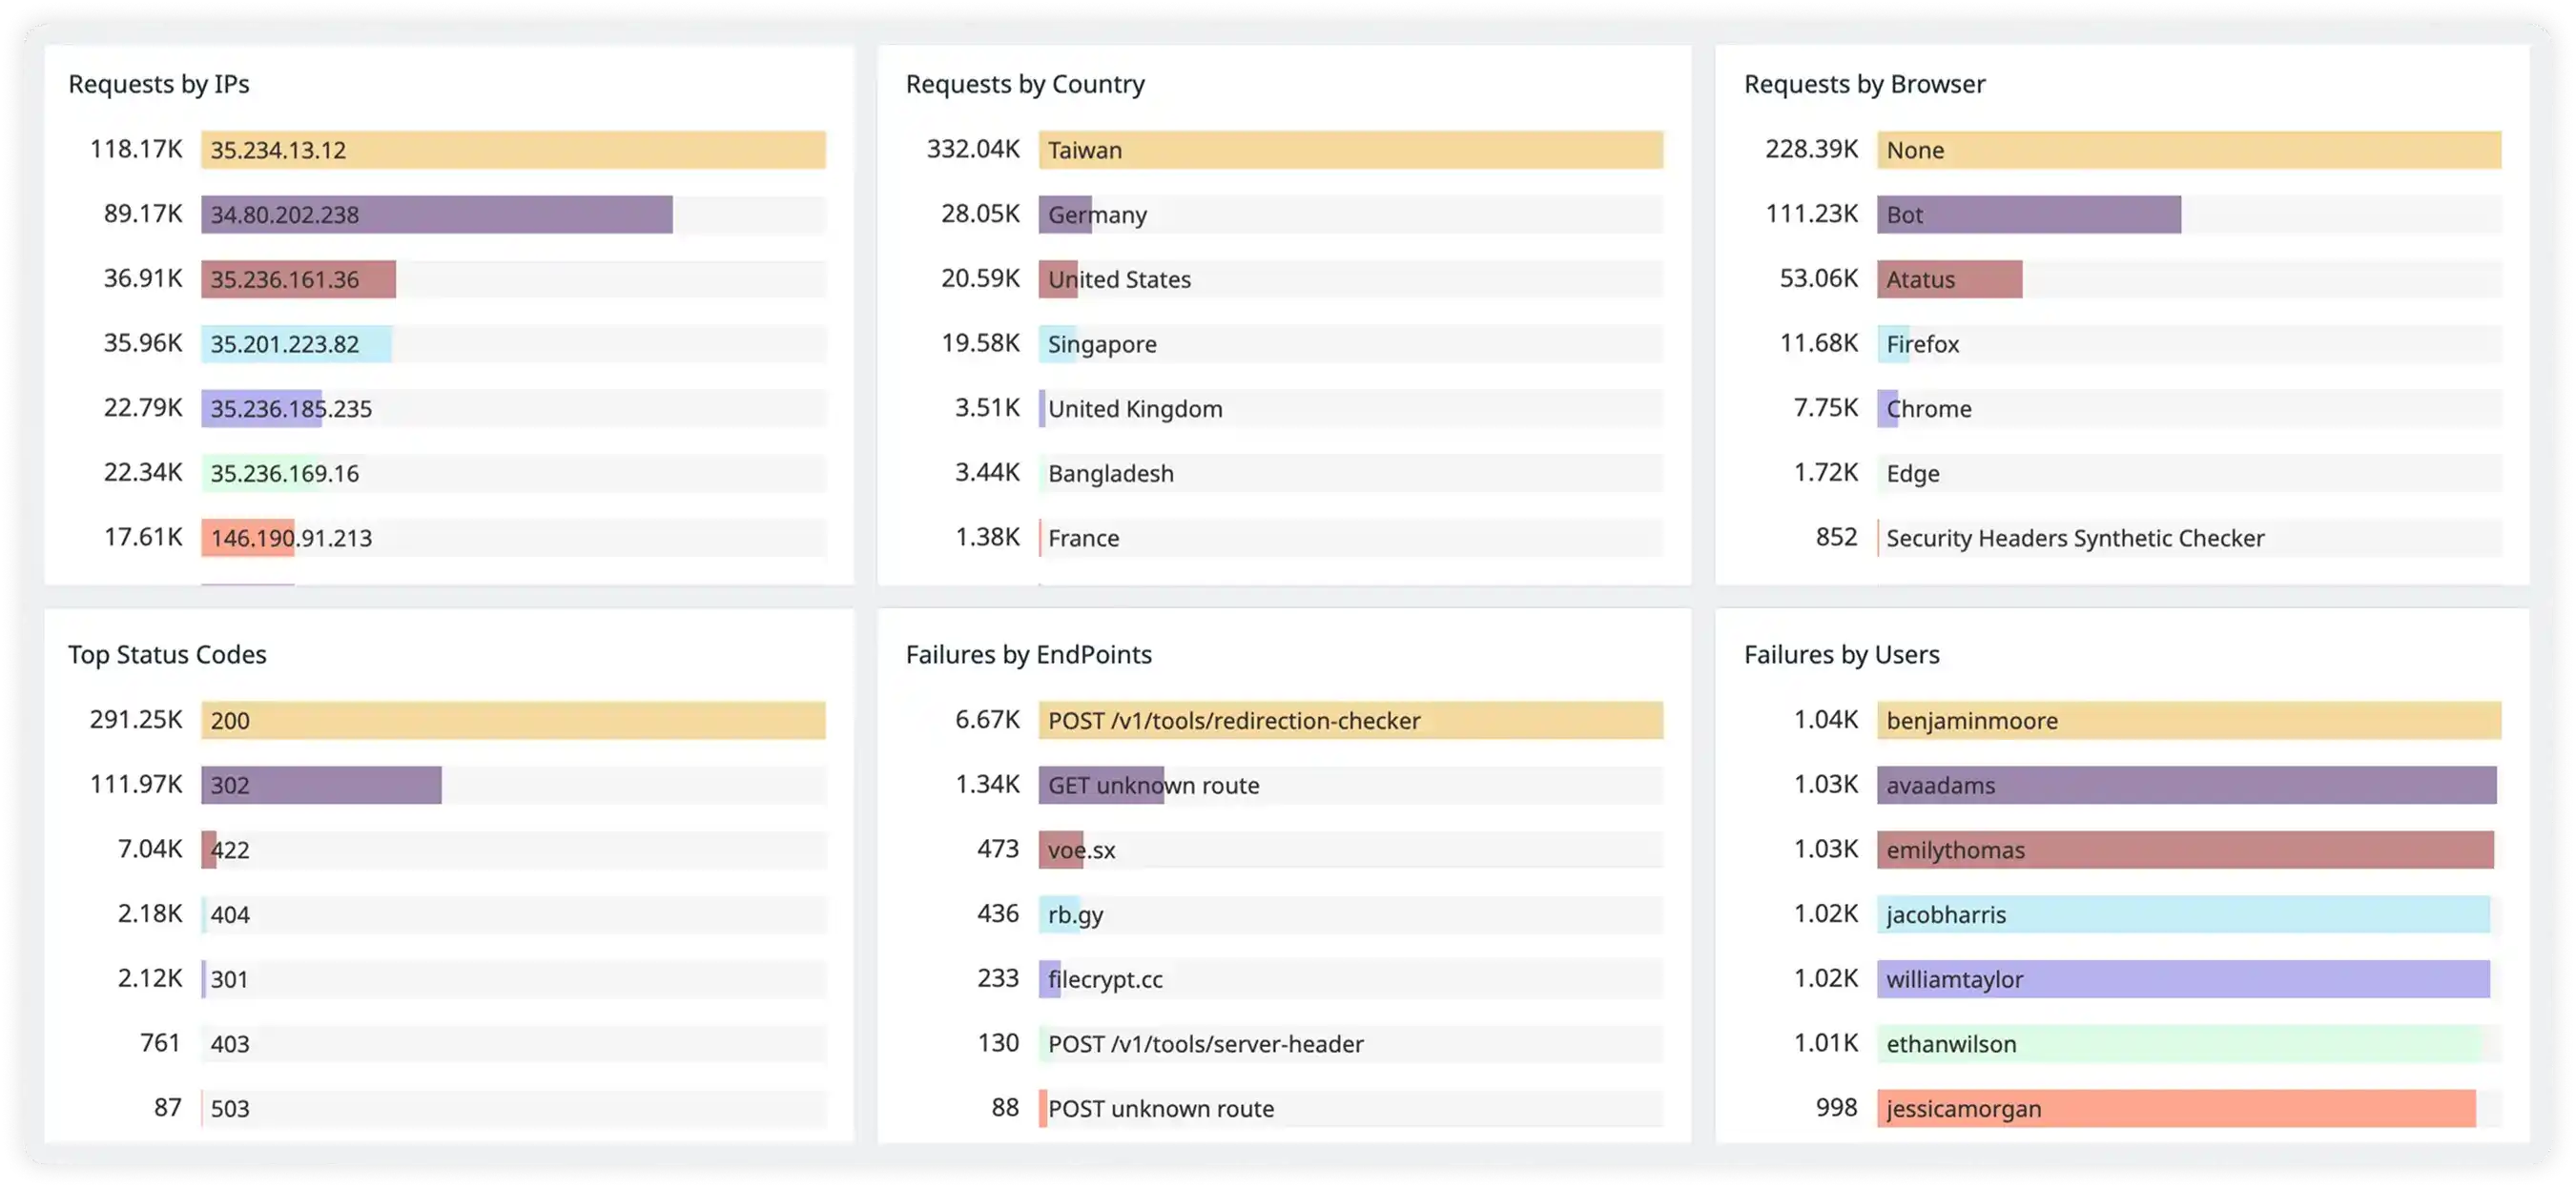
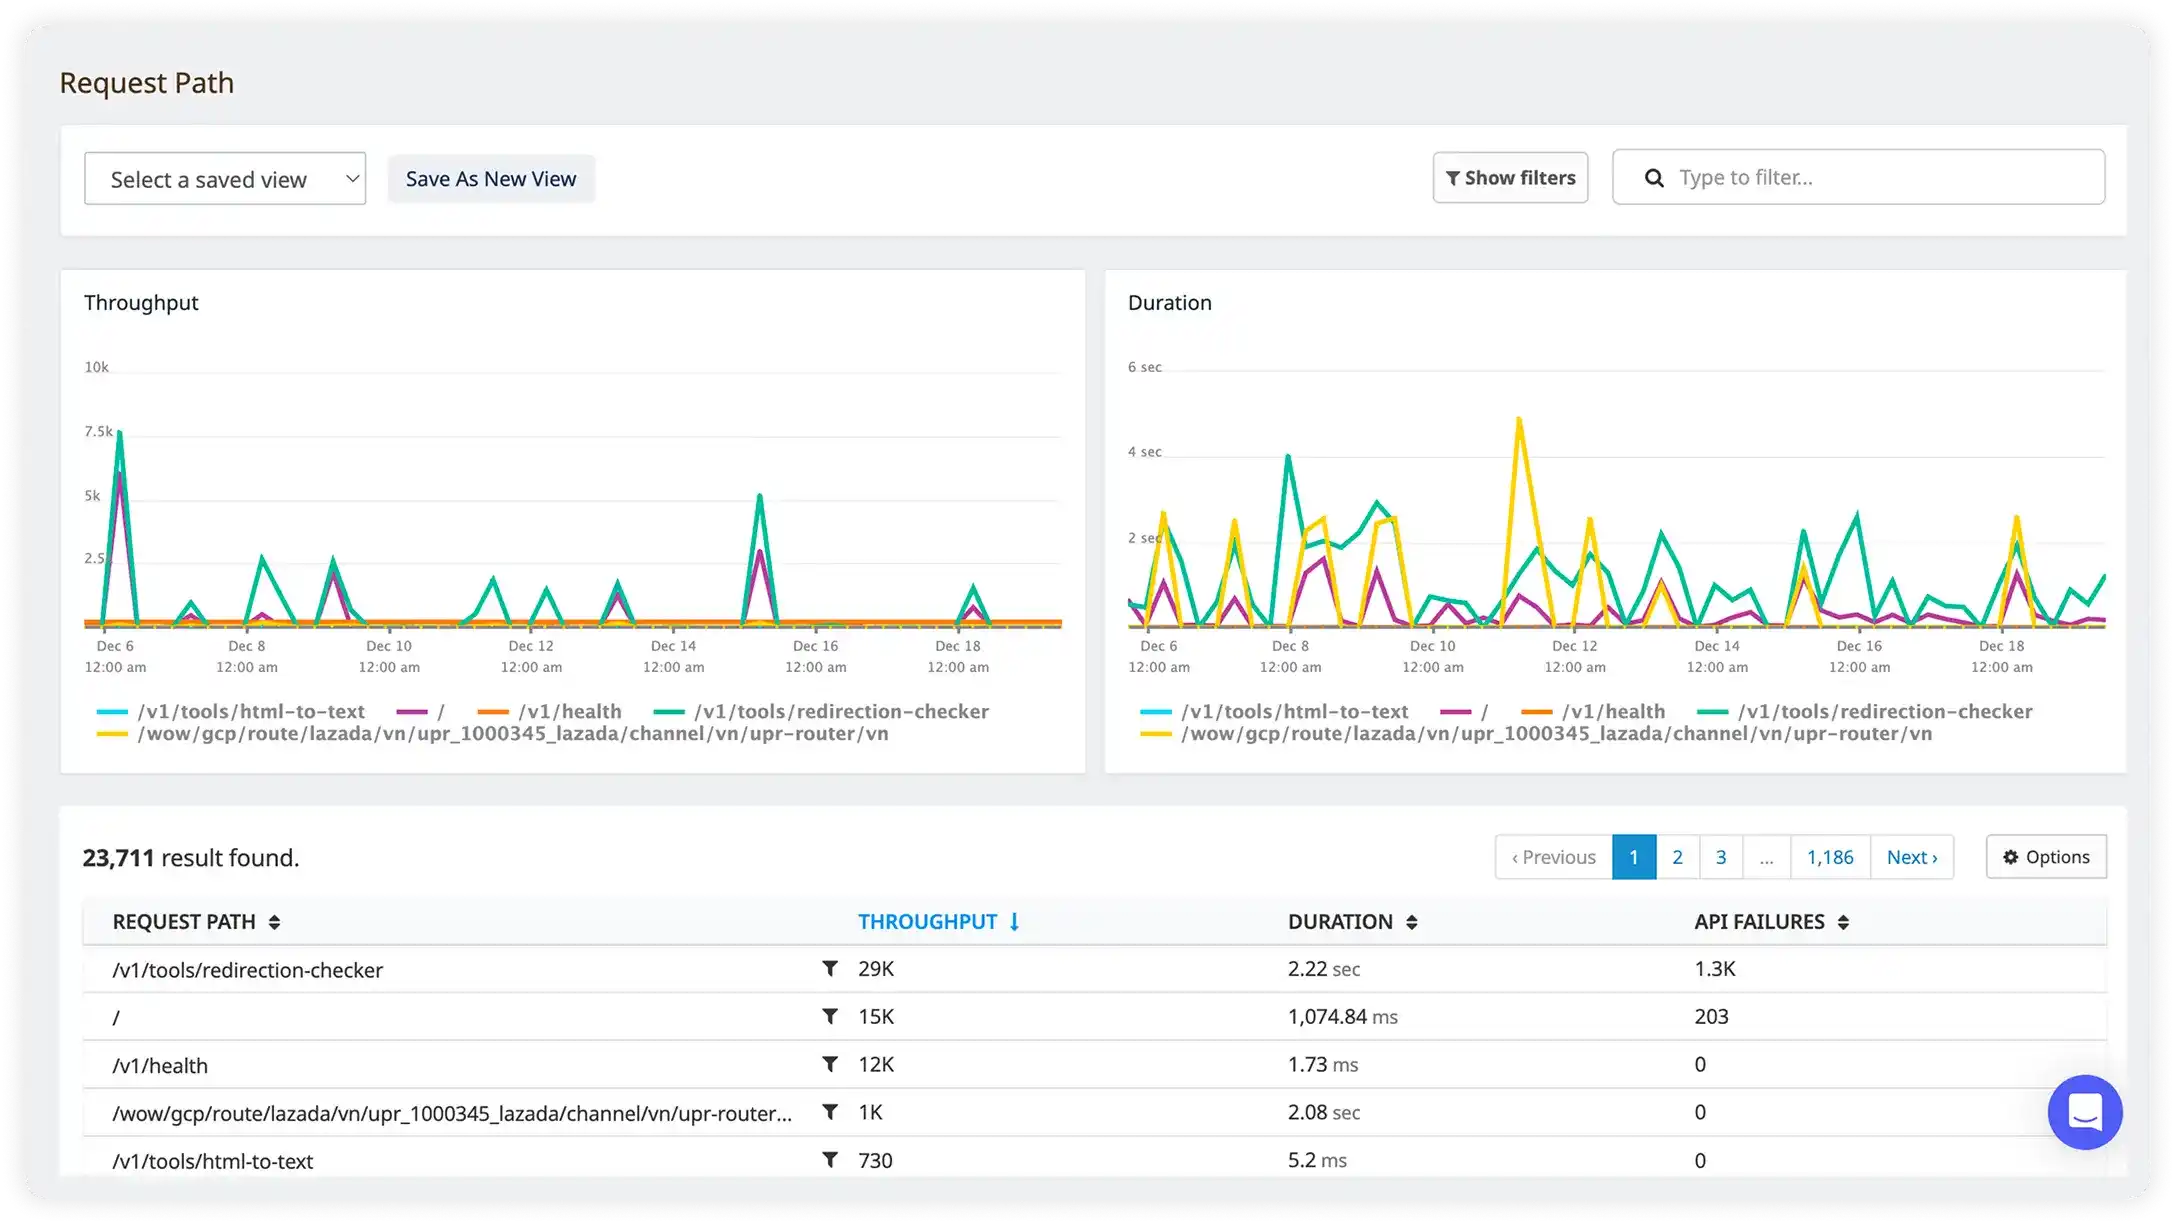
API Shaping and Request Path Intelligence
Analyze APIs by domain, request paths, and engineering ownership to understand real usage patterns. Shape APIs based on traffic, behavior, and performance data to design cleaner, more reliable APIs.
Purpose-Built API Observability,
Not an Afterthought
Generic APM tools bolt on API monitoring as a feature. Atatus API Analytics is a dedicated product built around how engineering teams actually debug, optimize, and scale APIs.
Endpoint-Level Root Cause Analysis
Drill into individual API endpoints to identify slow database calls, dependency failures, or code-level bottlenecks. Stop guessing, trace every API slowdown back to its exact origin in seconds.
Complete API Observability, Zero Configuration
Auto-instrument REST, GraphQL, and WebSocket APIs with a single SDK install. No manual tagging, no YAML files for every endpoint. Full API observability including throughput, latency, errors, dependencies from minute one.
On-Premises Deployment & Data Sovereignty
For teams that can't send API traffic analytics to a third-party cloud. Run the full Atatus API monitoring stack on your own infrastructure with same features and your data never leaves your environment.
Built for Teams Who Ship APIs and Care About Reliability
Whether you're running microservices, a public API platform, or a monolith with dozens of REST endpoints. Atatus API monitoring adapts to how you work.
Prevent Checkout API Failures from Killing Revenue
Your /checkout and /payment APIs are revenue-critical. With Atatus API performance monitoring, teams get real-time alerts when checkout endpoint latency crosses 800ms, error rates creep above 1%, or a third-party payment gateway starts degrading. Catch it before a customer tweets about it.
Know Which APIs Your Customers Actually Use
Planning to deprecate an endpoint? Need to understand which customers will break? API usage analytics in Atatus tracks per-endpoint consumption by user, plan tier, and geography. Make informed deprecation decisions, set accurate rate limits, and build usage-based pricing backed by real data.
Debug Cascading Failures Across Distributed APIs
When one service goes down in a distributed system, the failure cascades silently. Atatus API observability traces every request across service boundaries, maps dependency chains, and surfaces exactly where latency originates. Stop blaming the wrong service in post-mortems.
Catch API Performance Regressions Before Deployment
Compare API response time benchmarks across releases. When a deploy ships slower endpoint performance, Atatus flags it automatically against the pre-deploy baseline. No more discovering regressions from angry users, catch them at rollout time with intelligent API analytics alerting.
Start Monitoring in Under 5 Minutes
Three simple steps to complete API visibility. No credit card required.
Add Instrumentation
Integrate Atatus with your backend using supported SDKs or OpenTelemetry. It works with REST, GraphQL, and internal APIs, requiring just a few lines of code to begin.
Start Capturing API Metrics
Atatus automatically tracks API performance, error rates, request volumes, payload sizes, and downstream dependencies with every request.
Monitor API Performance
Log in to your Atatus dashboard to analyze trends, spot anomalies, and drill into traces. View breakdowns by endpoint, response status, geography, or custom attributes.
API analytics in Atatus is what we didn't know we needed. We could finally answer 'which endpoints are our top customers actually hitting most?' and 'which APIs are causing our billing support tickets?' The per-customer breakdown changed how our product team thinks about the roadmap.