
Smart Crash Detection for Developers Who Ship Fast
Get real-time error tracking, detailed stack traces, and instant root cause analysis with Atatus Crash Detection to minimize downtime and fix errors faster.
<30s
Error detection latency from occurrence
70%
Faster mean time to resolution
99.9%
Crash-free session rate achievable
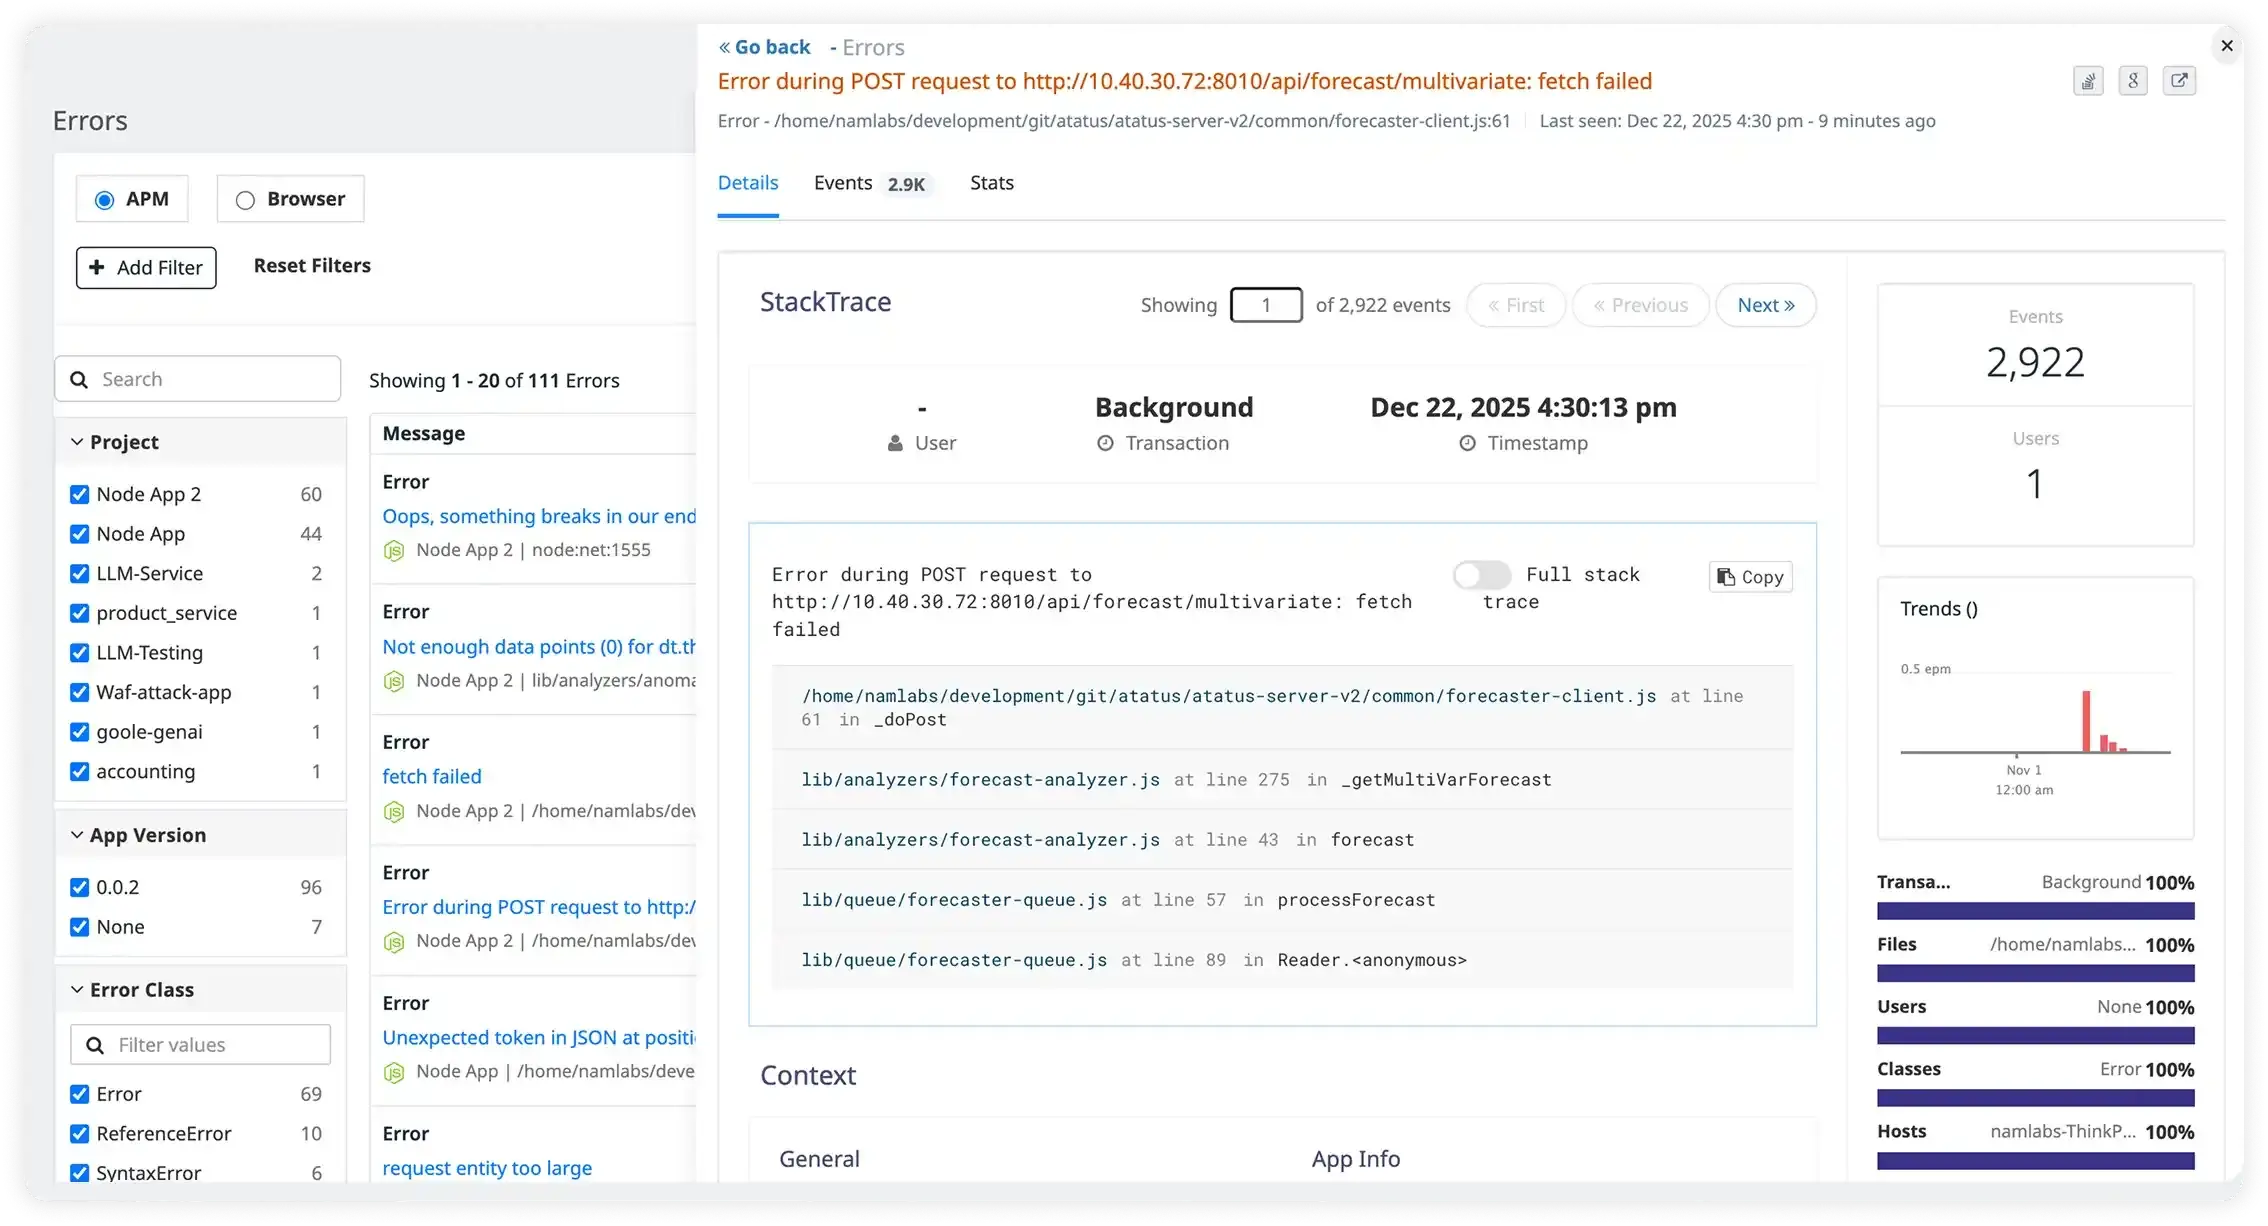
Everything your team needs to own the entire error lifecycle
From exception tracking to production debugging, every tool built for developer speed.
Real-Time Error Detection
Capture every exception, unhandled rejection, and runtime error the moment it occurs in production across all environments, services, and languages. Zero sampling. Zero lag. Sub-30-second detection latency.
Full Stack Traces with Source Maps
See exactly where and why every error occurred. Source map support automatically deobfuscates minified production JavaScript, giving you readable file names, function names, and line numbers even from compiled bundles.
Intelligent Error Grouping
Stop drowning in duplicate alerts. Atatus fingerprints and groups similar errors automatically, surfacing the 47 real issues hiding inside 10,000 noise events. Prioritize what actually matters to users and revenue.
Full User & Request Context
Every error comes packaged with the complete picture: what the user was doing, prior breadcrumb trail, HTTP request details, browser/OS/device, custom attributes, and environment variables. Reproduce bugs in minutes, not days.
Smart Alerting & Escalation
Configure threshold-based or anomaly-based real-time error alerts. Route by severity, service, or environment. Integrate directly with Slack, PagerDuty, OpsGenie, Jira, and email. Alert on new errors, spikes, or regressions after a deploy.
Root Cause Analysis
Atatus surfaces correlated signals across APM traces, logs, and infrastructure metrics to identify the upstream cause of every error spike. Distinguish between app bugs, dependency failures, and infrastructure exhaustion automatically.
Everything You Need to
Track & Fix Errors
Production-ready error tracking features that help you ship faster with confidence
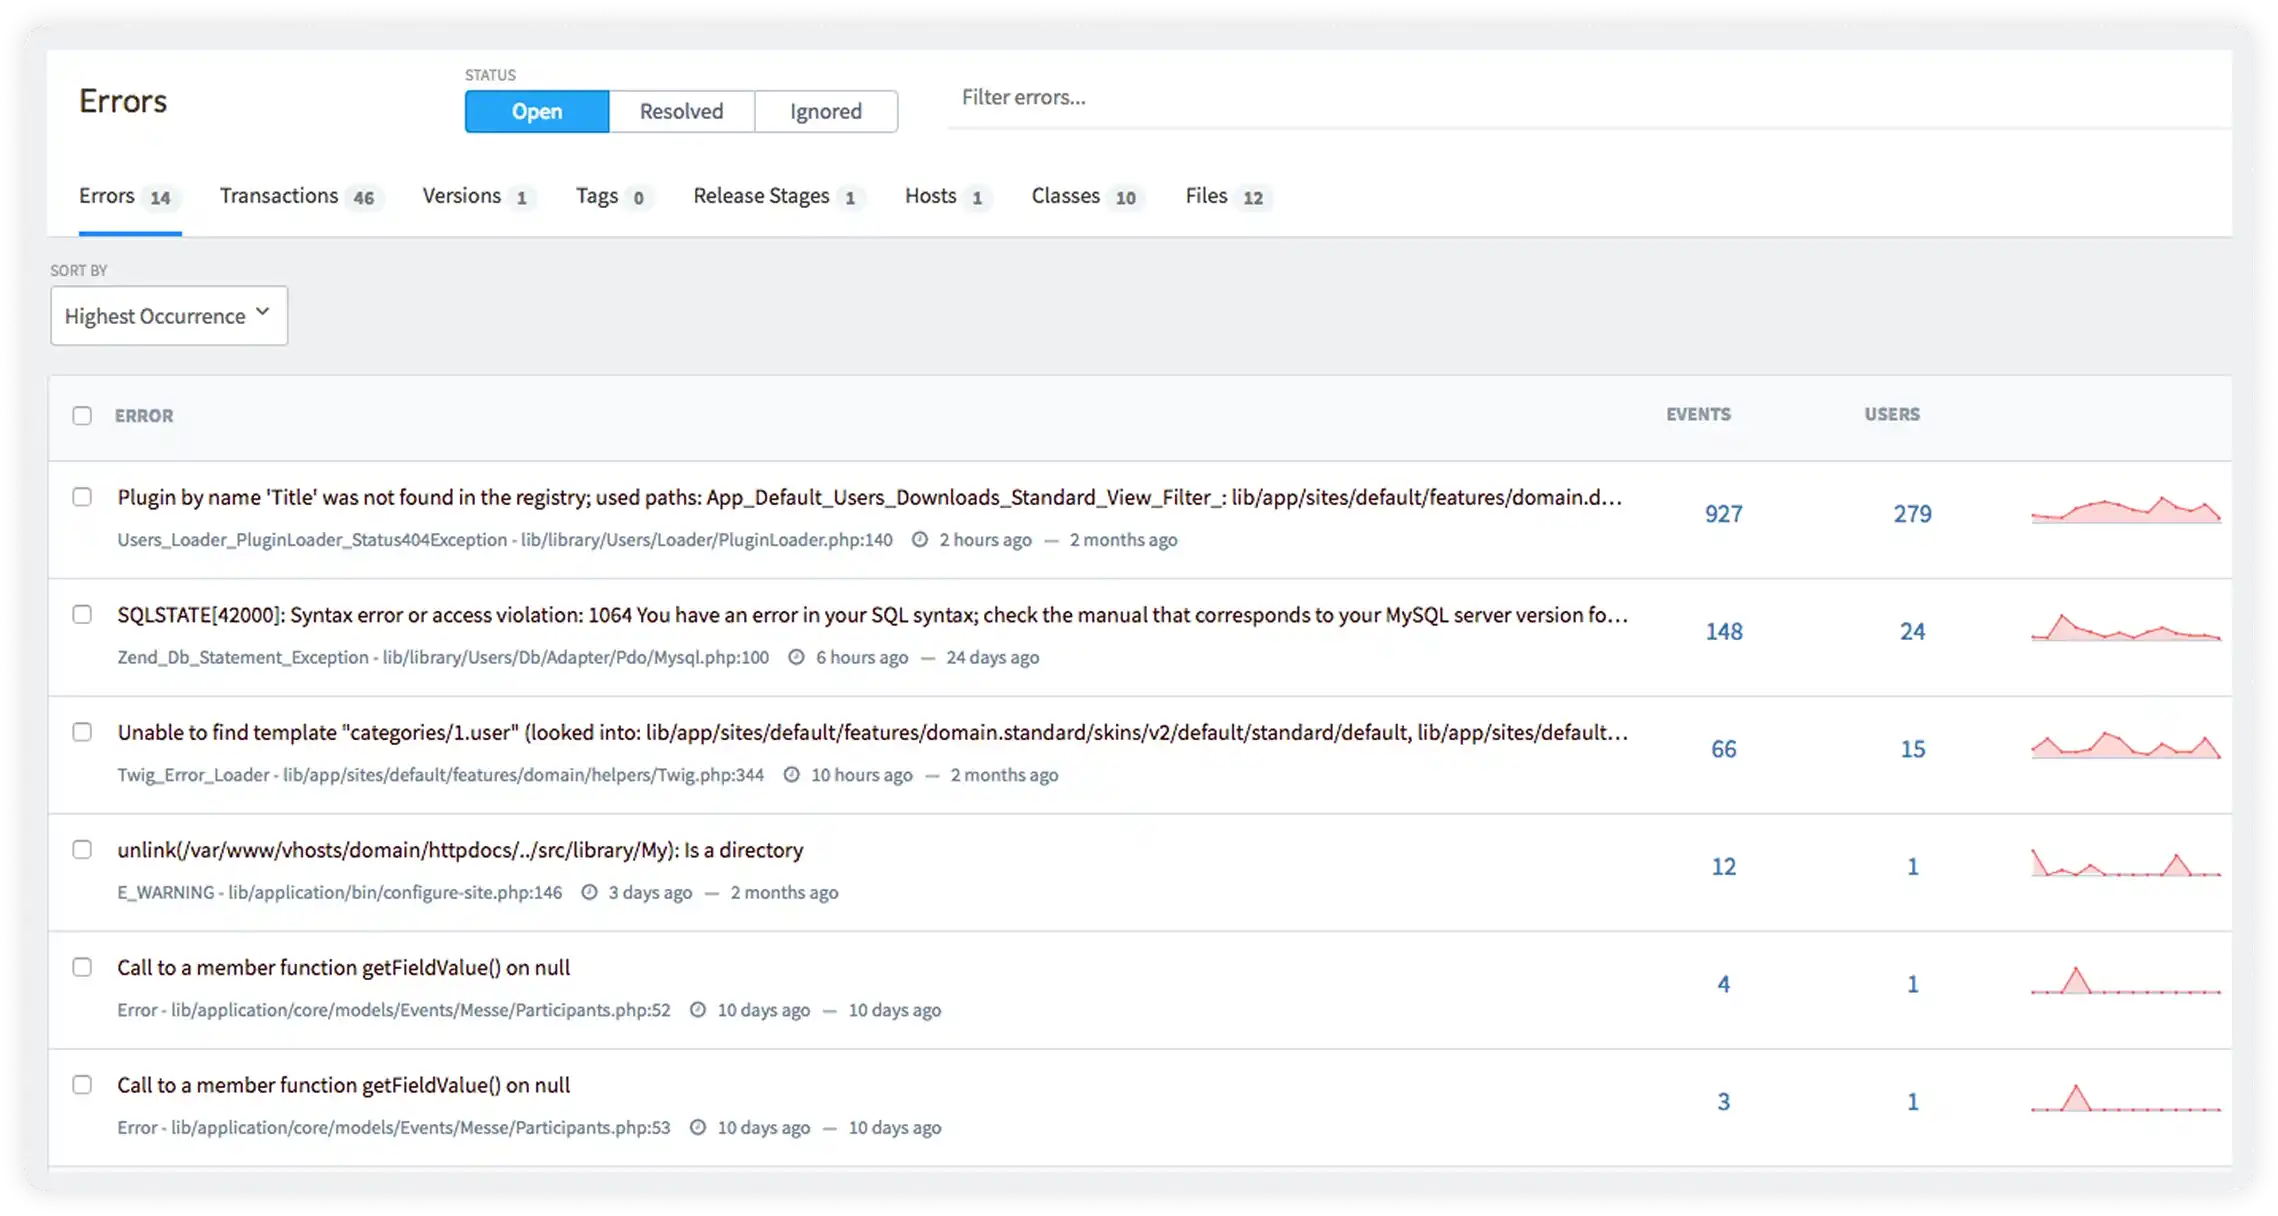
Complete Error Visibility
Monitor every error across your applications and services in a single view, with automatic grouping to reduce noise and highlight the most impactful issues instantly.
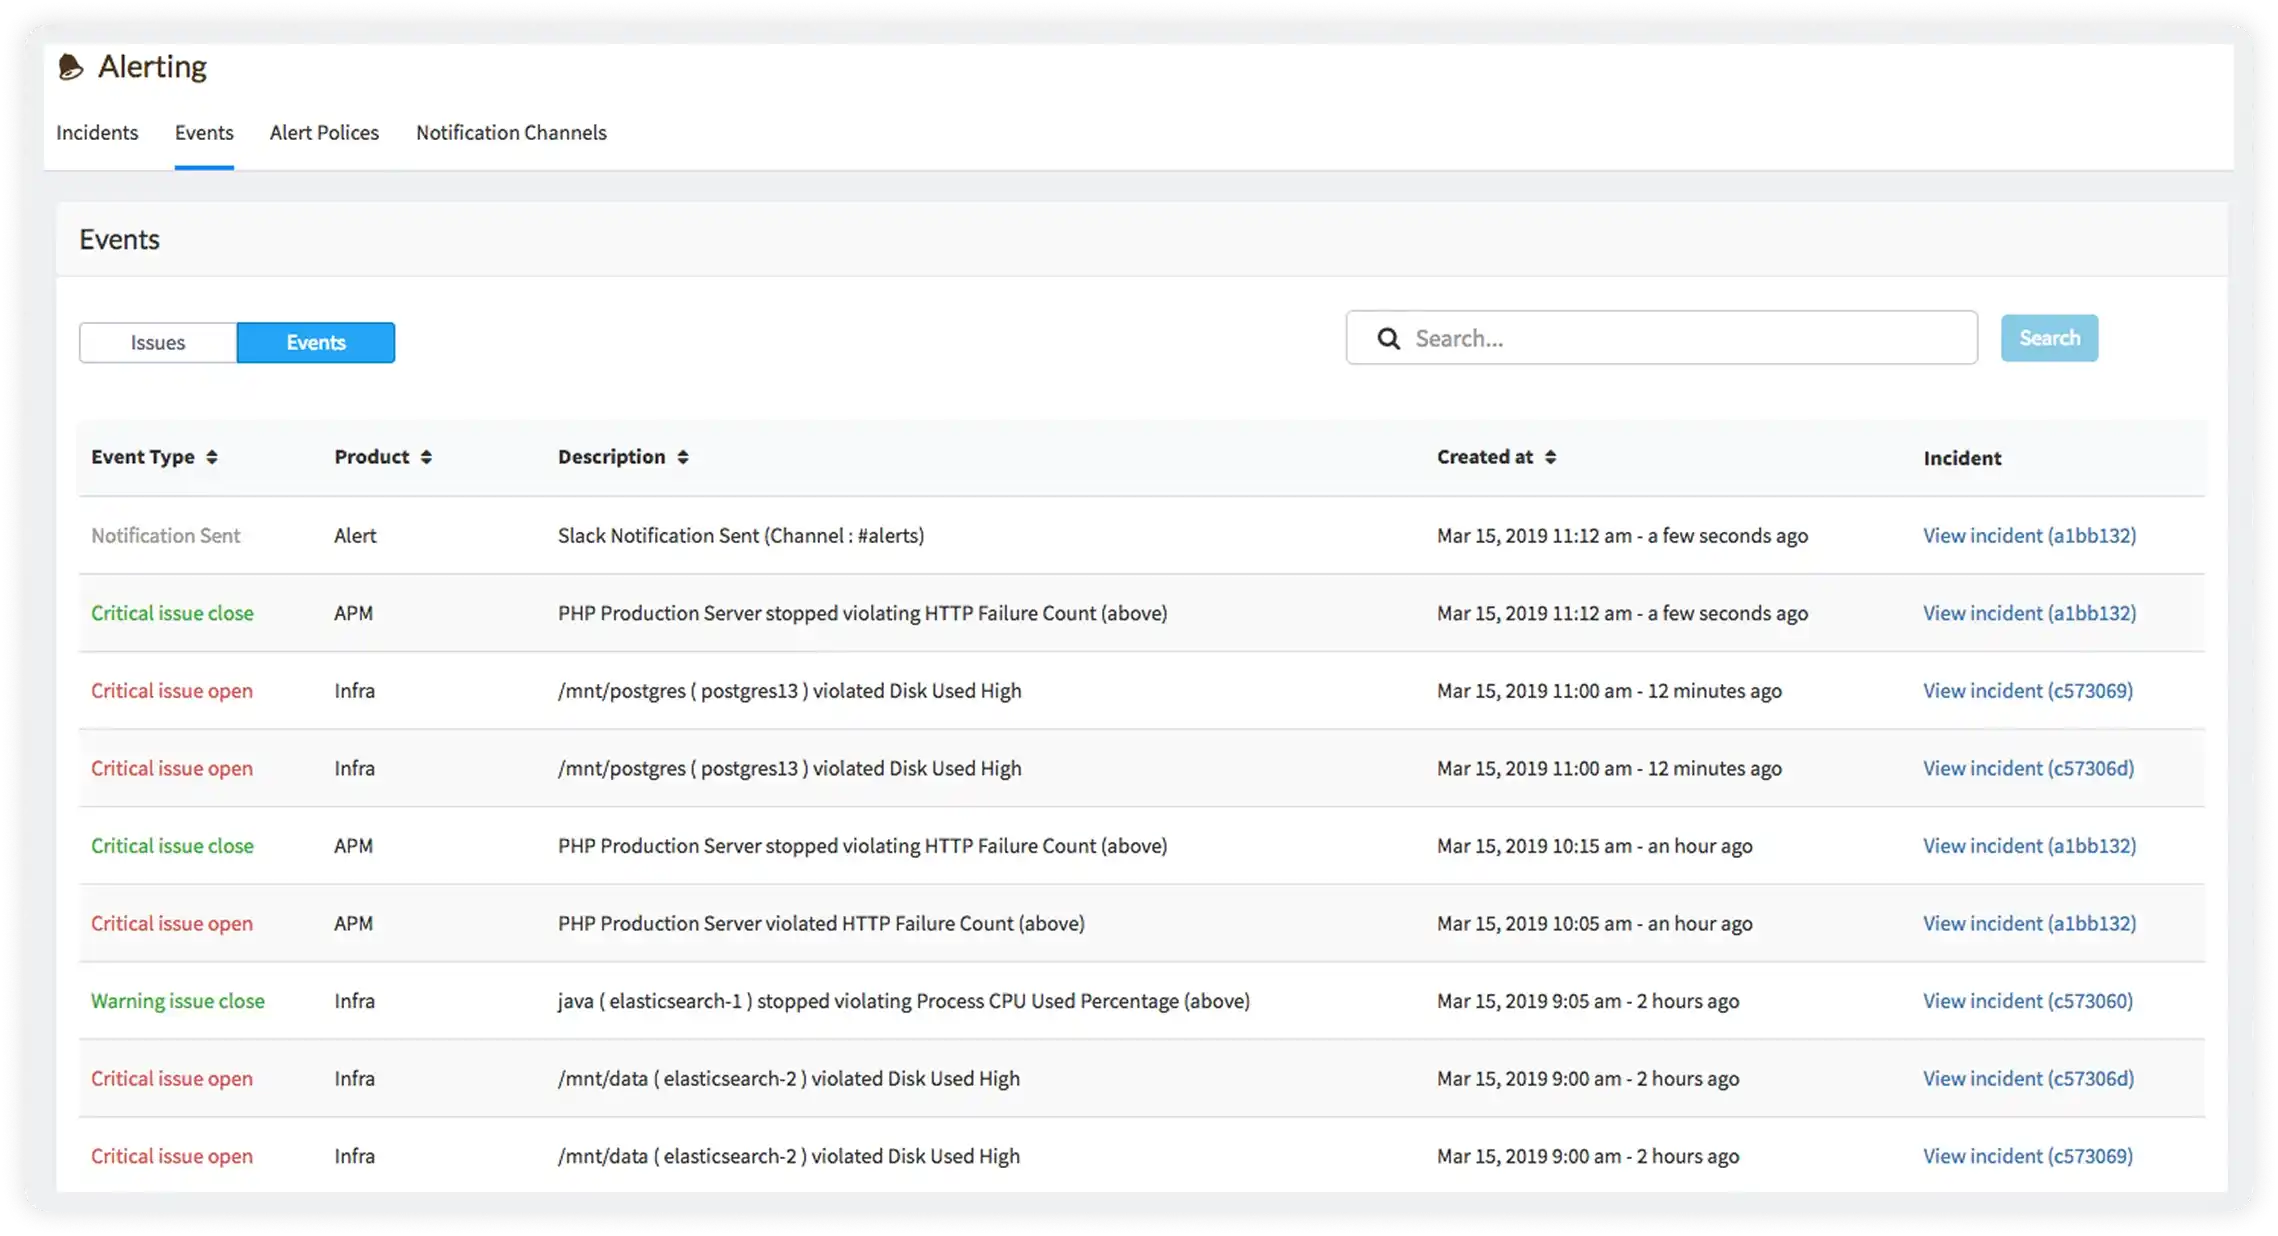
Deep Error Context and Triage
Access detailed stack traces, metadata, and environment info for each error, making it easier to diagnose root causes and fix issues quickly and accurately.
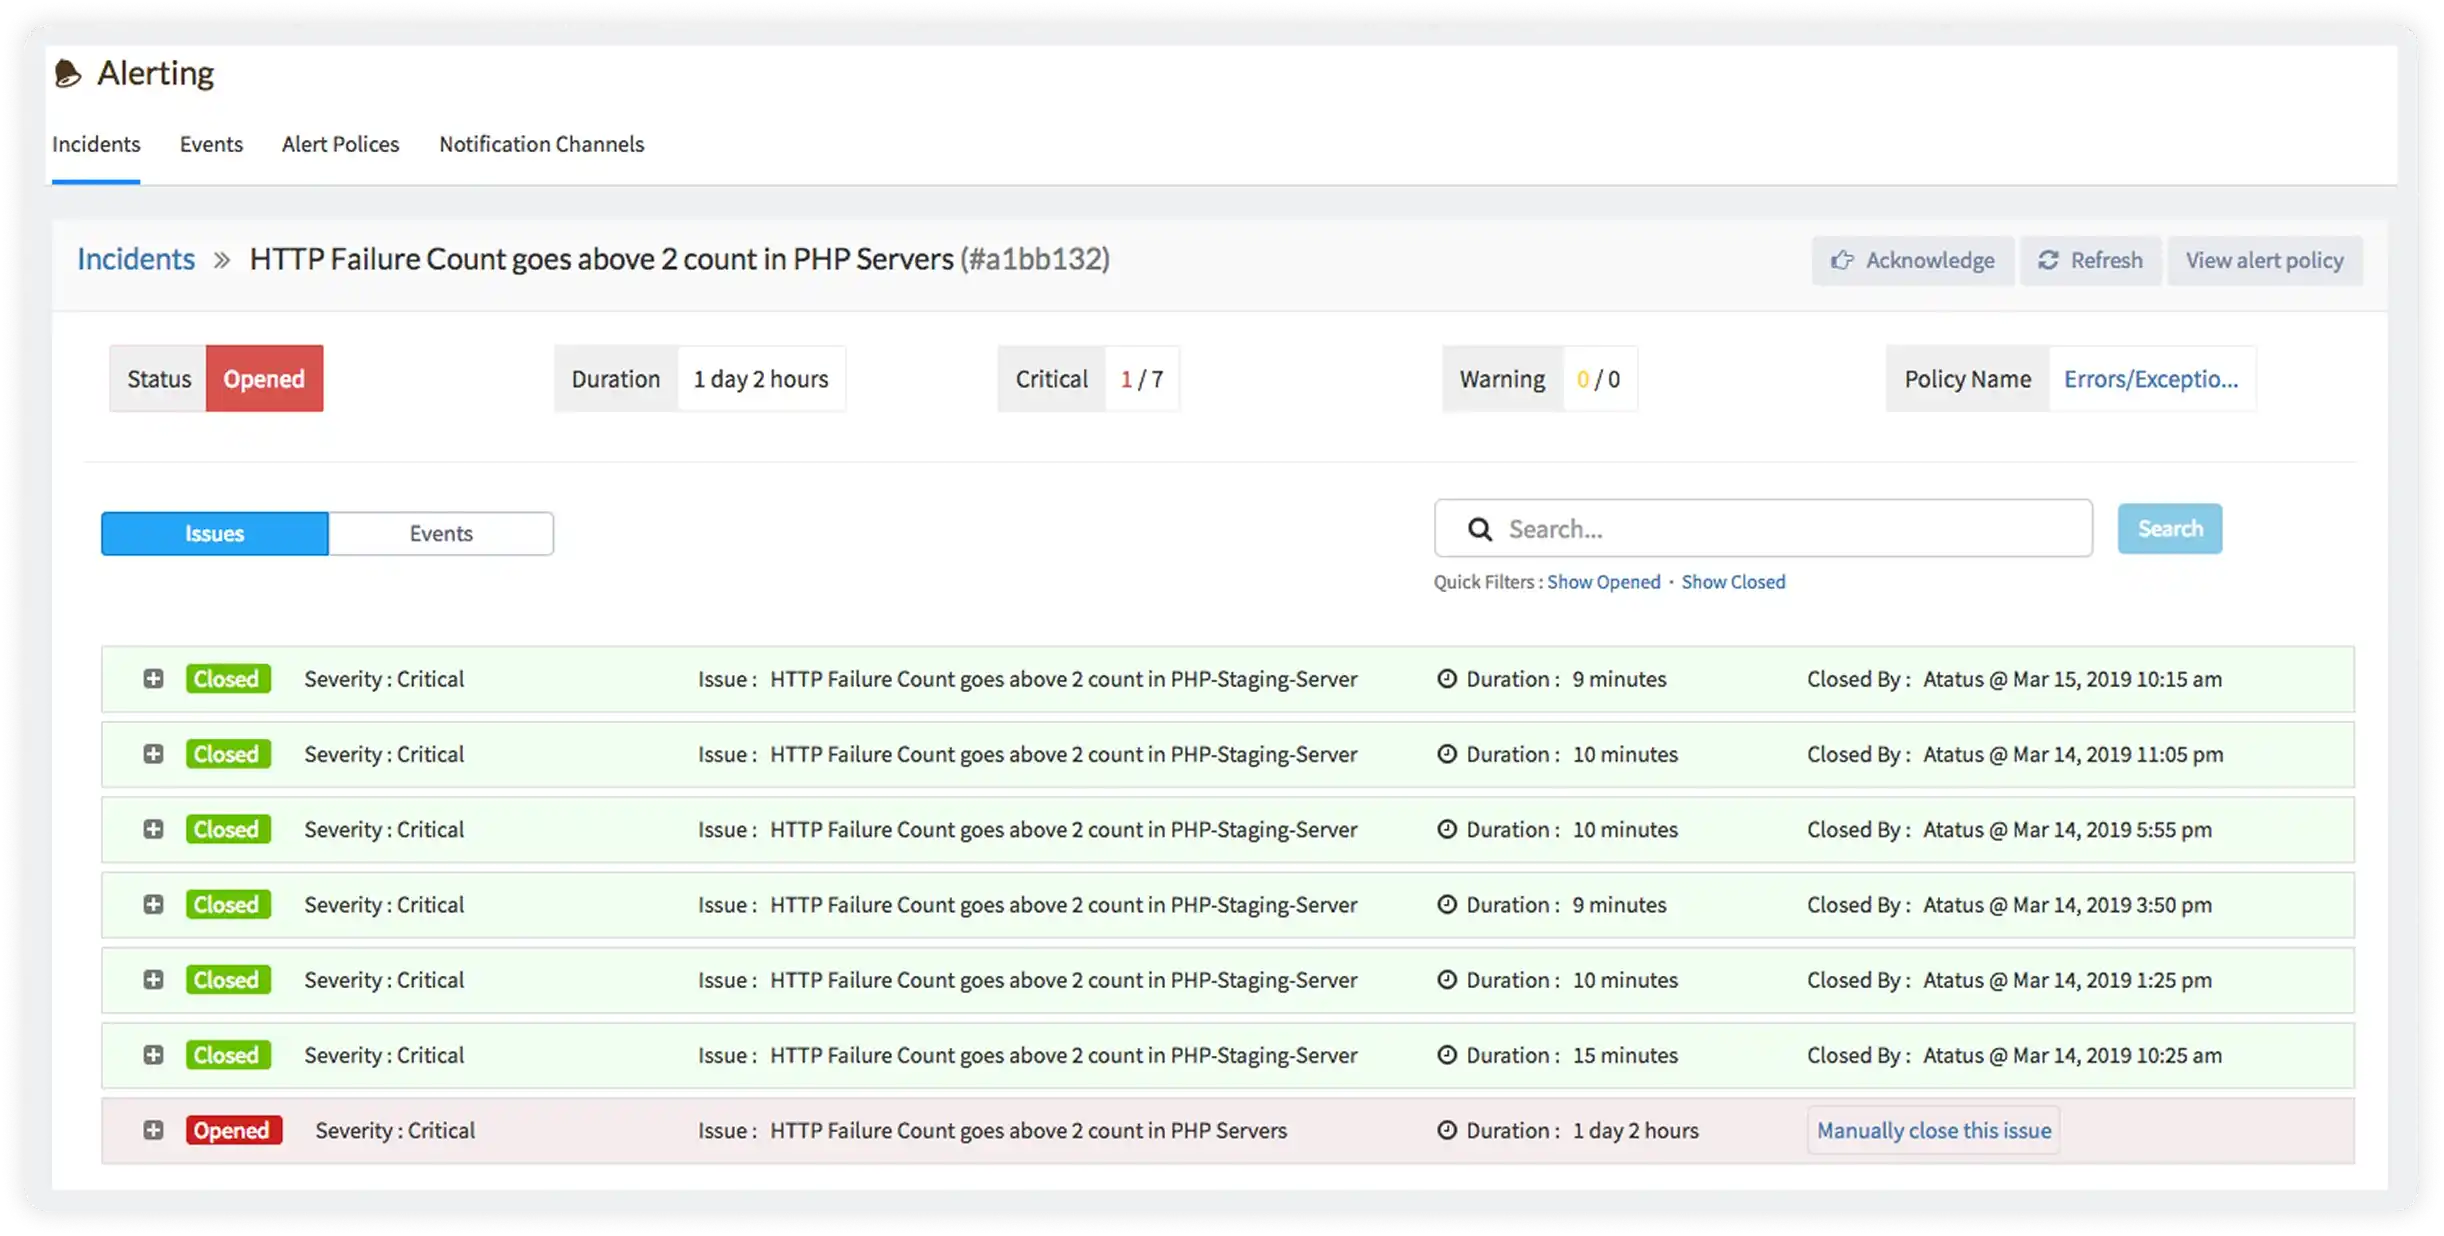
Unified Error Inbox for Faster Response
Track and triage errors from all parts of your stack in one place, keeping teams aligned and minimizing context switching to reduce time to resolution.
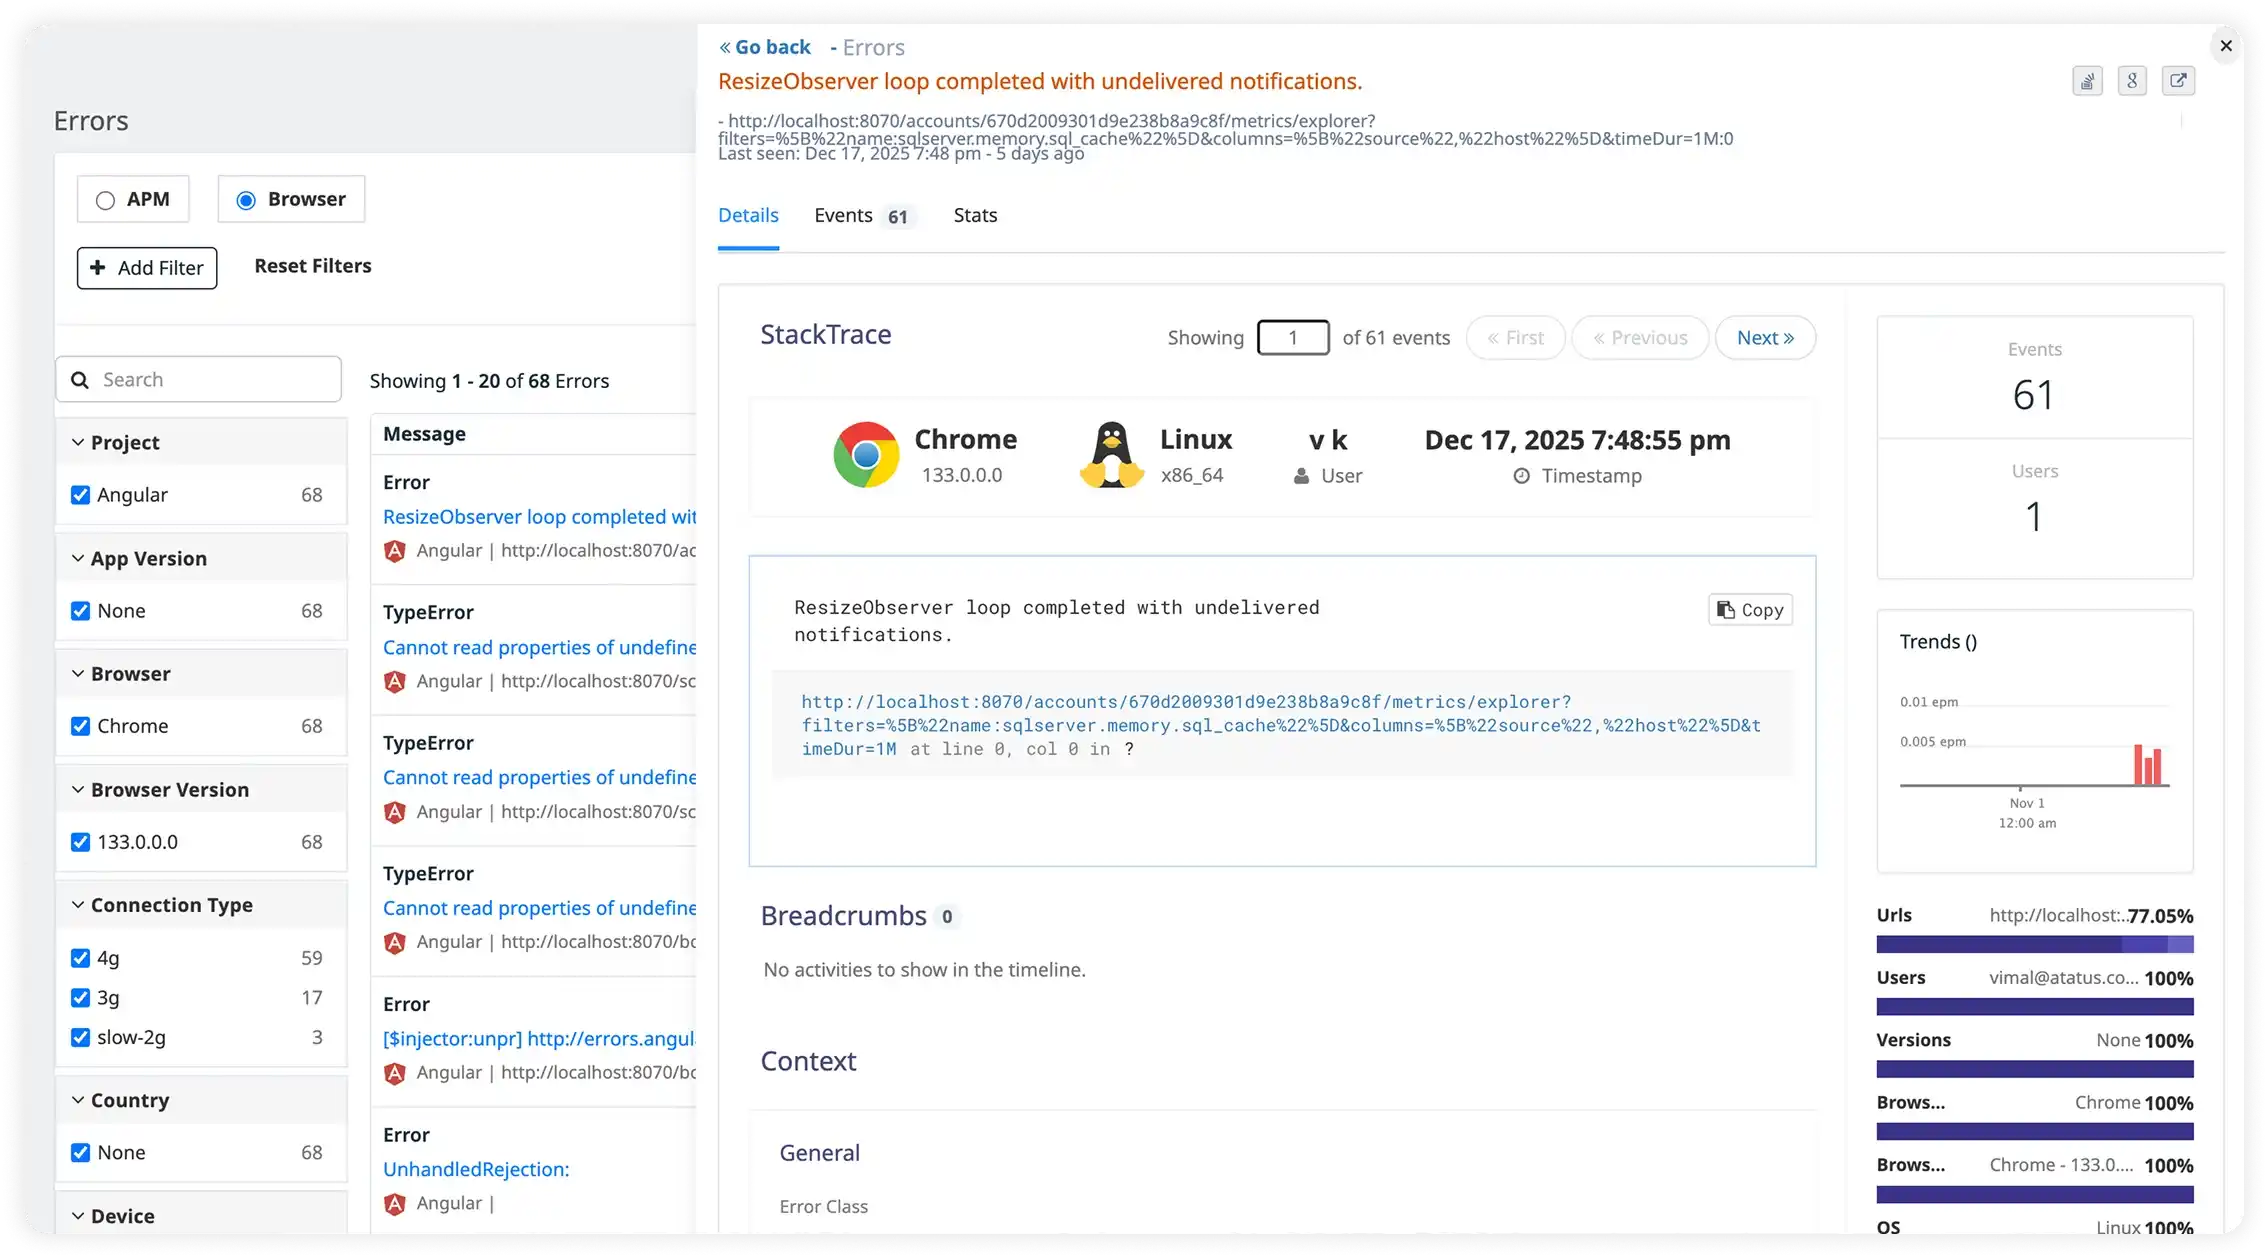
Prioritized Alerts on Critical Failures
Receive notifications for new, recurring, or high-impact errors so your team can focus on urgent issues and resolve problems before users are affected.
Built for Developers,
Loved by Teams
Experience enterprise-grade error tracking without the enterprise complexity. Get started in minutes and scale effortlessly.
Boost Framework Performance
Gain insights into your performance, enhancing transaction flow and speeding up error resolution.
Trace Every Request Instantly
Visualize end-to-end traces across your stack, ensuring that you catch every error, performance issue, or bottleneck.
Identify Slow Queries Instantly
Pinpoint and resolve slow database queries and eliminate performance bottlenecks impacting your application's responsiveness.
Business Impact
What engineering teams actually achieve?
Real outcomes from teams using Atatus error monitoring in production.
Faster mean time to resolution
Stop spending hours correlating logs and traces manually. Full stack traces and user context compress investigation from 2+ hours to under 20 minutes.
Reduction in alert noise
Intelligent grouping eliminates duplicate event flood. Your team focuses on the real 47 issues, not 10,000 repetitive notifications that cause alert fatigue.
Time to reproduce any error
User actions, breadcrumbs, request state, and device context are captured automatically. No more "cannot reproduce" tickets sitting unresolved for weeks.
Crash-free session rate
Proactive application error tracking means exceptions are caught and fixed before they compound. Protect user experience and avoid revenue-impacting downtime.
Detection to first alert
Real-time error alerts fire before users have time to notice something is wrong. Engineering owns the incident before support gets the call.
Surprises in production
Know exactly what broke, where, why, and who is affected within seconds. Ship with confidence knowing every exception is tracked and accounted for.
Start Tracking Errors in Under 5 Minutes
Three simple steps to complete error monitoring. No credit card required.
Sign Up Free
Create your Atatus account in seconds. No credit card required, just sign up and start tracking errors instantly.
Add a Small Snippet
Insert a tiny code snippet into your app or website. No complex setup, supports major languages and frameworks.
Start Catching Errors
Get real-time error reports with stack traces and user data. Spot, debug, and fix issues before users even notice.