Go Application Performance Monitoring
Get end-to-end visibility into your Go performance with application monitoring tools. Gain insightful metrics on performance bottlenecks with Go monitoring to optimize your application.
How Go Teams Lose Visibility in Production?
Invisible Failures
Production issues surface as symptoms, not signals. Teams know something is wrong, but the system gives no clear indication of where the failure actually originates.
Partial Context
Logs, metrics, and traces exist in isolation. Engineers are forced to mentally reconstruct execution paths across services, versions, and environments.
Slow Triage
Incidents consume senior engineering time because identifying the first breaking point takes longer than fixing the actual problem.
Concurrency Blindness
Go’s concurrency model hides timing and contention problems until traffic spikes. Failures appear non-deterministic and hard to reproduce.
Scaling Uncertainty
Systems behave well at low load but degrade unpredictably at scale. Teams lack confidence in how code paths respond under real production pressure.
Ownership Confusion
When multiple services interact, no team can clearly say where responsibility starts or ends, leading to stalled investigations.
Signal Ambiguity
Production signals exist, but they lack hierarchy and meaning. Engineers see activity without knowing which changes actually explain user impact or failures.
Diagnostic Noise
There is plenty of data, but not enough direction. Engineers spend time filtering information instead of understanding the failure.
High-Performance Observability Built for
Go Applications
Real-time visibility into Go services that helps engineering teams maintain speed, stability, and predictable production performance.
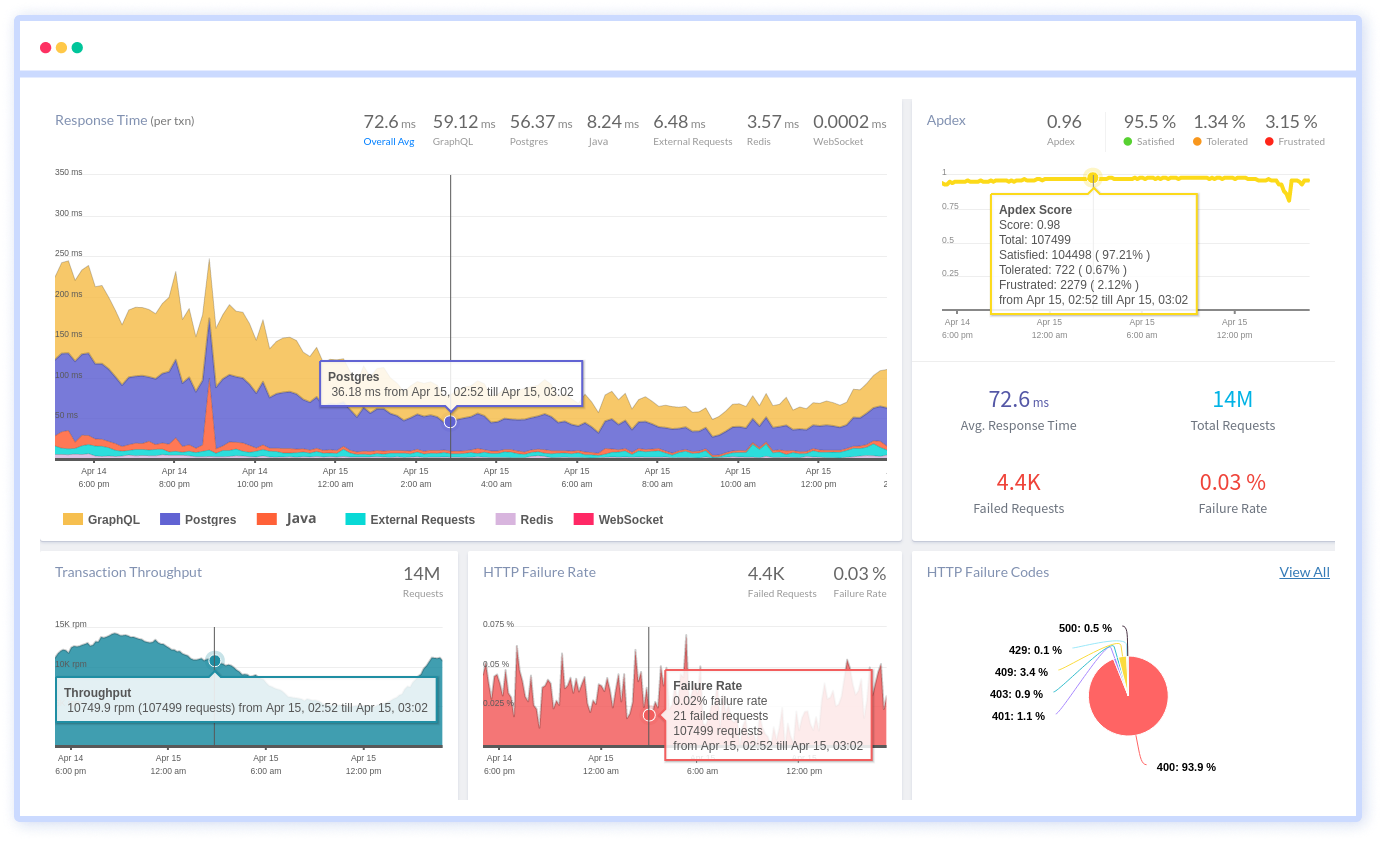
Track Every Go Request in Real Time
Follow each request across APIs, microservices, databases, and background workers in a single distributed trace. Understand execution flow and performance behavior across your Go application.

Map Go Service Interactions Clearly
Visualize how Go services communicate with databases, message brokers, caches, and external APIs. Quickly detect latency bottlenecks, traffic shifts, and failure patterns across your architecture.

Monitor Business-Critical Go Transactions
Keep a close watch on essential workflows such as API processing, order handling, and background tasks. Identify slow transactions, rising error rates, and performance regressions before users notice.

Stay Informed on External Dependencies
Monitor third-party services and integrations your Go applications depend on. Catch slowdowns and outages early to avoid cascading system issues.


Why Engineering Teams Commit to Atatus?
Atatus fits teams that value directness and accuracy. It integrates into engineering workflows without changing how teams think or work.
Fast Clarity
Teams quickly understand what is happening in production without stitching together multiple mental models.
Low Friction
Engineers can start trusting production signals without weeks of onboarding or internal evangelism.
Cross Team Alignment
Platform, SRE, and backend teams operate from the same understanding of system behavior during incidents.
Confident Decisions
Release rollbacks, mitigations, and fixes are based on evidence, not guesswork or intuition.
Reduced Escalations
Issues are resolved at the right level, reducing dependency on a few senior engineers.
Predictable Operations
Production behavior becomes explainable, even as traffic patterns and workloads evolve.
Developer Trust
Engineers believe what the system tells them, which shortens investigations and reduces debate.
Incident Readiness
Teams stay prepared for failure modes they have not explicitly seen before.
Long Term Focus
Less time spent firefighting allows teams to invest energy into stability and architecture improvements.
Unified Observability for Every Engineering Team
Atatus adapts to how engineering teams work across development, operations, and reliability.
Developers
Trace requests, debug errors, and identify performance issues at the code level with clear context.
DevOps
Track deployments, monitor infrastructure impact, and understand how releases affect application stability.
Release Engineer
Measure service health, latency, and error rates to maintain reliability and reduce production risk.