New Relic vs Atatus
Application Performance Monitoring (APM) is used to ensure consistent availability, performance, and response times of an application. Websites, mobile applications, and business applications have use cases for monitoring purposes. Although, in the digital world, monitoring use cases expand to the processes, hosts, logs, networks, and end-users including your customers and employees.
New Relic and Atatus both ensure application performance through operational data monitoring, application monitoring, and infrastructure monitoring features. Since most companies offer those monitoring features, New Relic and Atatus are the best in the business. Atatus is the best new relic alternative that you will be finding in this market.
New Relic
New Relic was founded in 2008 by Lew Cirne as a cloud-based software to help developers to track the performance of their website and application. It is one of the largest APM tools on market with seventeen thousand customers which offers software and web analytics for start-ups, SMEs, and large companies.
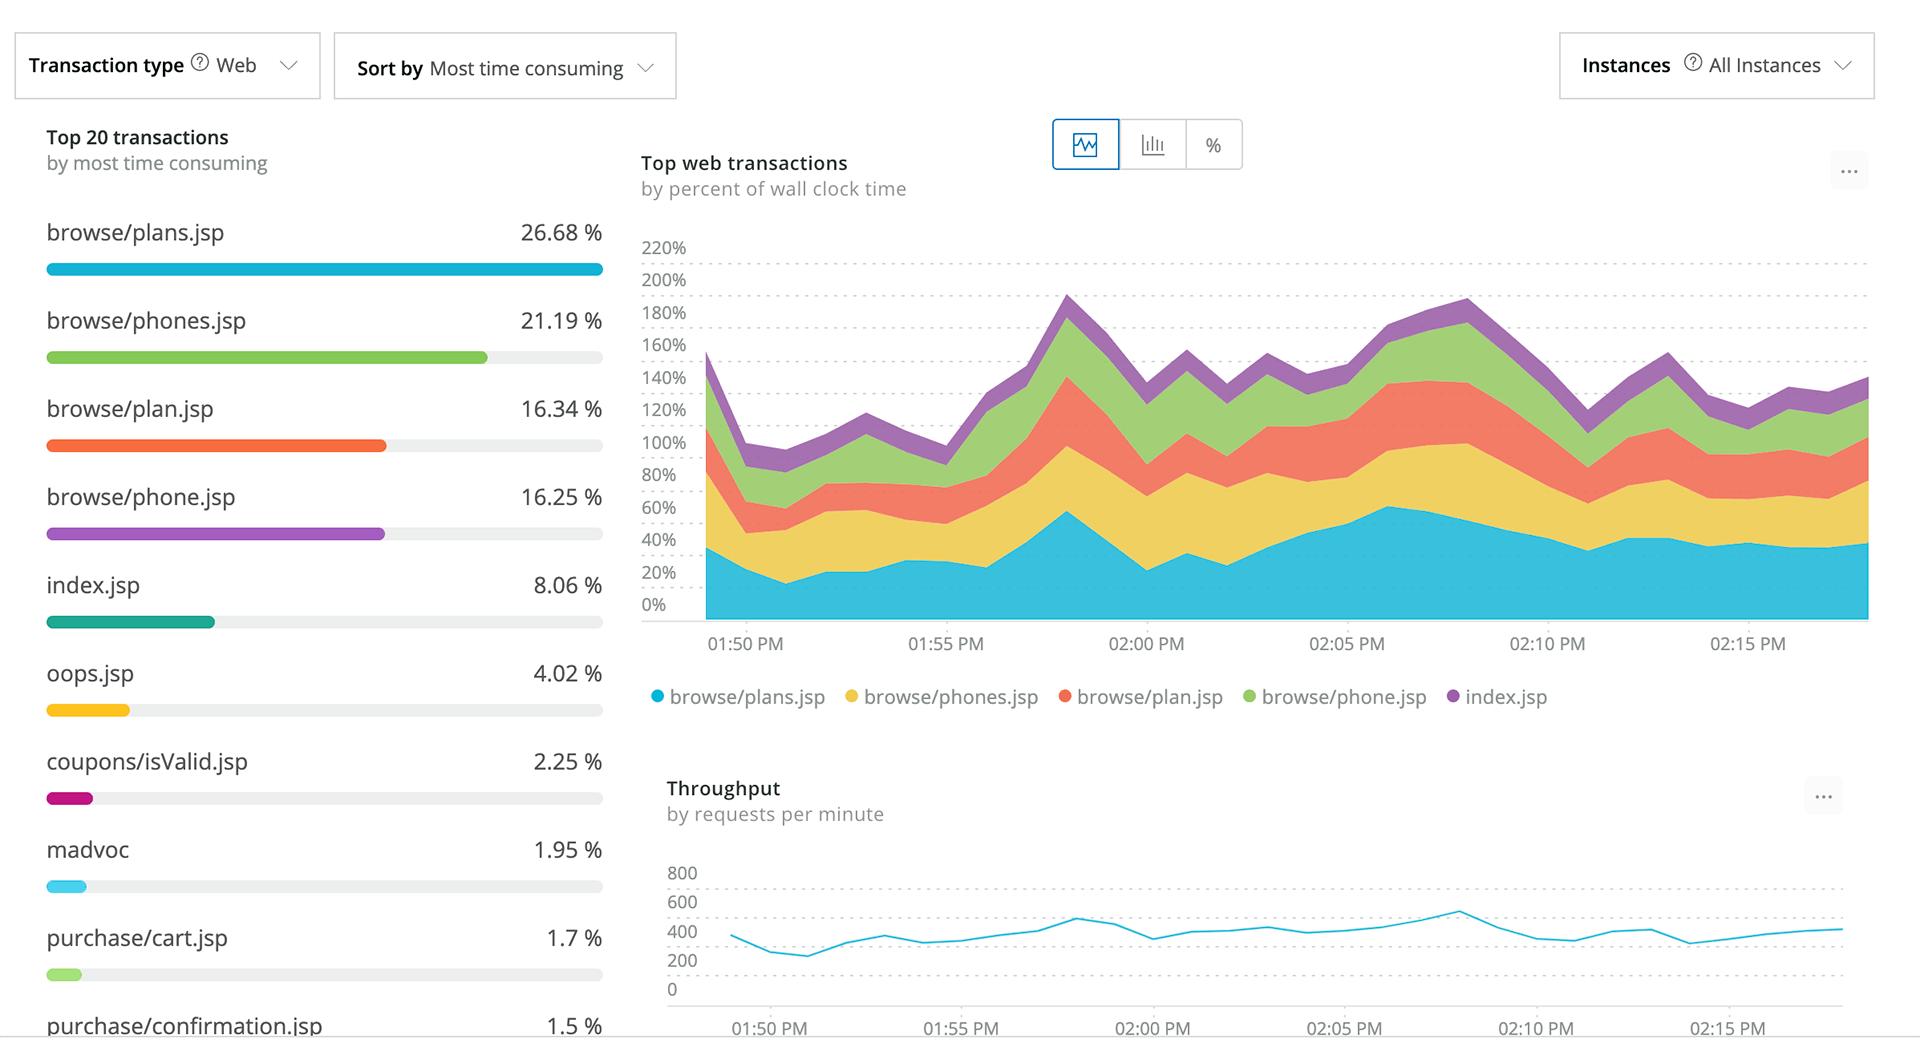
This tool provides SaaS web and mobile application monitoring with network monitoring capabilities. So developers can focus on coding, instead of solving problems with application performance. It also features a dashboard with real-time monitoring and deep diagnostic solutions that can able to recognize when performance bottlenecks happen. It provides information about application stack and code problems that exist, and how to repair them.
Additionally, they provide mobile monitoring tools for Android and iOS. New Relic offers comprehensive monitoring for seven languages as Java, Node.js, Python, Go, .NET, PHP, and Ruby. They also provide native C/C++ agents to instruments.
New Relic is trusted by many types of industries including Chegg, Australia Post, Alkami, Bax Music, 27 Global, 20 Minutes, and much more.
Some of the key features:
- Performance data retention
- Response time, throughput, and breakdown by layer in real-time
- Application response time, throughput, and breakdown by component
Why New Relic?
New Relic is constructed to help applications utilize the latest technology of the digital world to reduce downtime, improve productivity, and enable high-performing applications to deliver excellent user experiences for customers.
Capabilities of New Relic:
- Real-time instrumentation and analytics with easy to set up feature
- Customized dashboards and instrumentation
- Correlates application performance to the end-user experience
- Connects both application and infrastructure performance
- Rich and detailed transaction data
- Real-time error analysis with on-demand diagnostic tools
Atatus
Atatus was founded in 2014 as a SaaS-based platform for application performance management with an error tracking solution that provides full-stack visibility for the entire applications. Our tool can able to dynamically collect millions of performance data points across your applications so that you can quickly resolve performance issues and improve customer experience. And all this happens in real-time, with cloud and on-premise deployment flexibility. Developers used to describe us as “Application Performance Management (APM) and Error Tracking for all your applications”.
It offers a deep analysis of all your application performance metrics to deliver high-quality and reliable software. It notifies you when an error occurs as soon as possible and provides entire information about who, when, and what caused the performance issue.
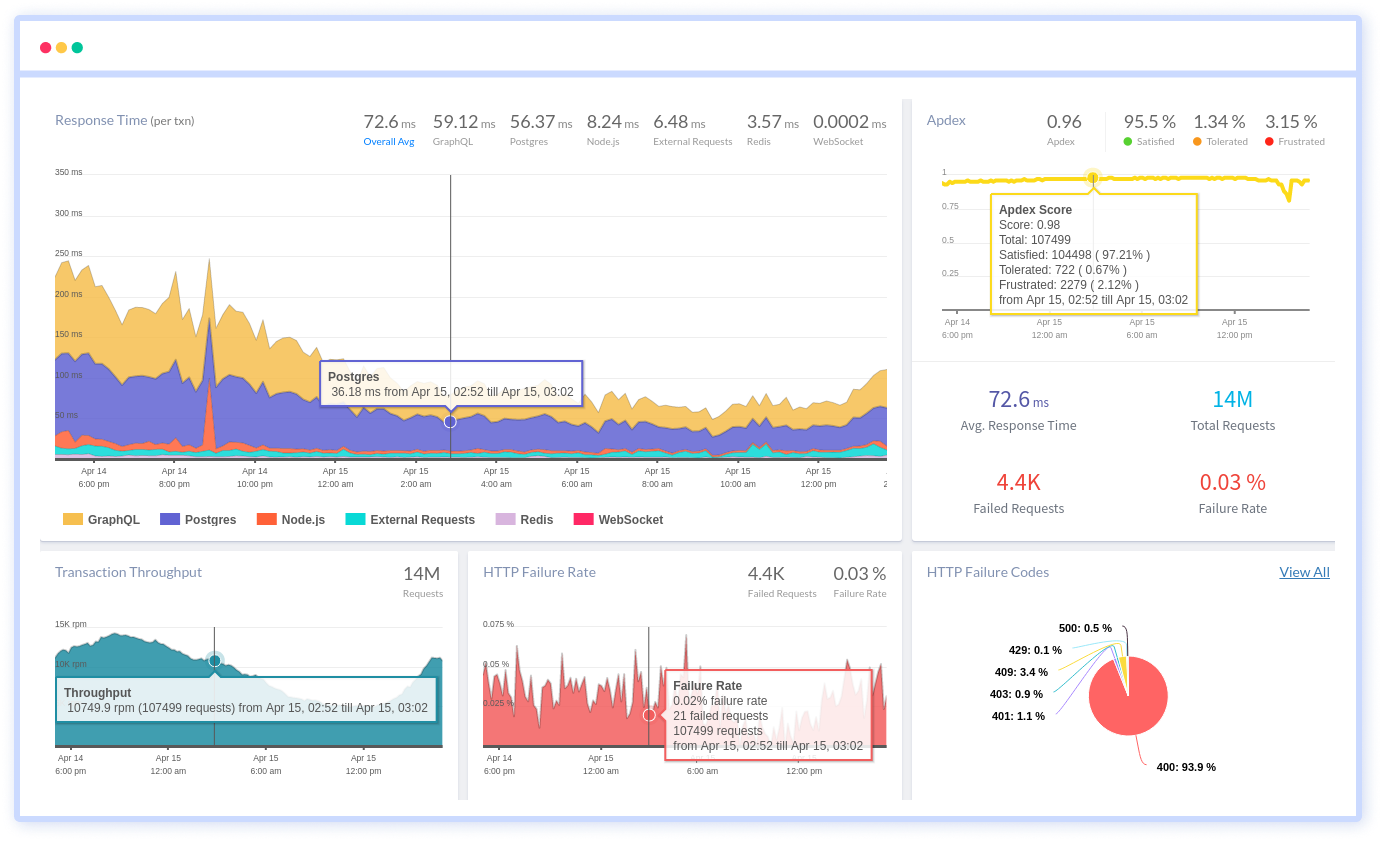
With our easy-to-navigate dashboard, you can view historical application performance metrics and issues and track performance errors to ensure your application is performing at peak level. Along with Transactional Monitoring, we offer Database Monitoring, Error Tracking, and Remote Service Monitoring capabilities that will provide you an overview and understanding of your production services and how they are performing.
This includes performance measuring of database queries from Redis, Memcache, and MongoDB along with queries that caused the slowdown. The main goal of Atatus is to guarantee our customers get the best user experience out of those applications, no matter what.
Atatus supported languages are PHP, Java, Node.js, Ruby, Python, JavaScript, Angular, and much more. We are trusted by various companies such as LendingTree, Storyteq, Kidpass, NHS, Elvanto, Compass, etc.
Some of the key features of Atatus:
- Application performance metrics
- Real User Monitoring
- Logs Monitoring
- Server Monitoring
- Uptime Monitoring
- Error tracking with smart grouping, alerting, and analysis
- Custom Dashboards
- Intelligent Alerting
Why Atatus?
Atatus is designed to seamlessly monitor your entire application stack. It collects end-to-end visibility of every transaction data and measures how application layers affect the customer experience.
Capabilities of Atatus:
- Monitor the entire application performance breakdown of where and why it gets slow down
- View network calls to find the impact on the application performance
- Look into HTTP failures and find how it impacts users
- Collect the transaction code when it gets slower than the threshold
- Measure full-stack application track when exception happens
- Can get into the deployment history to know application performance
- Sent notification to developers when an issue occurs
- Create an SLA report to look into your application performance over the days, weeks, and months
New Relic vs Atatus: Point-By-Point Comparison

#1 Ease of Use
New Relic has basic UI functions that are available across the entire platform. It gives you full access to the data from all the entities in your application stack. While Atatus has a friendly UI, which is easy to use and good at presenting transaction data to users in an understandable format to diagnose performance issues and collect operational insights.
#2 Learning Curve
Both New Relic and Atatus have been designed their platform to provide an easy and quick setup to monitor the health of the entire application stack..
#3 Pricing
New Relic provides one full-access user free through the standard plan and you need to raise a request to know about paid plans. Atatus provides a 14-day free trial and the paid plan that starts at $49 per month per host and saves 30% when billed annually. The major difference in pricing is that you only pay for the real data that you send in Atatus, not for number of users.
#4 Community vs Dedicated Support
New Relic is active in community-building efforts to maintain a repository of APIs, libraries, and community contributions to support their customers. Atatus provides dedicated support manager for each account, without the need to choose a higher plan. We take you all the way through on boarding, setting up and making sure you get value from our product.
#5 Capability Set
Both New Relic and Atatus offer strong APM tools and infrastructure monitoring. When it comes to capability set, New Relic is strong on performance monitoring while Atatus shines brighter for performance monitoring, real user application, and error tracking.
#6 Integration
New Relic integrates with Amazon Web Service, Google Cloud Platform, Microsoft Azure, Ansible, ColdFusion, Flask, Sunspot, etc.
Atatus integrates with PHP, Java, Node.js, Ruby, Python, .Net, Slack, Asana, Jira, OpsGenie, YouTrack, GitLab, Lighthouse, VictorOps, etc
Summary
Both platforms are efficient SaaS-based monitoring platforms known for application performance monitoring. New Relic will get appreciate for its AIOps that will find the performance issue through Artificial Intelligence and Machine Learning.
Atatus contemplated has a DevOps tool and benefits a lot of users. Its error tracking feature is unique from New Relic which helps developers to solve performance issues way faster than other platforms.
So which one are you going to choose? Share your thoughts with us at Atatus. And also sign-up for a 14-day free trial.
#1 Solution for Logs, Traces & Metrics
![]() APM
APM
![]() Kubernetes
Kubernetes
![]() Logs
Logs
![]() Synthetics
Synthetics
![]() RUM
RUM
![]() Serverless
Serverless
![]() Security
Security
![]() More
More