Top 7 SolarWinds Competitors and Alternatives to Know in 2024

SolarWinds Inc., based in the United States, is a software company that helps businesses manage their networks, systems, and IT infrastructure. Its headquarters are in Austin, Texas, and it has sales and product development offices around the United States and in a number of other countries. It has acquired a number of other businesses, including Pingdom, Papertrail, and Loggly, which it continues to operate under their original names.
SolarWinds AppOptics is a scalable application performance management (APM) and metrics platform that scales with your organization. It's a zero-configuration APM that incorporates distributed tracing, monitoring of hosts and IT infrastructure, custom metrics, and dozens of integrations, all of which feed into the same dashboarding, analytics, and alerting pipelines.
It includes agents that automatically monitor applications, producing both application performance metrics (APM) and detailed distributed transaction traces. The APM metrics include latency (such as request time, percentiles, and more), error rate, per-host and per-transaction metrics, and so on.
Logs monitoring allows you to track and send log files from your system or services to Loggly or PaperTrail. To aid in troubleshooting, you can track Trace Context data from APM in your Application log files.
They give you the ability to create dashboards that show your data in a stunning visual format. Individual charts can be moved and resized by dragging them around and altering their resize-corners on a grid-based dashboard. Your charts will resize themselves to maintain their relative sizes and placements if you resize the browser window.
Their alerting system allows you to link alerts to several notification services, allowing you to send alerts by email to pagers, web services to your preferred escalation partner, or both at once.
The SolarWinds Snap Agent serves as both a host and an integration, providing a curated dashboard as well as a number of system metrics. You can integrate the software with Apache, Elasticsearch, MongoDB, Redis, and More.
The SolarWinds Orion platform has flaws in a number of areas. Rather than a pay-as-you-go pricing plan like its competitors, it has an extremely pricey one-time licensing fee. Although the functions are excellent, they are limited in scope and lack the breadth that other suppliers provide.
Alternative monitoring tools will eventually be able to address these concerns while also offering some assurance that your data will not get into the hands of an international hacking attempt.
The following are the alternatives with detailed explanations:
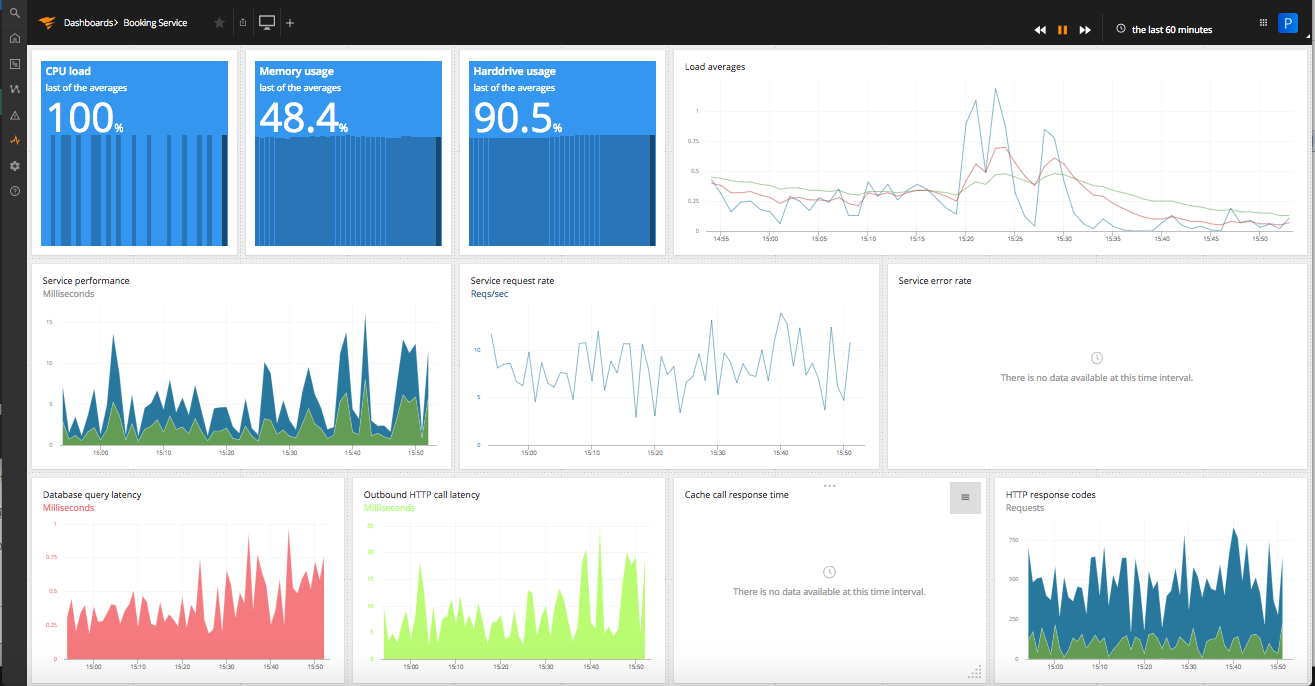
#1 Atatus
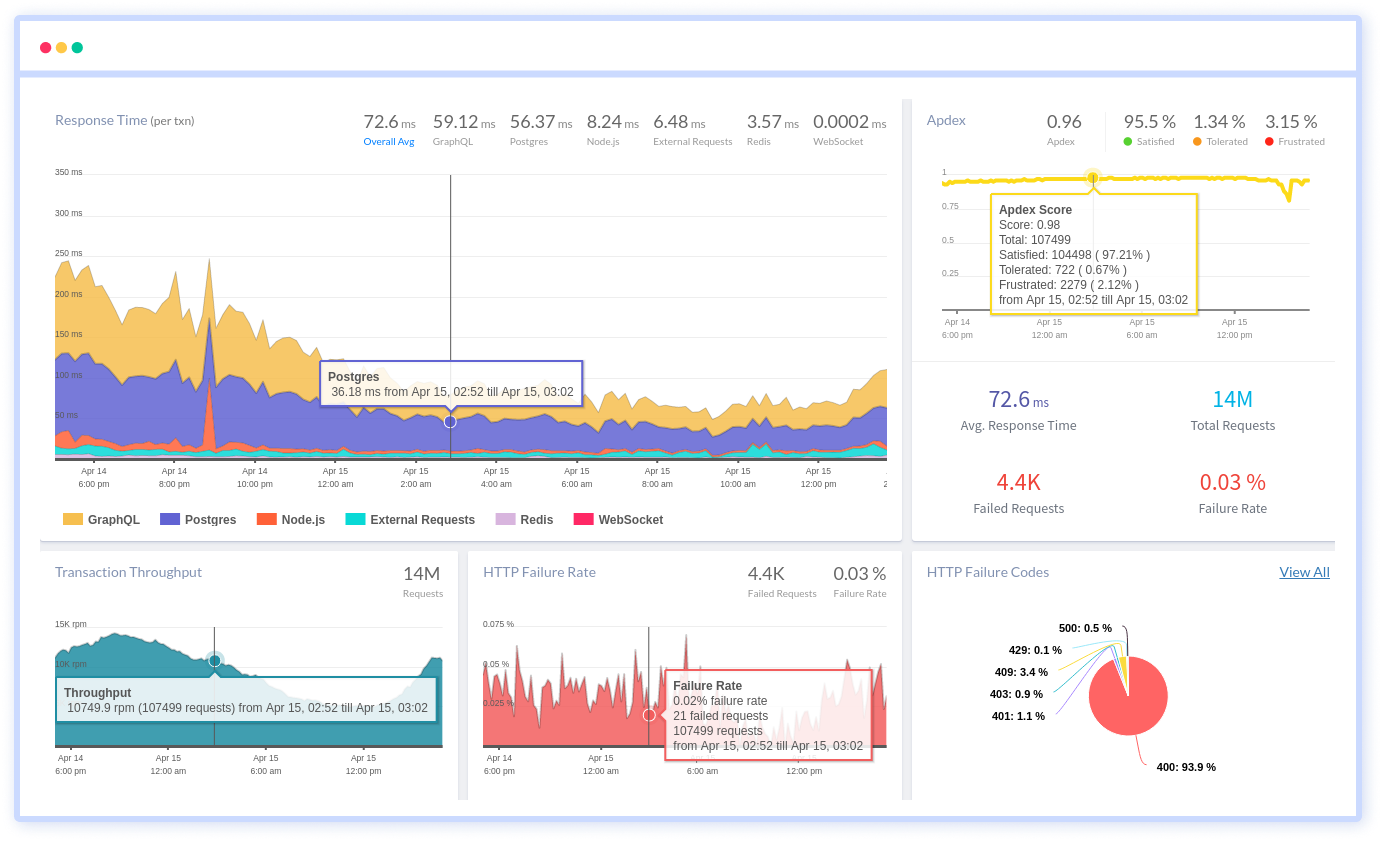
Atatus helps you to understand how the performance of all of your applications is monitored in real-time. You can look at the data to see how your front-end (Browser Monitoring), back-end (Application Performance Monitoring), and servers (Infrastructure Monitoring) performed in general.
Atatus Application Performance Monitoring (APM) provides a real-time picture of the data it monitors. Response time, transaction throughput, and other performance indicators can be seen. APM provides performance monitoring data, including chart views, APM instrumentation, and alert notification.
You may collect logs from your log files, servers, applications, networks, and security devices using Atatus Log Monitoring. You can quickly identify a specific log message, and you can keep track of multiple log files on multiple systems.
Atatus Browser Monitoring continuously monitors the performance of your web applications. For all of your assets, you'll also get data on browser metrics like page load time and JS errors, allowing you to find out why a user is experiencing performance issues and what they should do to improve the speed of their web application. Ajax queries, individual pages, JS errors, and session traces are all tracked by Atatus Browser.
Atatus' Infrastructure Monitoring gives you real-time information on all active hosts. It monitors the health of your servers and hosts, as well as the applications and services that rely on them, allowing you to quickly rectify issues and ship a bug-free product.
Integrations provide you with access to more data about your systems. Atatus supports Debian, RedHat, Mac OS X, and Alpine Linux. The Atatus APM integration connects the monitoring of your servers and applications.
Sending messages is easier and faster using the new Atatus alerting system. Individual alerts for monitoring the browser, application, and infrastructure are now possible. You can choose from a range of notification settings to receive your alerts from Atatus. It will also discuss the alert policy, alert rules, threshold values, alert issues, events, and occurrences.
Try our 14-day free trial or schedule a demo to learn more about Atatus.
#2 LogicMonitor
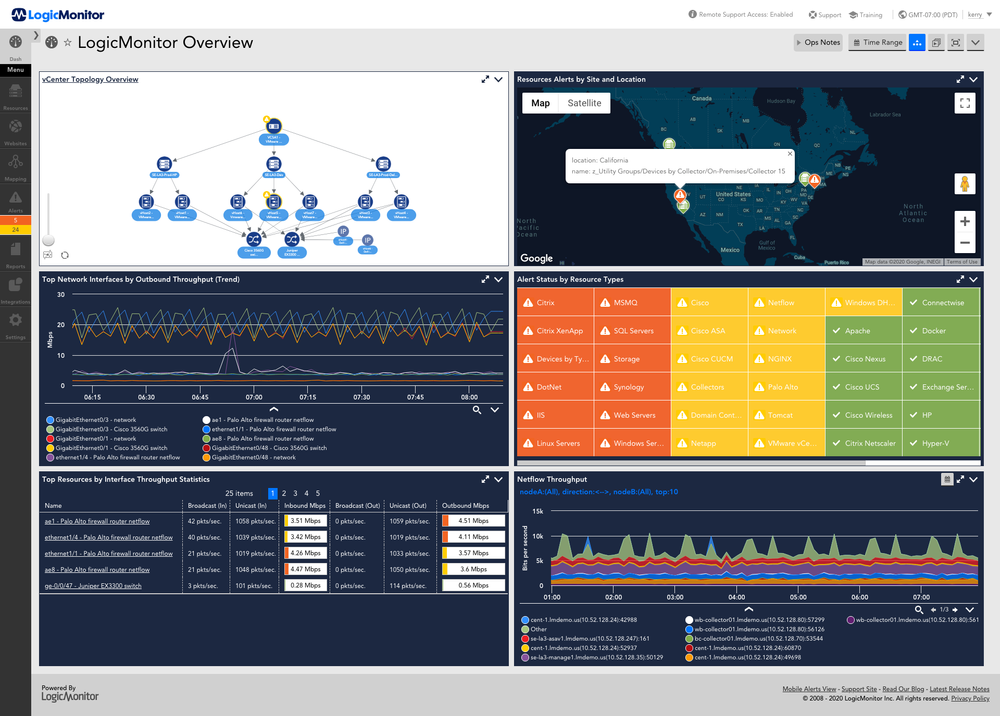
Enterprise IT and managed service providers can use LogicMonitor to get fully automated data center monitoring, cloud-based infrastructure monitoring, and an observability platform. With LogicMonitor's automated SaaS performance monitoring platform, IT Ops teams can manage today's sophisticated on-premise, hybrid, and cloud IT infrastructures, providing end-to-end visibility and actionable data.
LogicMonitor's Distributed Tracing is an OpenTelemetry-based interface that allows you to transport trace data from instrumented applications and monitor end-to-end requests as they transit across your distributed services environment. On the Traces page, these traces are displayed alongside important metrics and contextual logs.
Having all of an application's metrics, traces, and logs in one place can help you rapidly understand what's going on, why it's going on, and where it's going on, allowing you to troubleshoot more quickly and improve application performance.
To provide a unique and unified method to log analysis, LogicMonitor Logs use an algorithmic root-cause analysis approach. It analyses log events to look for normal patterns and anomalies, which are deviations from the norm. These log anomaly events, along with metric Alerts and Topology information, are shown on a Logs page to facilitate the investigation.
On the detail pages of your various devices, cloud resources, instances, websites, services, and groups, there are filtered Alerts pages.
#3 ManageEngine OpManager
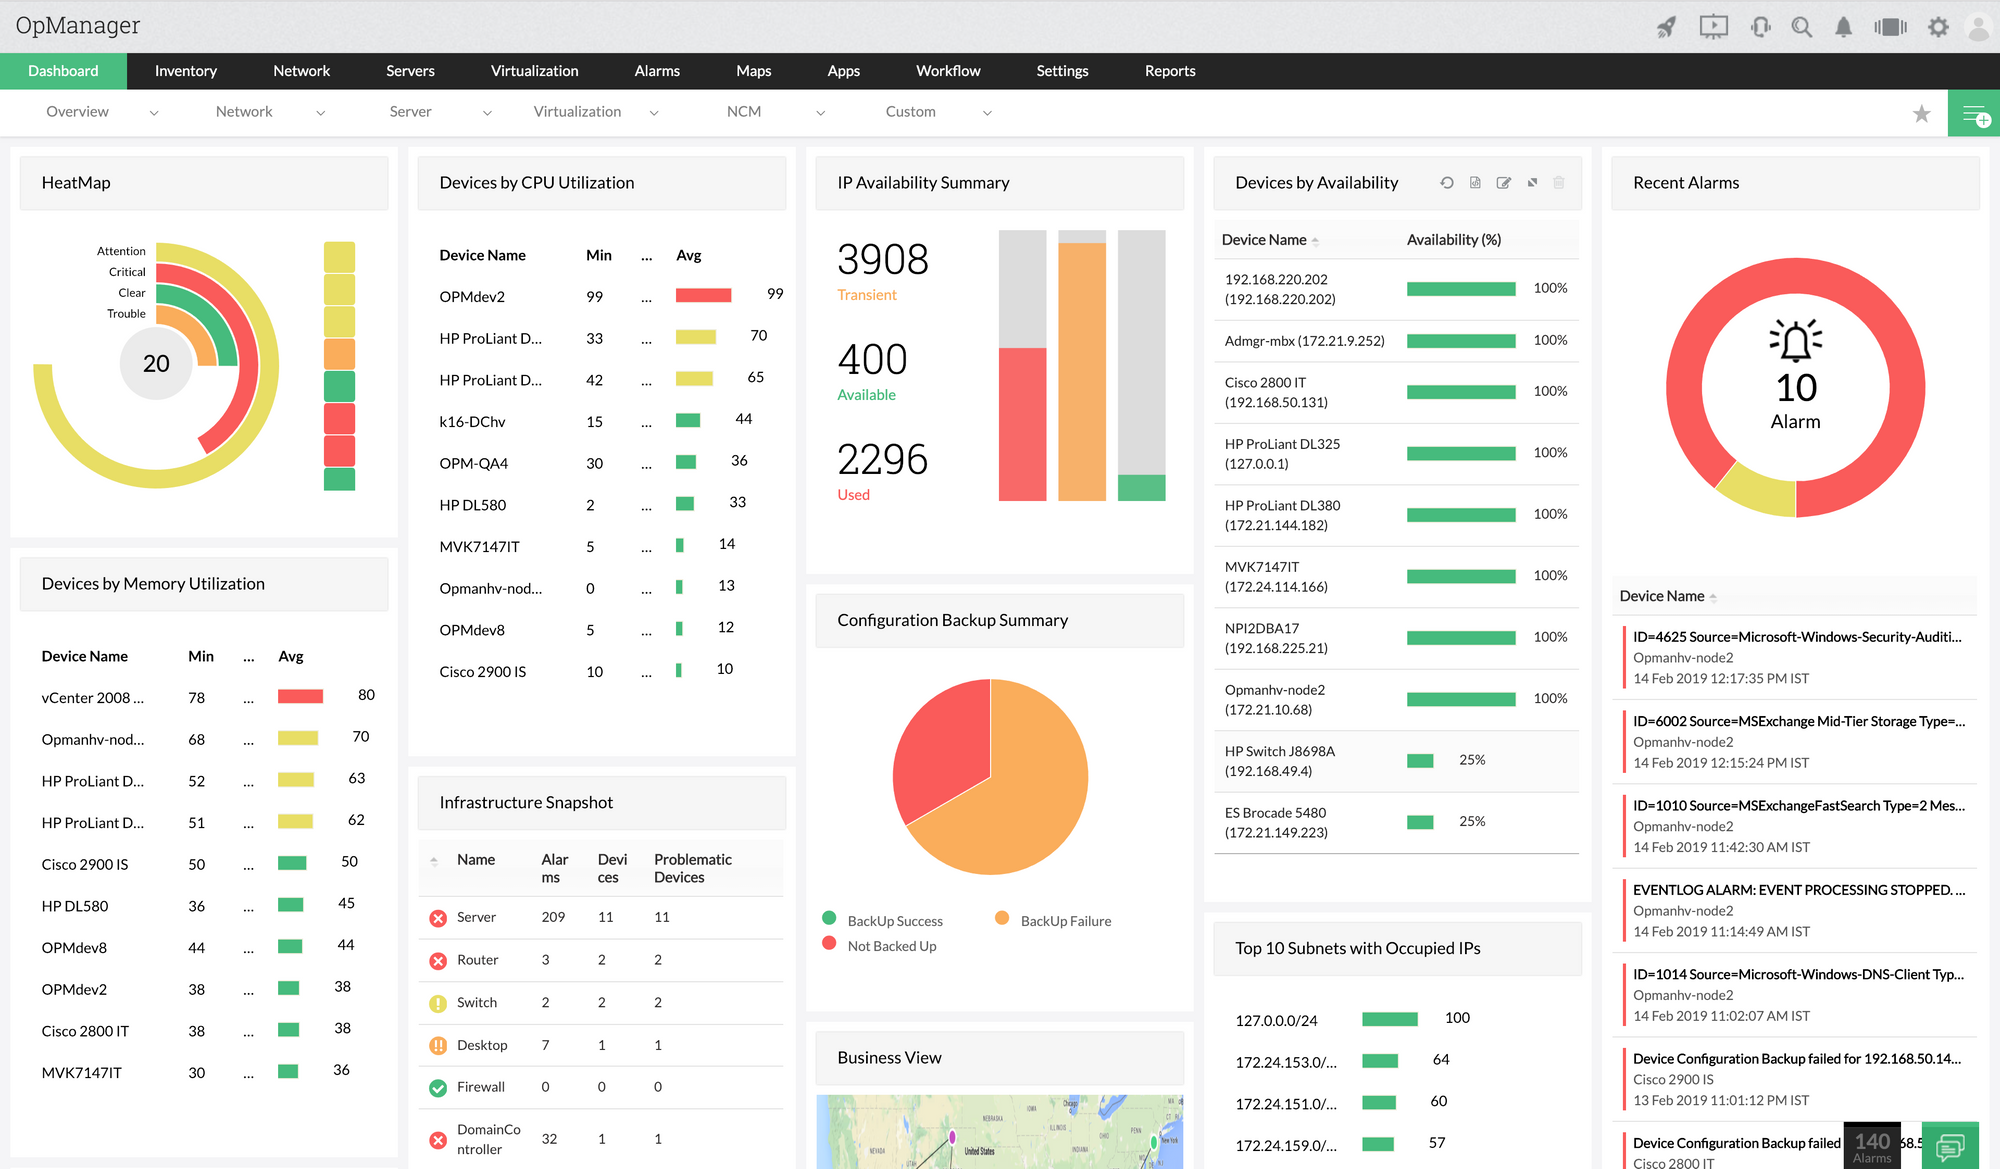
ManageEngine OpManager is a simple and cost-effective network monitoring solution. It keeps track of routers, switches, firewalls, load balancers, wireless LAN controllers, servers, virtual machines, printers, storage devices, and everything else with an IP address and a network connection.
ManageEngine OpManager keeps a constant eye on the network and gives you complete insight and control over it. You can simply drive down to the underlying source of a problem and eliminate it before operations are harmed.
It has flexible per-device pricing that allows you to scale up gradually once you've outgrown the Free Edition's basic features. It works with a variety of operating systems and hypervisors, making it excellent for managing virtual infrastructure and more likely to meet your company's long-term objectives.
You can obtain end-to-end visibility and analytics of your network architecture, which includes local devices, wireless networks, WAN connectivity, and non-computing devices such as printers and access points. It also integrates planning and configuration management with integrated troubleshooting. In addition, OpManager comes with sophisticated autodiscovery tools out of the box, allowing you to start monitoring in minutes.
You can extend the functionality of OpManager by integrating it with other ManageEngine applications as well as a variety of third-party solutions such as Slack, ServiceNow, and more.
#4 Datadog
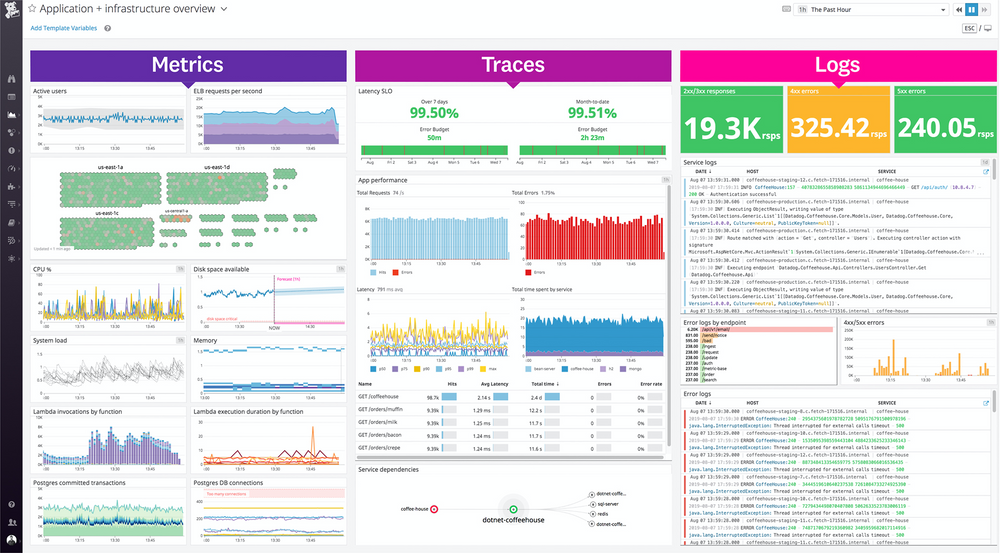
Datadog is a cloud-scale application observability solution that uses a SaaS-based data analytics platform to monitor servers, databases, tools, and services. With great performance dashboards for web services, queues, and databases, Datadog APM and Continuous Profiler deliver tremendous visibility into your applications by monitoring requests, errors, and latency.
Datadog Log Management, often known as logs, avoids some limits by separating log ingestion from indexing. This enables you to collect, analyze, archive, examine, and monitor all of your logs at a minimal cost and without any log limits. Datadog's Security Monitoring, which discovers security vulnerabilities in your environment without requiring you to index your logs, is likewise powered by it.
Datadog's Real User Monitoring (RUM) provides real-time visibility into individual users' behaviour and experiences. For web and mobile applications, RUM is meant to address four types of use cases: performance, error management, use, and support.
Datadog monitors the performance of your webpages and APIs in a controlled and reliable manner, backend/frontend, and at various network levels, and notifies you if anything goes bad.
Monitoring all of your infrastructures in one place would be insufficient if you didn't have the ability to notice critical changes. You can set up real-time monitors for metrics, integration availability, network endpoints, and other things with Datadog. You can configure monitors, notify your colleagues, and manage alerts all in one place on the Alerting platform.
#5 Dynatrace
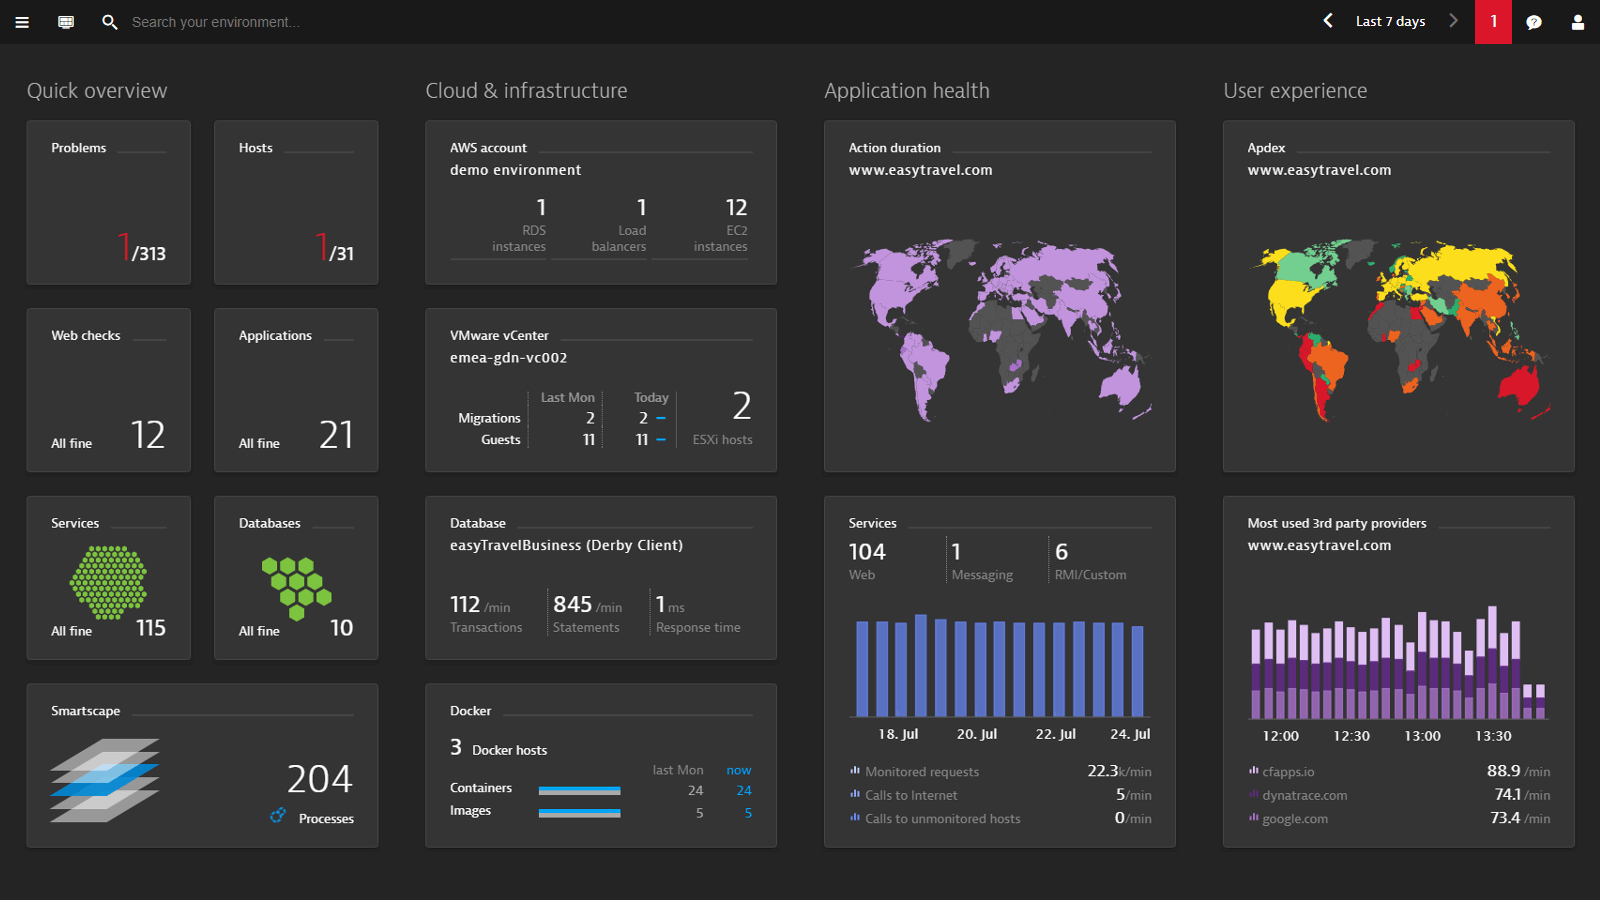
Dynatrace is a software intelligence platform that uses artificial intelligence (AI) and automation to monitor and enhance application performance, development and security, IT infrastructure, and user experience for enterprises and government agencies around the world.
The Dynatrace platform allows for observability throughout the whole solution stack, which minimizes cloud complexity and speeds up digital transformation and cloud migration for businesses, as well as allowing for hyper scaling to meet demand.
Real User Monitoring (RUM) by Dynatrace examines all user interactions with your applications, regardless of whether they occur in a browser or on a mobile device. Real User Monitoring allows for application availability monitoring, verification of correct UI element presentation, performance analysis of third-party content providers, backend service performance analysis, and performance study of any underlying infrastructure. Mobile applications are also supported.
Dynatrace lets you keep track of your entire infrastructure, including your hosts, processes, and network. By performing log monitoring, you may see information such as the overall traffic on your network, the CPU consumption of your hosts, the reaction time of your processes, and more. Dynatrace also provides detailed topological information, such as which processes are operating on which servers and how they are connected.
Dynatrace support 500+ technologies, extensions, and integrations such as OneAgent, Amazon SWF, Fedora, Laravel, Opera, and more.
#6 Paessler PRTG Network Monitor
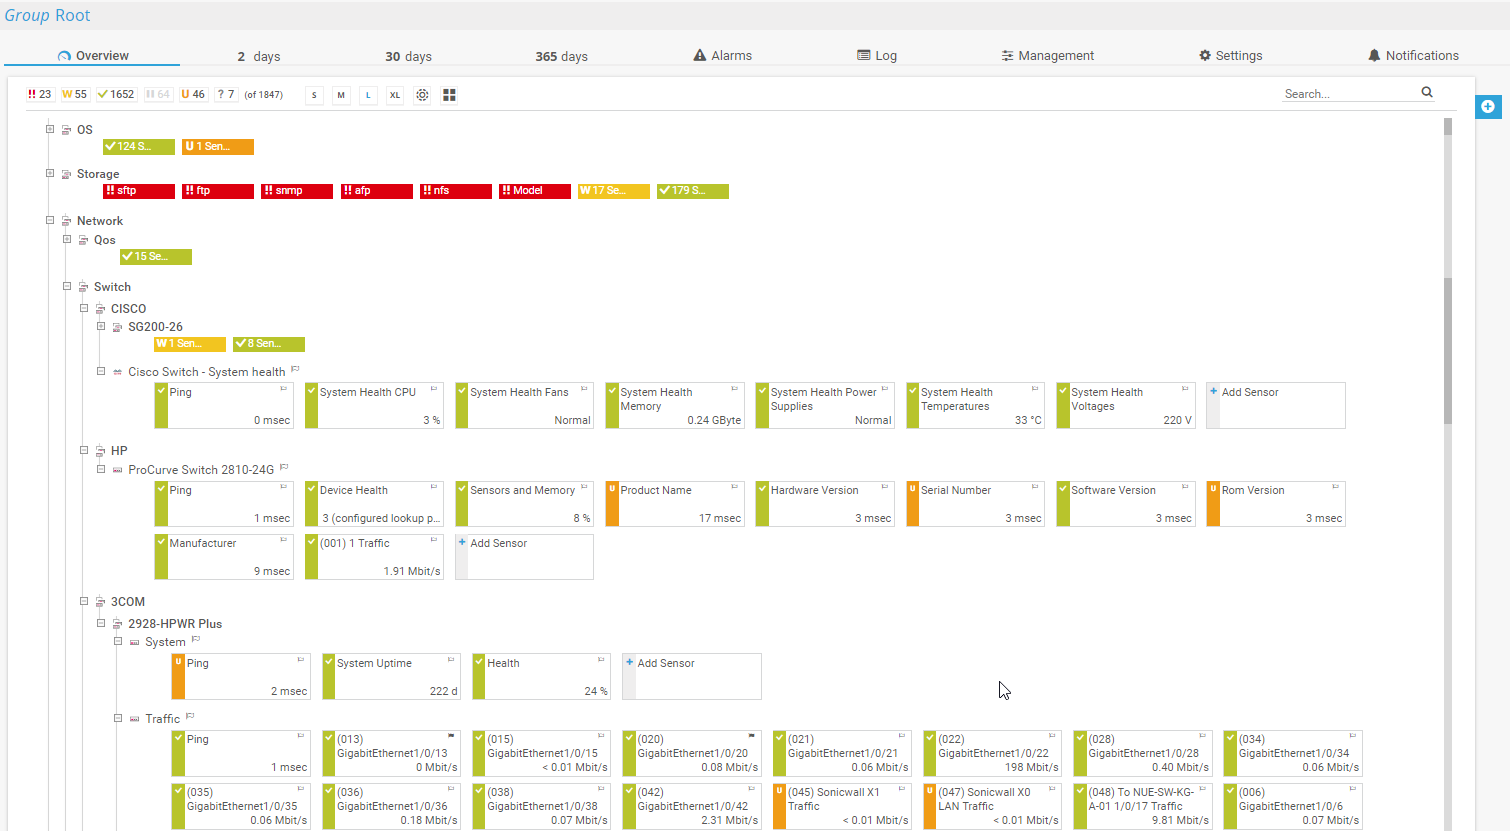
Paessler PRTG Network Monitor is an agentless network monitoring solution that makes sure your computer systems are always up and functioning. Full-featured AJAX web interface with high-security standards, excellent performance due to Single Page Application (SPA) technology, and adaptable design that adapts to your systems optimally.
All user interfaces provide SSL-secured local and remote access, and they can all be used at the same time. Failover tolerant monitoring is possible with PRTG Network Monitor. Every PRTG on-premises license includes a single failover.
Utilize multiple points of presence monitoring, all nodes continuously monitor all sensors, allowing you to compare response times throughout the network (LAN/WAN/VPN).
PRTG's hosted version also includes high-availability monitoring. They handle it for you, so there's no need to worry about cluster support in the cloud. You can monitor multiple networks in different locations, as well as independent networks within your company, with PRTG Remote Probes.
With the PRTG map designer, you can create dashboards and connect all of your network components with over 300 map elements, ranging from device and status symbols to traffic charts and top lists. Custom HTML can be used to personalize your map.
You can get the numbers, statistics, and graphs for the monitoring data or settings that you're interested in. You can also further process your historical monitoring data by exporting it as PDF, HTML, XML, or CSV files.
Email, push alerts, playing alarm audio files, and triggering HTTP requests are just a few of the built-in technologies in PRTG. SMS text messaging and EXE file execution is also supported by PRTG on-premises.
#7 Nagios
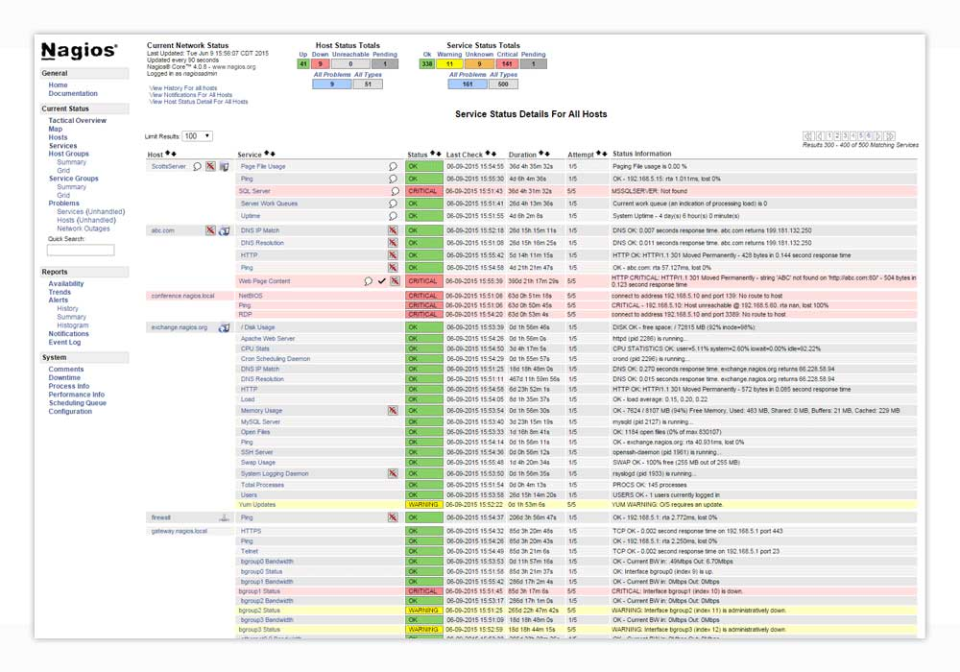
Using Nagios to implement effective application monitoring allows your business to immediately notice application, service, or process problems and take action to minimize application downtime for your users. Nagios is a set of tools for monitoring applications and their states, including Windows, Linux, UNIX, and Web applications.
Nagios XI keeps track of infrastructure components, including applications, operating systems, network architecture, network protocols, services, and system metrics. Hundreds of third-party addons allow you to monitor practically any internal or external program, service, or system.
The method of searching your log data with Nagios Log Server is substantially simplified. You may set up alerts to tell you, when possible, threats emerge, or you can just query your log data to audit any system rapidly. You get all of your log data in one place with Nagios Log Server, and it comes with built-in high availability and failover.
Nagios Fusion provides a high level of visibility and scalability to your network, assisting in the resolution of issues associated with numerous networks and geographical separation. Centralization makes network management easier by allowing you to see several Nagios XI and Core servers in one place.
Nagios keeps an eye on the network for issues such as overloaded data cables or network connections, as well as routers, switches, and other devices. Nagios can easily monitor the availability, uptime, and reaction time of every node on the network and show the data in a number of visual representations and reports.
When essential infrastructure components fail and recover, Nagios sends warnings to administrators, alerting them to significant events. Email, SMS, or a custom script can all be used to send alerts. Outages, events, notifications, and alert reactions are all recorded in reports for subsequent review.
And It a Wrap!!!
SolarWinds is a well-known name in the infrastructure monitoring industry, but recent events have exposed its vulnerabilities. Alternatives are more adaptable and scalable, especially without the looming cloud of a recent data breach. They offer customers additional options, so it's worth exploring all of them and selecting the best application for the user in the system to monitor and produce results.
#1 Solution for Logs, Traces & Metrics
![]() APM
APM
![]() Kubernetes
Kubernetes
![]() Logs
Logs
![]() Synthetics
Synthetics
![]() RUM
RUM
![]() Serverless
Serverless
![]() Security
Security
![]() More
More


![New Relic vs Splunk - In-depth Comparison [2026]](/blog/content/images/size/w960/2024/10/Datadog-vs-sentry--19-.png)