Top 7 ManageEngine Competitors and Alternatives in 2024
ManageEngine is Zoho Corporation's enterprise IT management software subsidiary. AdventNet Inc. was founded in 1996 and was known as such until 2009. It is difficult to narrow down the ManageEngine Competitors from the market but for your consideration, we have listed the 7 best ManageEngine alternatives.
Over 90 tools are included in ManageEngine to assist you in managing all areas of your IT infrastructure, including networks, applications, servers, service desks, security, active directory, desktops, and mobile devices. They've also built products with contextual integration from the ground up to ensure that you can manage your IT together.
ManageEngine provides simple, easy-to-use IT management solutions at a cost that every company can afford. It was designed with small enterprises in mind and eventually scaled up to giant corporations.
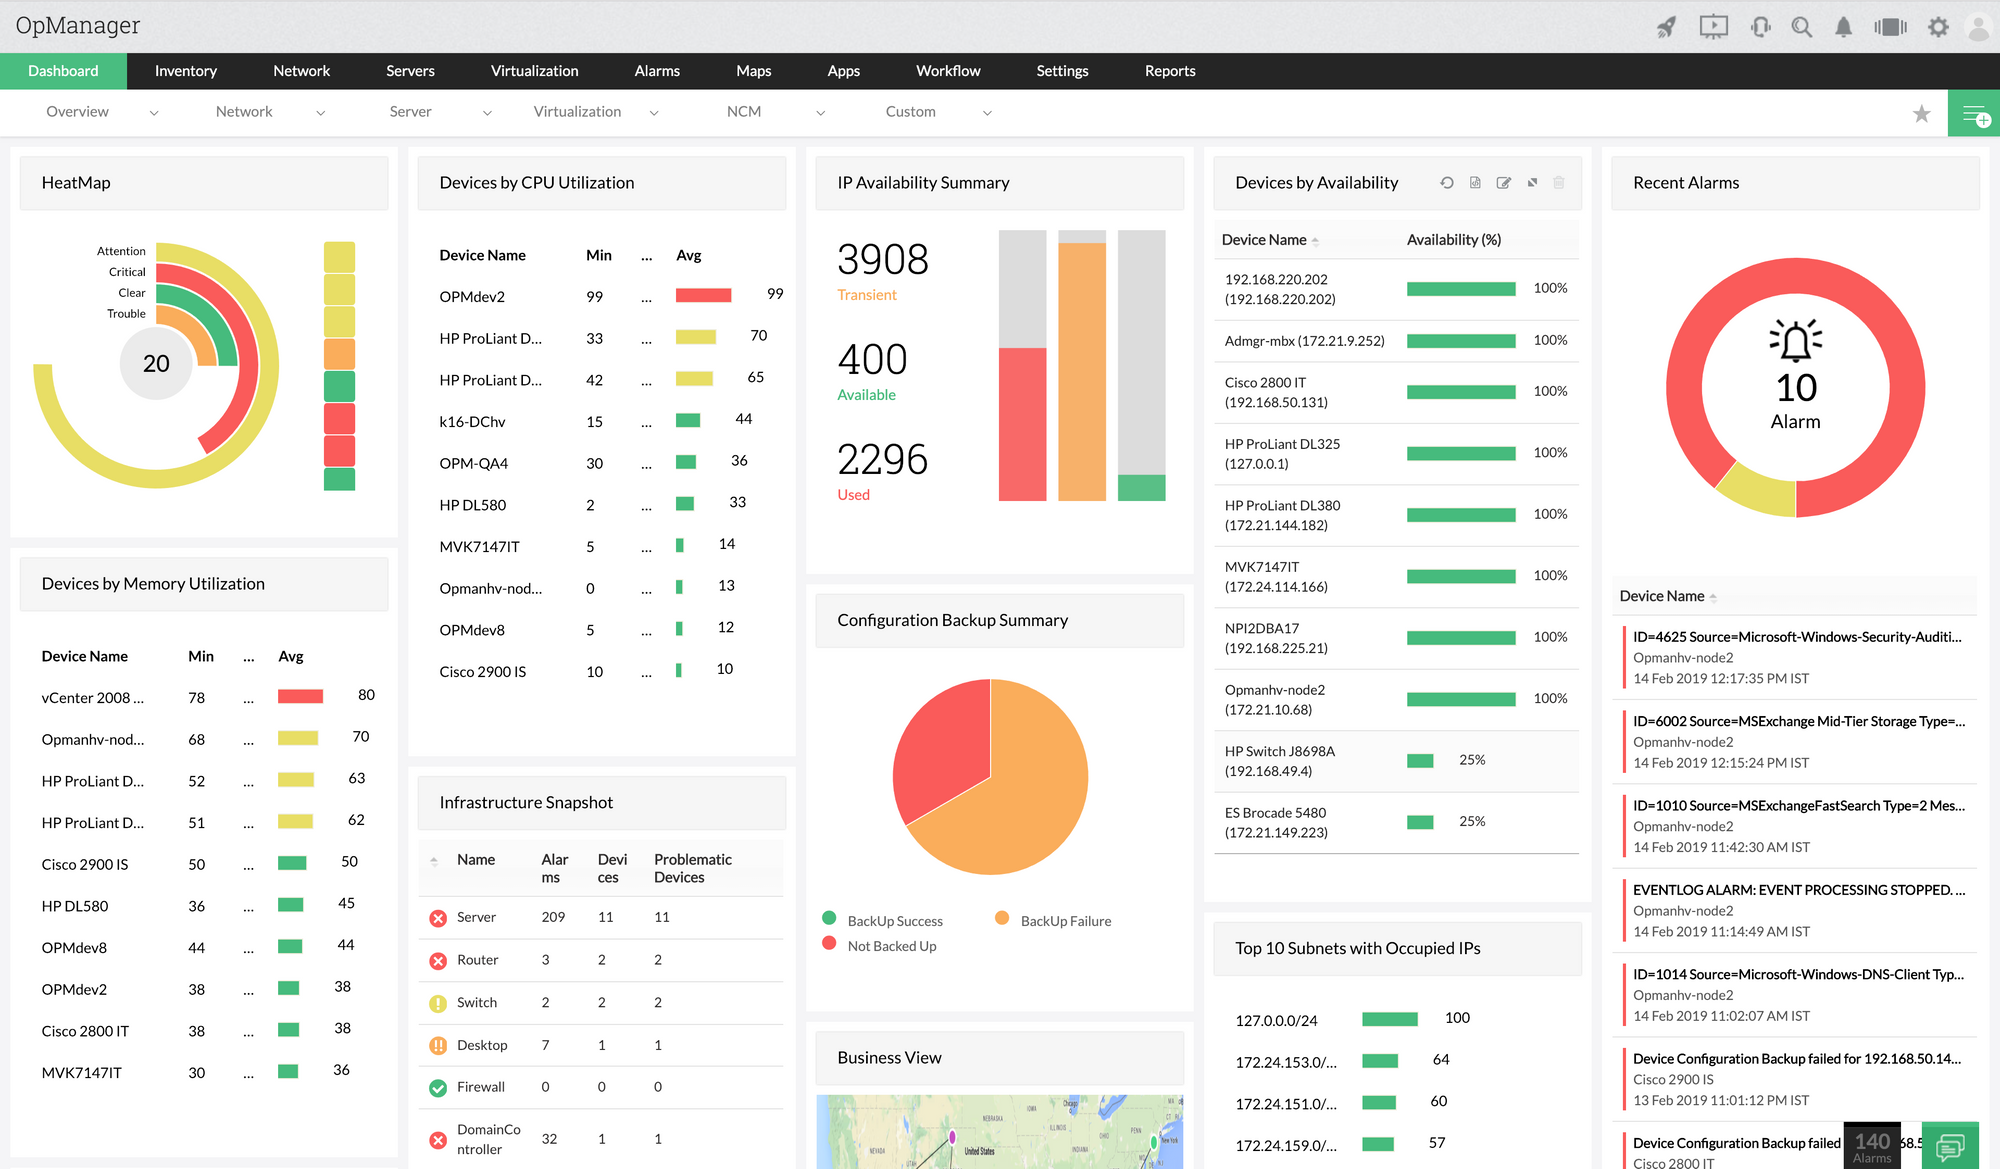
ManageEngine OpManager is a cost-effective and easy-to-use network monitoring solution. Routers, switches, firewalls, load balancers, wireless LAN controllers, servers, virtual machines, printers, storage devices, and everything else having an IP address and a network connection are all kept track of by it.
It monitors the network in real-time and gives you comprehensive visibility and control. Before operations are impacted, you can simply drive down to the root source of an issue and eliminate it.
It provides per-device pricing that allows you to gradually scale up once you've outgrown the basic capabilities of the Free Edition. It supports a wide range of operating systems and hypervisors, making it ideal for managing virtual infrastructure and more likely to help your company achieve its long-term goals.
Your network architecture, which includes local devices, wireless networks, WAN connectivity, and non-computing equipment like printers and access points, may be viewed and analyzed from end to end. Planning and configuration management are also linked, as are troubleshooting.
Furthermore, OpManager is pre-loaded with advanced auto-discovery technologies, allowing you to begin monitoring in minutes.
OpManager's capability may be expanded by combining it with other ManageEngine products and third-party solutions like Slack, ServiceNow, and others.
Customer Review:
G2 – 4.3/5
Crozdesk – 4.3/5
Capterra – 4.6/5
While ManageEngine OpManager is generally trouble-free, the automatic setup of several devices over multiple network addresses may cause the system to malfunction. When this occurs, you must remove the device from OpManager and manually add it as the type of server you want to monitor.
In this article, we are covering the ManageEngine alternatives with detailed explanations:
#1 Atatus
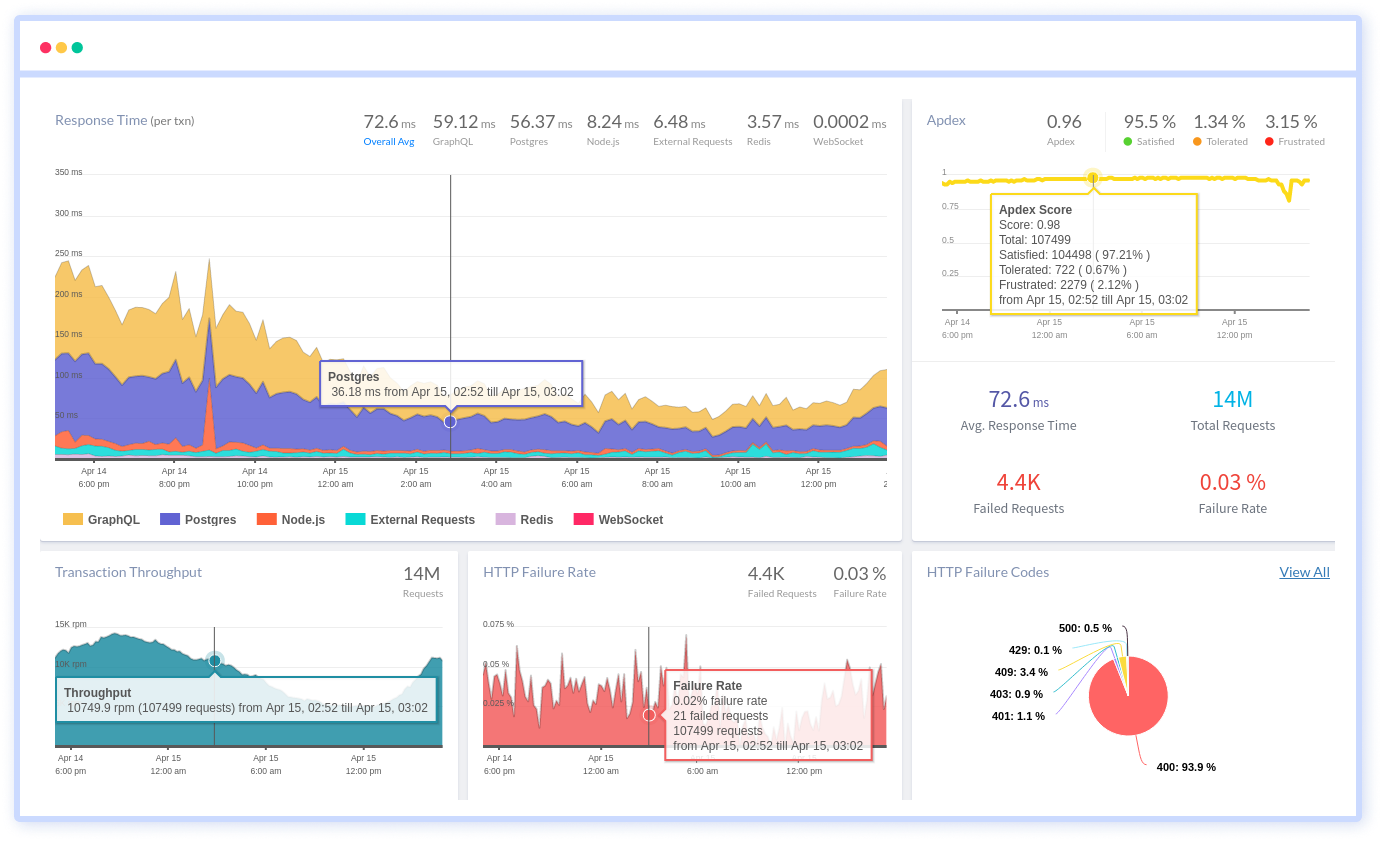
Atatus is a SaaS-based Observability solution that gives you full-stack visibility across all of your applications. It allows you to collect millions of performance data points across applications in real-time, allowing you to quickly fix issues and improve customer experiences. Furthermore, due to the flexibility of cloud or on-premise deployment, such events occur in real-time.
It offers a comprehensive view of all application performance metrics required to produce high-quality, dependable software. As soon as the issue arises, you will be notified. It includes information such as who, when, and what caused the performance degradation.
It monitors the health of your applications and notifies you when a customer experience issue arises. It assesses the frontend and backend performance of your complete application and analyses your customer satisfaction levels using Apdex (Application Index) scores. It also prevents difficulties with application performance or availability from affecting your users.
You can optimize end-user performance by understanding the complicated frontend performance issues caused by slow page loading, delayed static assets, and ajax queries using Real User Monitoring. You can also keep track of errors that have an impact on your customers' experience.
Infrastructure Monitoring from Atatus keeps track of the health of your servers, hosts, applications, and services that rely on them, so you can solve things fast and deploy a bug-free product with real-time information on all active hosts.
Atatus alerting system makes sending messages easier and faster. Individual alerts for browser, application, and infrastructure monitoring are also available. To receive alerts, you can choose from a variety of notification options.
Atatus APM supports Java, PHP, Node.js, Ruby, Python, and React. It integrates with Slack, Jira, GitLab, Asana, PagerDuty, Codeship, VictorOps, and more. Because of its features, it is considered to be one of the best ManageEngine competitors in the market.
To discover more about Atatus, sign up for a 14-day free trial or schedule a demo.
Customer Review:
G2 – 4.9/5
Crozdesk – 4.9/5
Capterra – 4.8/5
#2 Dynatrace
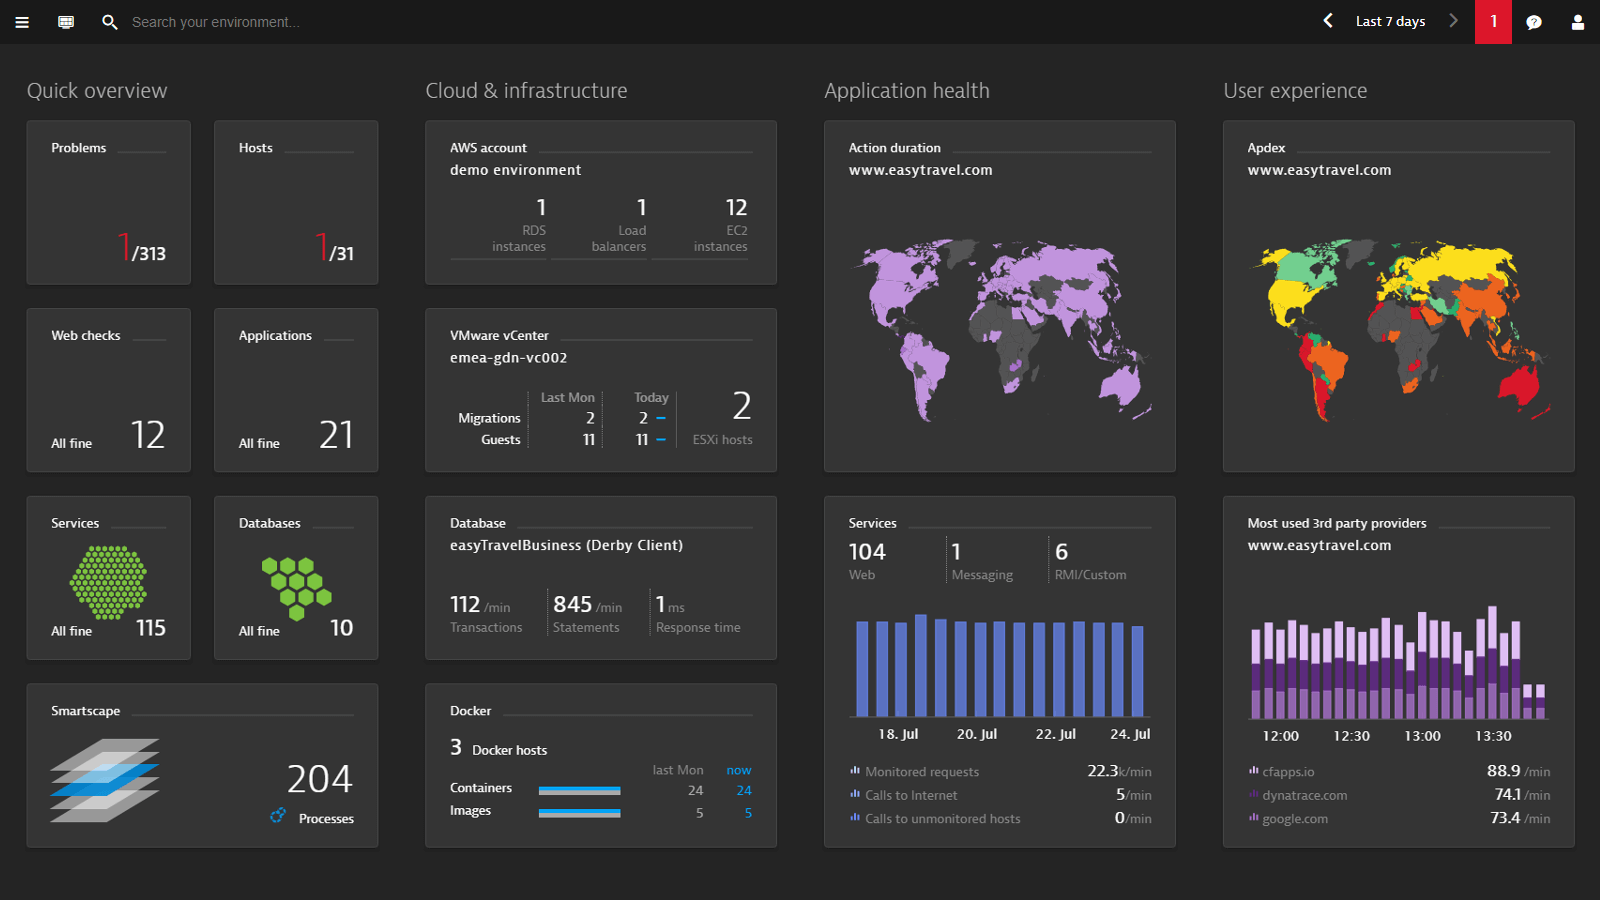
Dynatrace is a software intelligence platform that monitors and improves application performance, development and security, IT infrastructure, and user experience for businesses and government agencies around the world using artificial intelligence (AI) and automation.
The Dynatrace platform enables observability throughout the whole solution stack, reducing cloud complexity and accelerating digital transformation and cloud migration for enterprises, as well as enabling hyper scalability to meet demand.
Dynatrace's Real User Monitoring (RUM) analyses all user interactions with your apps, whether they happen in a browser or on a mobile device. Application availability monitoring, verification of correct UI element presentation, performance analysis of third-party content providers, performance analysis of backend services, and performance study of any underlying infrastructure are all possible with Real User Monitoring.
Dynatrace keeps track of your network, hosts, and processes even the entire infrastructure. You can observe information like the overall traffic on your network, the CPU utilization of your hosts, the reaction time of your processes, and more by doing log monitoring. Dynatrace also offers extensive topological data, such as which processes are running on which servers and how they are linked.
OneAgent, Amazon SWF, Fedora, Laravel, Opera, and others are among the 500+ technologies, extensions, and integrations supported by Dynatrace.
They provide a free 15-day trial (no credit card required).
Customer Review:
G2 – 4.5/5
Crozdesk – 4.5/5
Capterra – 4.4/5
#3 AppDynamics
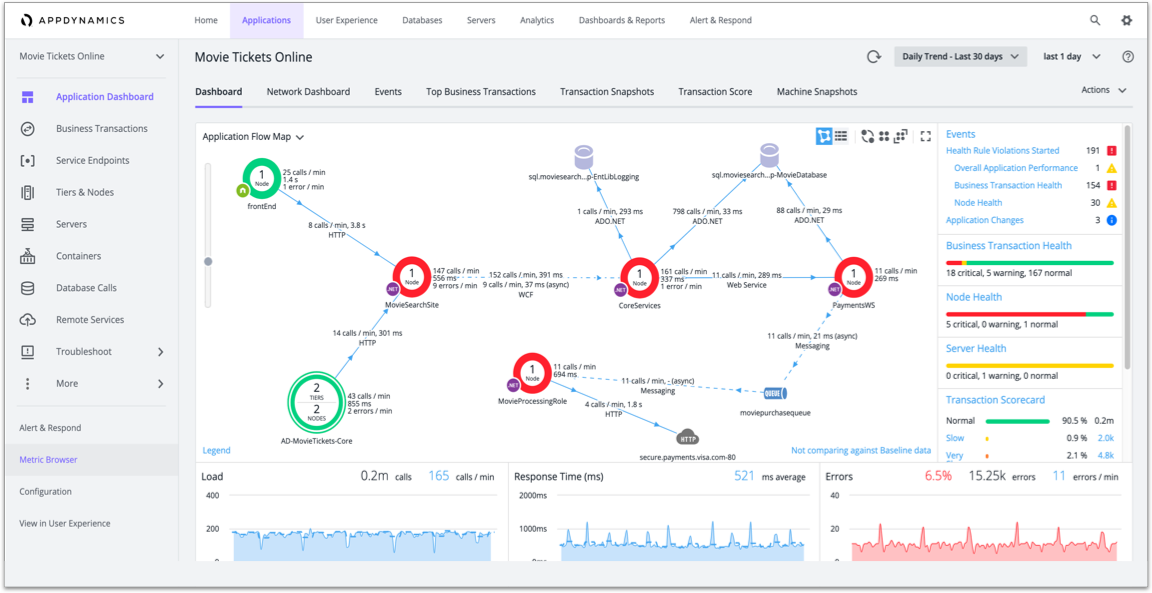
AppDynamics, situated in San Francisco, is a cloud-based APM solution and IT operations analytics for users all over the world. It is specialized in monitoring and regulating application performance and availability in cloud computing and data centers.
AppDynamics APM allows you to control and monitor your whole application delivery environment, from mobile/browser client network requests to backend databases/servers and everything in between. It provides a complete view of your application landscape and allows you to navigate across the distributed application to call graphs and exception reports issued on specific servers with ease. It provides a view of your code's runtime activity using an AppDynamics App Server Agent.
AppDynamics' Database Visibility gives information about calls to backend databases, including failures and call counts. An agent-less profile provides information on query execution and performance, giving you a better understanding of how the database server works. Infrastructure Visibility adds to the picture of your data center by providing important data about the machine and network performance.
End-User Monitoring from AppDynamics collects information on where your requests are coming from, what devices/channels your users are using, and how well your code performs after it's delivered to their devices.
AppDynamics can send notifications or take actions in response to events or circumstances you specify. Using the alert and response option, you can notice problems as they happen, or even before they happen.
Java, .NET, Node.js, PHP, Python, C/C++, and more major programming languages are supported by AppDynamics. It integrates with Apica, CloudFabrix, Glassbox, ServiceNow, Zigiwave, etc.
They provide a 15-day free trial.
Customer Review:
G2 – 4.3/5
Crozdesk – 4.3/5
Capterra – 4.5/5
#4 LogicMonitor
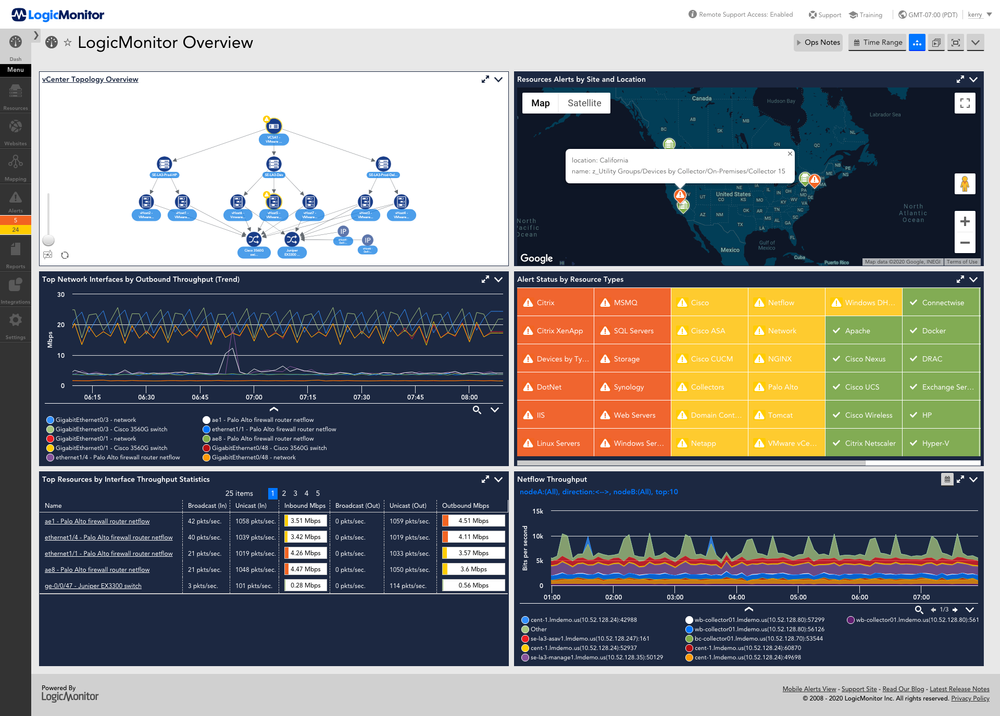
LogicMonitor is a cloud-based infrastructure monitoring and observability platform which provides fully automated data center monitoring. Also, it is one of the best ManageEngine competitors.
IT Ops teams can manage today's sophisticated on-premise, hybrid, and cloud IT infrastructures with LogicMonitor's automated SaaS performance monitoring solution, which provides end-to-end visibility and actionable data.
Distributed Tracing from LogicMonitor is an OpenTelemetry-based interface for transporting trace data from instrumented applications and monitoring end-to-end requests as they transit across your distributed services environment. These traces are displayed with crucial metrics and contextual logs on the Traces page.
Having all of an application's metrics, traces, and logs in one location can help you quickly understand what's happening, why it's happening, and where it's happening, helping you to troubleshoot faster and enhance application performance.
LogicMonitor Logs uses an algorithmic root-cause analysis technique to give a unique and unified method of log analysis. It looks for normal patterns and anomalies, or deviations from the norm, in log events. To aid the investigation, these log anomaly events, as well as metric Alerts and Topology information, are displayed on a Logs page.
It integrates with Puppet, Ansible, Azure, Redis, VMware, Solaris, CISCO ASA Firewall, and more.
To discover more, sign up for their 14-day free trial of LogicMonitor.
Customer Review:
G2 – 4.5/5
Crozdesk – 4.5/5
Capterra – 4.7/5
#5 Datadog
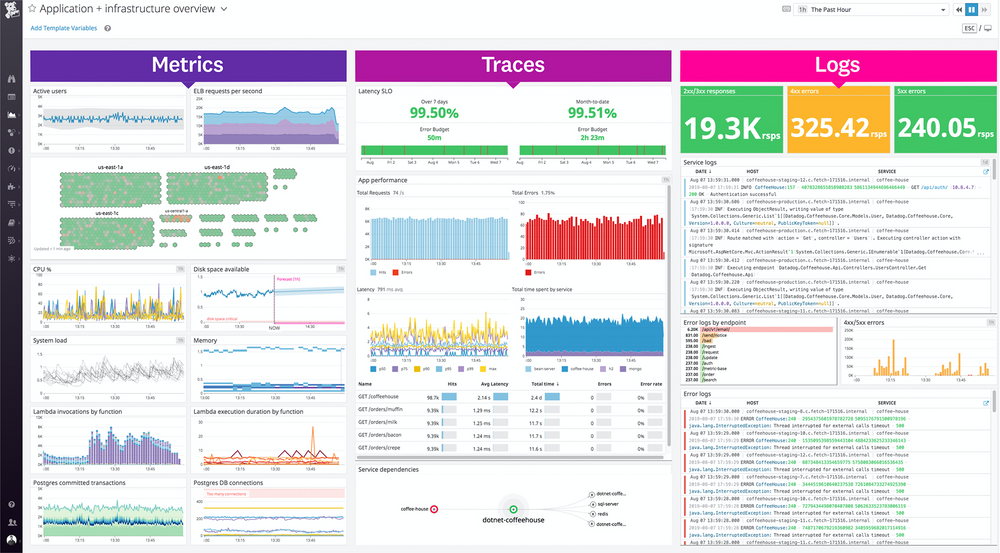
Datadog is a cloud-scale application observability tool that monitors servers, databases, tools, and services using a SaaS-based data analytics platform. Datadog APM and Continuous Profiler provide incredible visibility into your applications by monitoring requests, failures, and latency with fantastic performance dashboards for web services, queues, and databases.
By separating log ingestion and indexing, Datadog Log Management, often known as logs, avoids some limitations. This allows you to gather, analyze, archive, review, and monitor all of your logs for a minimal price and with no log restrictions.
Real-time visibility into individual users' behavior and experiences is provided by Datadog's Real User Monitoring (RUM). It is designed to handle four kinds of use cases such as performance, error management, use, and support in web and mobile applications.
Datadog keeps a close watch on the performance of your webpages and APIs, both backend and frontend, and at multiple network levels, and warns you if anything goes wrong.
If you can't detect crucial changes, monitoring all of your infrastructures in one location isn't enough. With Datadog, you can set up real-time monitors for metrics, integration availability, network endpoints, and more. On the Alerting platform, you can configure monitors, notify colleagues, and handle alerts all in one place.
Official Datadog libraries are available for C#, Golang, Java, PHP, Python, and Ruby. It integrates with Alibaba Cloud, Bitbucket, Circleci, Salesforce desk, Hipchat, Marathon, etc.
To discover more, sign up for their 14-day free trial.
Customer Review:
G2 – 4.2/5
Crozdesk – 4.2/5
Capterra – 4.6/5
#6 Splunk
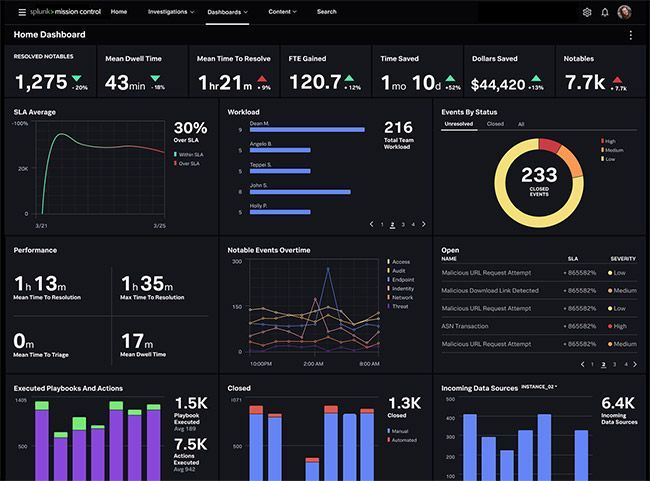
Splunk creates software that uses a Web-based interface to search, monitor, and analyze machine-generated data. It collects real-time data and organizes it into a searchable database from which reports, alerts, dashboards, and visualizations can be generated.
You can keep track of critical data about your applications, infrastructure, and cloud services through Splunk Observability Cloud. It provides a standardized interface for collecting and monitoring metrics, logs, and traces from many data sources. You can achieve full-stack, end-to-end observability of your whole infrastructure by gathering and monitoring data in one place.
You may collect traces and spans with Splunk APM to monitor your distributed applications. It gathers and analyses every span and trace from any service you've connected to Splunk Observability Cloud, giving you complete visibility into all of your application data.
Splunk Infrastructure Monitoring allows you to see what's going on with your hybrid and multi-cloud infrastructure and resources. It may collect data from a wide range of sources, including system metrics for infrastructure components and custom data from your applications.
You can debug your application and infrastructure behavior with Splunk Observability Cloud's high-context logs. Splunk Log Observer can be used to do codeless log queries to identify the source of problems in your systems. You can use log fields to create log processing rules and update your data as it comes in.
Using Splunk On-Call (VictorOps), developers, DevOps, and operations teams may shorten the meantime to discover and repair issues. It integrates with Docker, Kafka, Kubernetes, Mesos, New Relic, ServiceNow, and more.
They provide a 14-day free trial for the standard version, as well as a 60-day free trial for the enterprise edition.
Customer Review:
G2 – 4.4/5
Crozdesk – 4.2/5
Capterra – 4.6/5
#7 New Relic
New Relic is a software observability platform that aids in the creation of software and is well-known for ManageEngine competitors. It's a cloud-based software company situated in San Francisco that helps website and app owners track the efficiency of their services.
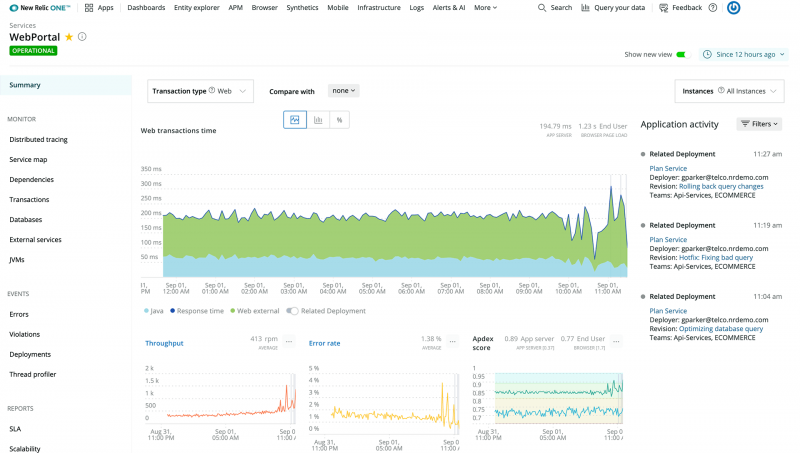
The Telemetry Data Platform brings all of your operational data together in one place, allowing you to ask and answer any question. With a unified telemetry platform, you can collect, explore, and alert on all your metrics, logs, events, and traces from any application.
The New Relic Explorer gathers all of your system's entities, as well as how they're connected, in one place, allowing you to immediately see performance issues and patterns. You can cut through the noise to locate the signal by automatically combining infrastructure health with application performance and end-user behavior.
For whatever you can track, you can use alerts to construct powerful and customized alert policies. As data from all of their products, including APM, infrastructure, browser, mobile, and NRQL queries receive notifications for changes in critical performance measurements.
For DevOps, site reliability engineers, and on-call teams, Applied Intelligence (AI) is an AIOps solution. It shortens the time it takes to locate, diagnose, and resolve issues. Since it's a hybrid machine learning engine, it can automatically filter out alert noise, correlate incidents, and detects anomalies. Applied Intelligence is designed to improve functionality and provide wiser context over time by applying machine learning to your data and feedback.
It integrates with Apache, Gatsby Build, Kafka, Joomla, Micrometer, Scala, WordPress, etc.
They provide a free version.
Customer Review:
G2 – 4.2/5
Crozdesk – 4.3/5
Capterra – 4.5/5
Finally!!!
We hope this list of ManageEngine competitors and alternatives will help you find a replacement software package for whatever you require. Many of these tools offer a free trial, so sign up and test the software on your network before making a long-term commitment.
#1 Solution for Logs, Traces & Metrics
![]() APM
APM
![]() Kubernetes
Kubernetes
![]() Logs
Logs
![]() Synthetics
Synthetics
![]() RUM
RUM
![]() Serverless
Serverless
![]() Security
Security
![]() More
More


![New Relic vs Splunk - In-depth Comparison [2026]](/blog/content/images/size/w960/2024/10/Datadog-vs-sentry--19-.png)