What is Database Monitoring? A Guide for Developers, DevOps, and SREs
Databases handle critical operations for applications, from online banking to e-commerce and streaming services. Any slowdown or failure can directly affect application performance and user experience. Database monitoring tracks performance, detects issues, and helps prevent downtime.
It also ensures efficient use of resources, maintains security, and supports compliance requirements. For developers, DevOps engineers, and SREs, monitoring provides the insights needed to keep systems fast, reliable, and scalable.
This blog will explain,
- What is Database Monitoring?
- Why Database Monitoring is Important?
- Key Metrics for Database Monitoring
- Tools Commonly Used for Database Monitoring
- Getting Started with Database Monitoring
What is Database Monitoring?
At its core, database monitoring is the continuous process of observing, measuring, and analyzing database performance to ensure reliability, speed, and availability. It involves collecting data about query execution, resource consumption, traffic loads, error rates, and storage usage.
The goal is to gain real-time visibility into the database environment, so you can:
- Detect issues before they escalate.
- Optimize queries and indexing strategies.
- Manage resources like CPU, memory, and disk I/O.
- Ensure databases scale efficiently with growing workloads.
Why Database Monitoring is Important?
Databases are mission-critical components of modern IT ecosystems. Even a small delay or outage can lead to major business disruptions. Let’s explore why monitoring is essential.
1. Preventing Downtime
Every second of downtime can cost businesses thousands of dollars. Monitoring helps spot anomalies like slow queries, blocked processes, or storage saturation, before they cause outages.
2. Optimizing Application Performance
Slow applications are often traced back to poorly performing queries. Monitoring pinpoints inefficient SQL statements, missing indexes, or locks that degrade performance.
3. Resource Utilization and Cost Savings
Databases consume CPU, memory, and storage. Monitoring helps track utilization trends, allowing teams to scale resources efficiently and avoid unnecessary infrastructure costs.
4. Supporting DevOps and SRE Teams
For DevOps engineers and SREs, database monitoring is essential for maintaining SLAs (Service Level Agreements), SLOs (Service Level Objectives), and SLA compliance.
5. Security and Compliance
Monitoring also aids in tracking unauthorized access attempts, failed logins, or unusual activity patterns, helping with compliance in industries like finance, healthcare, and e-commerce.
Keep Your Databases Reliable with Atatus
Get real-time query insights, detect bottlenecks early, and prevent downtime before it impacts your users.
Start Free TrialKey Metrics for Database Monitoring
Monitoring is only effective when you track the right database metrics. Below are the most critical ones:
Workload Metrics:
- Response Time:Measures the time it takes for the database to process a transaction or query and return a result, directly impacting user experience.
- Throughput:The number of transactions or queries processed per unit of time (e.g., transactions per second, or TPS).
- Query Execution Time:The specific time a single SQL query takes to run, helping to identify poorly performing queries.
- Query Response Time:How quickly a user receives data in response to a query.
- Concurrency:The number of active users or transactions interacting with the database simultaneously, which can affect performance under load.
Track the Right Metrics, Every Time
From query response times to resource utilization, Atatus gives you full visibility into your database health.
See How it WorksResource Metrics:
- CPU Utilization: The percentage of the database's CPU capacity being used.
- Memory Usage: The amount of system memory the database is consuming, often including the buffer cache.
- Disk I/O: Measures read and write operations on the disk, including factors like disk queue depth (pending I/O requests).
- Network Traffic: Monitors incoming and outgoing network traffic to and from the database.
- Storage: Tracks the amount of free storage space available for the database.
Internal Database Metrics:
- Cache Hit Ratio: The percentage of data requests satisfied from the in-memory buffer cache versus requiring a disk read.
- Lock Waits: Indicates when connections or queries are blocked waiting for a resource to be released, signaling potential contention.
- Database Connections: The number of active connections to the database.
- Error Rates: The frequency of errors occurring within the database system.
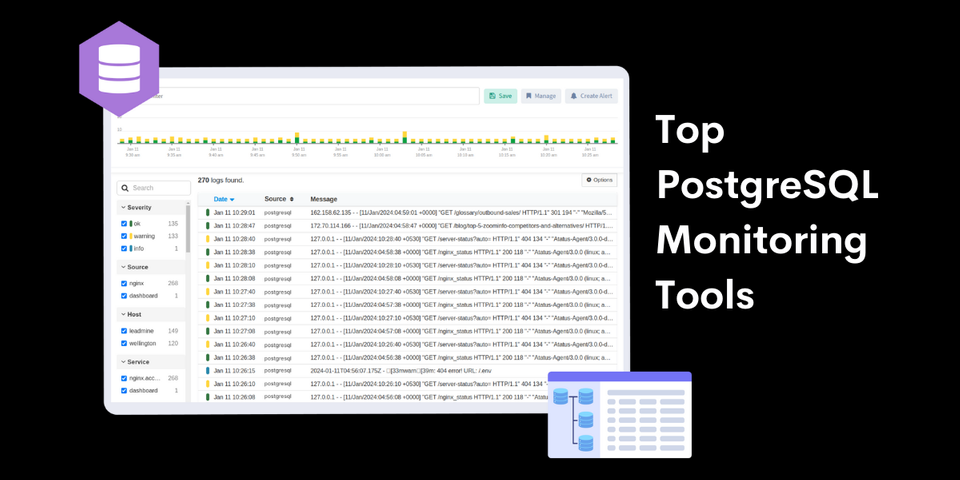
Tools Commonly Used for Database Monitoring
Several tools are available for effective database monitoring. Some popular ones include:
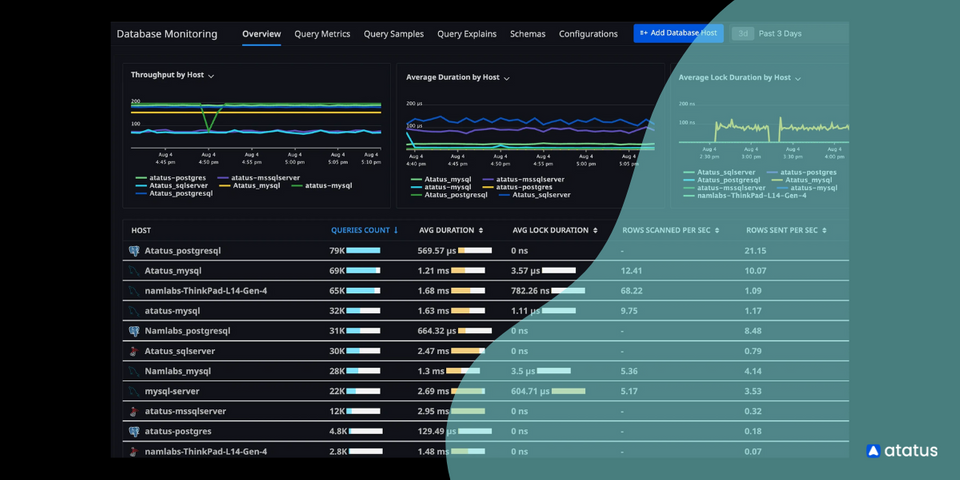
1. Atatus Database Monitoring
Atatus Database Monitoring (DBM) is a solution designed to provide deep visibility into the performance and health of your databases, unifying query, application, and database telemetry in a single platform.
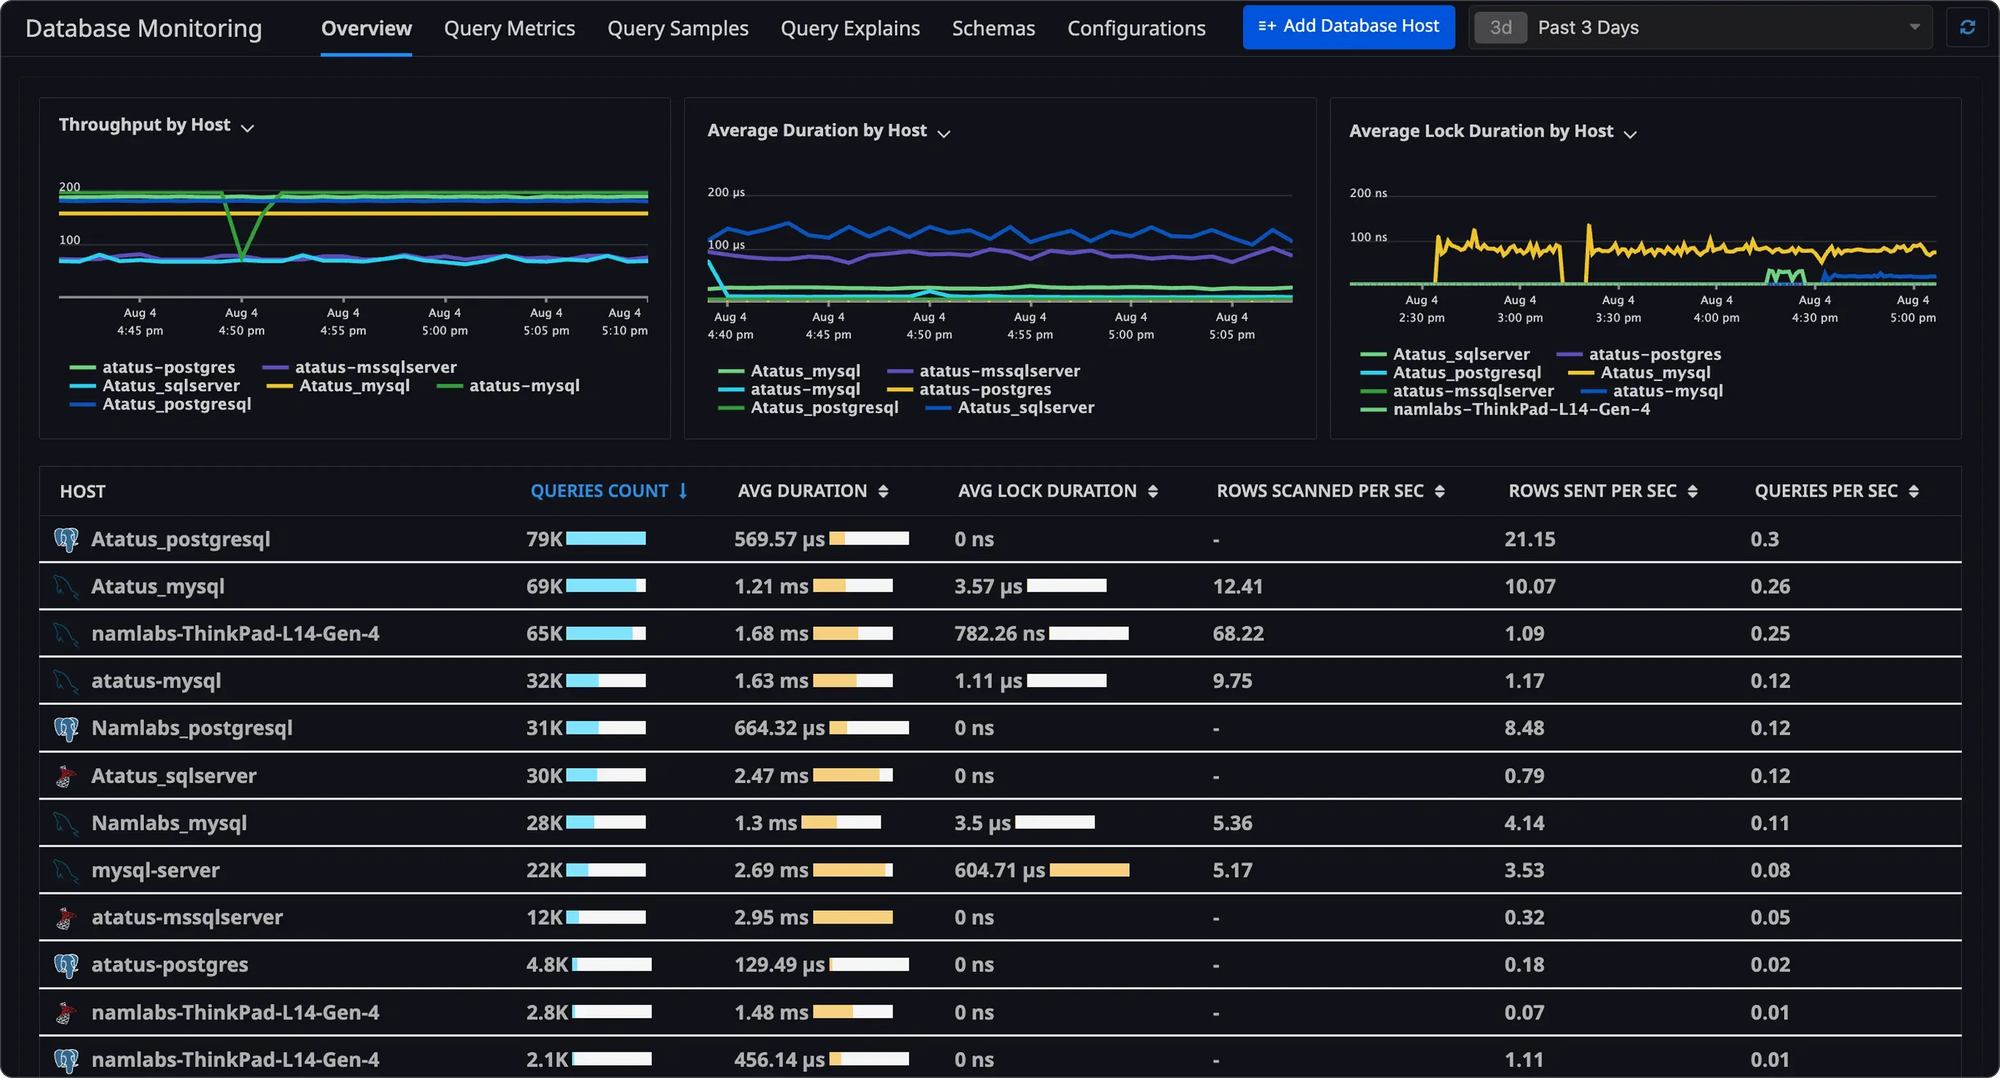
Key Features of Atatus DBM:
- Comprehensive Telemetry: Collects host-level metrics, historical query data, and explain plans for a complete view of database health.
- Query Optimization: Identify and fix slow queries, track performance trends, and compare execution plans to improve efficiency and reduce costs.
- Blocking Query Troubleshooting: Detect root blocking queries, view active connections, and analyze blocking duration.
- APM Integration: Correlate database performance with application behavior to pinpoint whether issues stem from the database or application.
- Performance Recommendations: Get proactive suggestions to optimize host and query performance.
- Multi-Database Support: Compatible with SQL Server, MySQL, PostgreSQL, and Aurora.
- Historical Analysis: Retains query metrics and samples for performance tracking over time.
Why Choose Atatus?
Unlike generic monitoring tools, Atatus is built for developers, DevOps engineers, and SREs. Get deep query-level insights, real-time alerts, and easy-to-use dashboards.
Compare Plans2. Dynatrace
Dynatrace is an enterprise-grade solution that delivers AI-powered database performance monitoring with automated root-cause analysis.
It can detect anomalies and performance degradation in real time while offering deep integration with cloud platforms for complete observability.
3. New Relic
New Relic stands out for its advanced monitoring capabilities supported by AI-based anomaly detection.
It provides detailed transaction traces, in-depth query analysis, and multi-database monitoring with seamless cloud-native integrations, making it a solid choice for complex environments.
4. Datadog
Datadog offers cloud-native monitoring with extensive database integrations. It gives teams end-to-end visibility by combining logs, metrics, and traces in one unified platform.
With machine-learning-driven alerts, it ensures faster detection and resolution of database performance issues.
5. SolarWinds
SolarWinds specializes in query-level monitoring and optimization. It identifies inefficient indexing, highlights resource-intensive queries, and delivers historical trend analysis to support capacity planning and performance tuning.
Getting Started with Database Monitoring
Getting started with database monitoring involves a structured approach to ensure optimal performance, security, and availability of your databases.
1. Define Objectives and Requirements:
- Business Goals:Determine what aspects of database performance are critical for your business operations and user experience.
- Key Performance Indicators (KPIs):Identify the metrics that directly reflect your goals, such as query response time, throughput, resource utilization (CPU, memory, disk I/O), and error rates.
- Security and Compliance:Outline specific security and compliance requirements that your monitoring strategy must address.
2. Choose the Right Monitoring Tools:
- Compatibility:Select tools compatible with your specific database types (e.g., MySQL, PostgreSQL, SQL Server, Oracle) and infrastructure (on-premises, cloud, hybrid).
- Features:Look for features like real-time monitoring, performance metrics, query performance analysis, resource utilization analysis, audit logging, anomaly detection, automated alerts, customizable dashboards, and scalability.
3. Establish Baselines and Set Alerts:
- Baselines:Define normal performance metrics for your database environment. This provides a benchmark for identifying deviations.
- Alerting Thresholds:Configure alerts for critical metrics, such as high CPU usage, slow query response times, or unusual error rates, to enable proactive issue detection. Avoid alert fatigue by setting meaningful thresholds.
4. Implement Monitoring and Data Collection:
- Install Agents/Integrations:Deploy monitoring agents or configure integrations to collect data from your databases and infrastructure.
- Monitor Core Metrics:Begin by tracking fundamental metrics like CPU, memory, disk I/O, network I/O, and active connections.
- Dive into Query-Level Insights:Analyze slow query logs and use tools to identify and optimize inefficient queries.
5. Analyze Trends and Optimize:
- Trend Analysis:Leverage historical data to identify performance trends, predict potential issues, and optimize resource allocation.
- Troubleshooting:Use monitoring data to diagnose and resolve performance bottlenecks, errors, and other database-related problems.
- Continuous Optimization:Regularly review and refine your monitoring strategy based on evolving business needs and performance insights.
6. Integrate and Automate:
- Integration with IT Systems:Ensure your monitoring solution integrates with other IT management tools for a unified view of your infrastructure.
- Automation:Automate routine monitoring tasks and consider using automation for addressing common issues or triggering responses to critical alerts.
By following these steps, you can establish a robust database monitoring system that helps maintain optimal database health and performance.
Next Step!
Take charge of your database performance with Atatus. Monitor queries, track resource usage, and get real-time alerts to prevent slowdowns and downtime. Ensure your applications stay fast, reliable, and seamless for every user.
See it in Action#1 Solution for Logs, Traces & Metrics
![]() APM
APM
![]() Kubernetes
Kubernetes
![]() Logs
Logs
![]() Synthetics
Synthetics
![]() RUM
RUM
![]() Serverless
Serverless
![]() Security
Security
![]() More
More