Modern applications must deliver not only value, but also around-the-clock availability, quick replies, and real-time problem-solving in today's digital marketplace. Because all businesses rely on software applications, their performance is one of their top concerns and difficulties, especially if their applications are the business itself. This is where APM arrives.
We will cover the following:
- What is Application Performance Monitoring?
- Why Application Performance Monitoring is Important?
- Components of Application Performance Monitoring
- Three categories of Application Performance Monitoring
- How does Application Performance Monitoring Work?
What is Application Performance Monitoring?
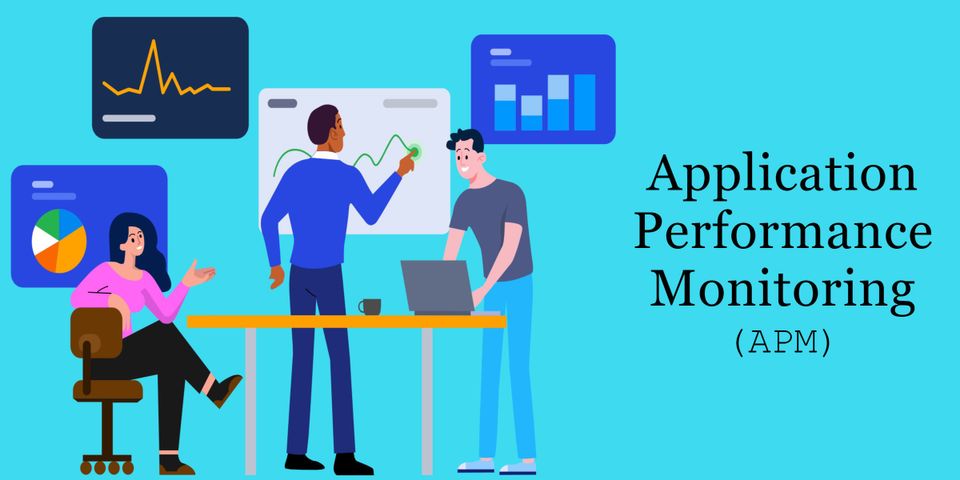
Application performance monitoring (APM) is a set of tools and processes that assist information technology (IT) professionals in ensuring that the applications they use satisfy performance standards and deliver a positive user experience (UX). Application performance monitoring is a subset of application performance management, which is a more generic phrase. While application performance monitoring focuses just on measuring an application's performance, application performance management encompasses the larger concept of controlling an application's performance levels, which includes monitoring.
Infrastructure monitoring, as well as tracking the user experience, application dependencies, and business transactions, are all important aspects of an efficient application performance monitoring solution. APM tools give administrators the information they need to swiftly identify, isolate, and resolve issues that can harm an application's performance.
Performance metrics collected by an APM tool from a single application or numerous applications on the same network can be used by IT experts to pinpoint the source of a problem. Client CPU utilization, memory demands, data throughput, and bandwidth use are among the statistics collected by APM tools.
Why Application Performance Monitoring is Important?
It's vital to provide a responsive, stable experience to your clients in the age of always-on applications. It's also important to be able to swiftly discover software flaws, understand their implications, and be able to remedy them. The ways in which software and the method it is deployed become more complicated, so do the ways in which it can fail.
Complex cloud deployments, elastic infrastructure, and containerization improve scalability and performance, but they also present new opportunities for your applications to fail in less obvious ways. Partially degraded products are currently more common than a complete failure. It's fairly uncommon for parts of your applications to be broken for some clients while working perfectly for your staff.
APM allows you to observe exactly what is going on with your applications in real-time. This means you'll be able to spot problems quickly and fix them - or, better yet, anticipate them before they affect customers.
APM offers immediate benefits for software teams as well. A thorough awareness of what's going on with your production applications aids teams in prioritizing by:
- Determining which bugs customers are experiencing and at what frequency
- Identifying which parts of your application are the most popular
- Identifying possibilities to increase the value of your application or increase market share
- Concentrating their attention on the activities that produce the best results for your company
APM provides crucial insights into what is really going on while you service your consumers. This allows you to stop guessing and make educated decisions in order to improve application stability, lower expenses, and gain more business.
Components of Application Performance Monitoring
The goal of application performance monitoring is to keep track of five key aspects of an application's performance:
Runtime Application Architecture
It examines the hardware and software components involved in the application's execution, as well as the parts with which they interact. IT experts can predict future problems by seeing patterns and identifying performance issues before they occur.
Real User Monitoring
Real user monitoring also known as end-user experience monitoring, collects user-based performance data to determine how well an application performs for users and to identify potential performance issues. It allows a company to quickly respond to problems and understand their consequences. End-user experience can be tracked in two ways:
- Synthetic monitoring — Uses probes and bots to impersonate an end-user in order to identify issues before the application is launched. This tracking mechanism is also used to keep track of the application's service-level agreements (SLAs).
- Agentless monitoring — Analyses network traffic that passes via load balancers and switches using data probes. This will disclose information about overall infrastructure performance as well as information on the evaluated client, such as their location, operating system, and browser.
Business Transactions
Business transactions, also known as user-defined transaction profiling, concentrate on analysing and recreating individual user interactions to test and understand the conditions that contribute to a performance issue. This procedure will aid businesses in tracing events as they flow through the application's many components, as well as revealing when and where events occur — and whether or not performance efficiency is optimized.
Component Monitoring
Component monitoring, also known as application component deep dive, is the process of keeping track of all components of an IT infrastructure. Within the application performance infrastructure, extensive, in-depth monitoring is performed on all consumed resources and experienced events. All servers, operating systems, middleware, application components, and network components are examined. Component monitoring allows for a more in-depth understanding of the numerous elements and pathways discovered through the preceding procedures.
Analytics and Reporting
Analytics and reporting entail converting the data obtained during the preceding stages into information that can be utilized for the following purposes:
- To establish a performance baseline based on historical and current data that establishes a standard for application performance.
- By comparing infrastructure changes to performance changes, possible areas for improvement can be identified.
- Utilizing historical and baseline data, quickly detect, detect, and rectify performance issues
- Predicting and alleviating any future issues using actionable data
The analytics and reporting components are critical to achieving a positive return on investment (ROI) for the firm.
Three categories of Application Performance Monitoring
The health of your applications depends on the use of APM technologies. For ant type of application, there are three main categories of APM:
#1 App Metrics-based
Several technologies use a variety of server and app metrics to call it APM. The majority of APM solutions will just alert you to the overall number of requests tapped in the application, identifying any URLs that may be experiencing trouble. Because they don't do code-level profiling, they won't be able to tell you why.
#2 Code-level Performance-based
Based on code profiling and transaction tracing, they are the most common sort of application performance management software.
#3 Network-based
The network-based application performance monitoring approach entails recording network traffic and evaluating application exchanges to generate network performance statistics, such as server response time. It is an excellent approach to get a broad picture of all applications traversing the network while integrating easily and passively into the IT infrastructure.
How does Application Performance Monitoring Work?
Application performance monitoring examines how well applications perform and whether they are operating properly. If the applications aren't working properly, data is acquired to determine the source of the problem, the data is examined in light of its impact on the business, and the application environment is rectified to prevent future difficulties.
Three types of data should be examined while creating an APM solution: metrics, trace, and log files. A metric is a numerical measure that may be used to determine the current state of a process. To assess the status of a system or process, metrics are frequently compared to a stated baseline. Changing measurements are a common sign of a deeper problem.
The following are some of the most important application monitoring metrics:
- Web Performance Monitoring - Determines the average response time for end-user interactions to see if speed has an impact on application performance.
- CPU Utilization - Keeps track of CPU utilization, as well as disc read-write speeds and memory needs, to see if it's affecting application performance.
- Application Availability and Uptime - Determines whether the application is online and available to users; it's typically used to verify if an organization's service level agreement (SLA) is being met.
- Request Rates - Identifies any large increases, declines, or simultaneous users by measuring the amount of traffic received by the application.
- Customer Satisfaction - Compares how customers feel about the application to a pre-determined benchmark.
- Error Rates - This metric measures how the application degrades or fails at the software level.
- Number of Instances - Counts the number of server or application instances that are active at any one time. This is especially true for applications that are hosted on the cloud.
A trace is a record of a request's entire processing. A trace is used to visualize and comprehend the entire route of a request as it passes through all of the network's components and services. A trace contains hundreds of data points that can be used to discover and identify network issues, diagnose security concerns, and highlight errors.
An application or operating system creates log files that include information about user activity and events that occurred on the application. Root cause analysis, understanding why a measure changed and determining where an event started are all done via log files.
Summary
APM is required to assure the availability of software applications, making its use necessary, especially if you run a SaaS company. DevOps can use APM tools to figure out how application releases affect service performance, security, and reliability. They allow teams to set up alerts to detect and resolve issues before they have a negative impact on the user experience, as well as to automate actions based on certain events, patterns, and trends.
Monitor Your Entire Application with Atatus
Atatus provides a set of performance measurement tools to monitor and improve the performance of your frontend, backends, logs and infrastructure applications in real-time. Our platform can capture millions of performance data points from your applications, allowing you to quickly resolve issues and ensure digital customer experiences.

Atatus can be beneficial to your business, which provides a comprehensive view of your application, including how it works, where performance bottlenecks exist, which users are most impacted, and which errors break your code for your frontend, backend, and infrastructure.


