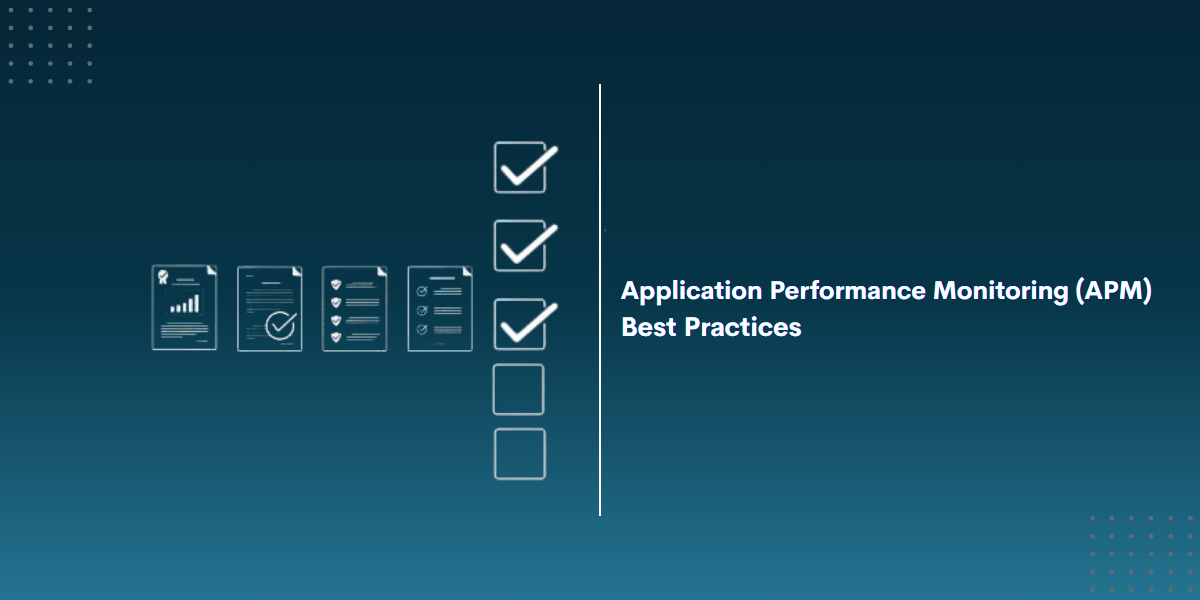
The Complete Guide to APM Best Practices for Developers, DevOps & SREs
Application Performance Monitoring (APM) is no longer optional, it is essential for delivering fast, reliable, and seamless digital experiences. But simply installing an APM tool isn’t enough. To truly know its potential, IT teams need to follow APM best practices.
Best practices for APM refer to the most effective ways to monitor, analyze, and optimize your application’s performance using APM tools. If you are a developer, DevOps engineer, or SRE, following the right APM practices makes it easier to spot issues early, and deliver better software faster.
In this blog, we will break down the key APM best practices and how they help modern engineering teams work more efficiently.
In this Blog Post,
- Best Practices for Application Performance Monitoring and Observability
- Define Clear Performance Objectives
- Standardize Application Naming
- Set Up Smart Alerts and Notification Policies
- Identify and Monitor Key Transactions
- Focus on End-User Experience
- Eliminate Tool Sprawl
- Review APM Reports Regularly
- Automate Incident Detection and Response
- Visualize Dependencies with Service Maps
- Keep Agents and Configurations Up to Date
- Power Your Performance Strategy with Atatus
Best Practices for Application Performance Monitoring and Observability
1. Define Clear Performance Objectives
Before setting up any monitoring, it is important to define what good performance actually means for your application. Too often, teams track every available metric but fail to focus on the ones that truly affect user experience or business outcomes. Instead of monitoring everything, align your goals with what the business actually needs.
Always link each SLO/SLI to a business goal. When choosing SLIs, prioritize metrics that are measurable and actionable, like p95 latency instead of average latency. Use different SLOs for critical user-facing services and internal tooling.
A B2B SaaS team set a measurable goal to reduce their API latency by 25% to improve integration speeds for their clients. With this target in place, they focused their APM efforts on pinpointing performance bottlenecks. The APM data revealed that slow database joins were causing delays. By introducing a caching layer, they significantly reduced response times and achieved their goal within six weeks.
2. Standardize Application Naming
Naming Generic names like My App or Test Service might work in early development, but they quickly become confusing in a large ecosystem with multiple services and environments. Without standardized names, teams often end up wasting time trying to figure out which app or environment they’re looking at.
To avoid this, use a consistent naming convention for all applications monitored under your APM tool. Use consistent naming patterns, service-name[env], e.g., billing-api[prod], auth-service[dev].
For example, a company managing over 40 microservices once found that half of their services were listed under the same default name. This caused dashboards to mix unrelated data, delaying issue resolution. By using standardized naming through their deployment scripts, they cleaned up their APM views and reduced confusion.
3. Set Up Smart Alerts and Notification Policies
Generic alerts don’t help. You need alerts that are actionable, and go to the right team through the right channel. Setting up meaningful alerts requires understanding which metrics matter, what thresholds indicate real problems, and who needs to know when something's wrong.
Start with static threshold alerts for well-understood metrics like response time, Apdex score, or error rate. Then, layer in dynamic anomaly detection to capture out-of-pattern behaviors that don’t break static thresholds but still indicate issues. Route to correct people using Slack, PagerDuty, Opsgenie, or Microsoft Teams.
In one case, a DevOps team noticed their alert system triggered 200+ emails during a 3-minute production slowdown, none of which helped identify the issue. After switching to anomaly-based alerts, they reduced alert volume by 80% and improved response time.
4. Identify and Monitor Key Transactions
Not all transactions are equal. Some interactions, like user login, checkout, or data export, are far more important than background tasks or internal admin functions. APM tools let you define and monitor these key transactions separately.
By isolating these flows, you can apply more granular alert rules, track their specific performance trends, and ensure they meet SLAs. This is especially useful in complex apps with many moving parts, where a failure in one flow could have a major business impact.
For example, a fintech company set up their loan application submission flow as a key transaction. After a code change, that flow slowed significantly, causing user drop-offs and missed conversion targets. Thanks to targeted monitoring, they were able to catch the issue early and roll out a fix before it became a major incident.
5. Focus on End-User Experience
It is easy to assume your backend is doing fine because error rates are low and CPU usage is under control. But if users are having a poor experience, slow loads, broken UIs, failed buttons, none of that matters.
That’s why APM should also include real-user monitoring (RUM) and synthetic tests. RUM gives visibility into actual user journeys: where they click, how fast pages load, what errors occur. Synthetic monitoring simulates user flows from different geographies to test uptime and performance around the clock.
A company once assumed their India-based users were having a great experience, backend metrics looked fine. But RUM revealed that page load times were double compared to Europe. The issue? A poorly configured CDN rule for the India region.
6. Eliminate Tool Sprawl
When each team uses separate tools for logs, metrics, and traces, it creates fragmented visibility and unclear accountability across your monitoring ecosystem.
The best APM strategy consolidates data into one or two platforms that support full observability, metrics, logs, traces, dashboards, alerts. This helps reduce context-switching, improves collaboration, and speeds up incident resolution.
Our Client replaced five monitoring tools with our single APM platform. This not only reduced licensing costs, but also helped cross-functional teams work from the same source, cutting mean time to resolution (MTTR) by 40%
7. Review APM Reports Regularly
Metrics are only useful if you look at them regularly. Reviewing reports helps teams spot trends, identify regressions, and forecast capacity needs.
Most APM tools provide out-of-the-box reports for SLAs, scalability, host usage, error rates, and more. Set up a weekly or monthly reviews to evaluate performance over time and share with engineering and business stakeholders.
For example, a customer using Atatus APM noticed through a quarterly report that their response times were increasing by about 5% each month. Since the change was gradual, it had not triggered any alerts or caught anyone’s attention. After digging into the traces, they found the issue, several database queries were missing indexes. Once fixed, performance returned to normal before any users were affected.
8. Automate Incident Detection and Response
As your traffic grows, so does the likelihood of outages. Manually identifying and reacting to every incident is no longer feasible. That’s where automation helps.
Many modern APM tools support automated workflows for anomaly detection and incident response. You can trigger automated actions such as scaling a service, restarting failed processes, or rolling back changes. These systems free up teams to focus on more complex issues while ensuring critical paths remain operational.
For example, an SRE team configured an auto-scaling policy that kicked in whenever queue length exceeded a certain threshold. During a Black Friday traffic surge, the system auto-scaled and stabilized performance without any human intervention.
9. Visualize Dependencies with Service Maps
In a distributed system, different services depend on each other to function properly. If one of them breaks or slows down, it can affect the rest of the system too. That’s why understanding how everything is connected is so important.
Service maps give you a clear, visual overview of how your services, APIs, databases, and external systems interact. This helps you quickly identify weak spots or failed connections.
For example, a team once saw that users couldn’t complete payments. It first looked like a frontend issue, but the service map showed that the problem was actually a slow connection between their API gateway and a token validation service. Fixing that backend link solved the problem for all users within minutes.
10. Keep Agents and Configurations Up to Date
APM agents are constantly improving they add new features, support for new frameworks, and fix critical bugs. But many teams set them once and forget about them.
Make it a habit to check agent versions and update regularly. Use your deployment scripts (Ansible, Chef, etc.) to automate this. Keeping agents up to date ensures compatibility, better data, and improved security.
In one case, an outdated agent was missing support for async task tracing. After updating, the team finally saw visibility into long-running background jobs, which helped them optimize queue handling.
Power Your Performance Strategy with Atatus
Implementing APM best practices is only part of the equation. To execute them successfully, you need a platform that supports deep visibility, real-time monitoring, and intelligent insights across your stack.
Atatus enables developers, DevOps engineers, and SREs to implement everything outlined in this guide, efficiently and at scale.
With Atatus, you can:
- Monitor real-time performance across services, APIs, and frontend apps
- Identify slow transactions, backend errors, and resource bottlenecks
- Track deployment impact using CI/CD integrations
- Set intelligent alerts based on both static thresholds and anomalies
- Visualize service dependencies to resolve incidents faster
Teams using Atatus have improved reliability, reduced mean time to resolution, and gained full-stack visibility, without needing multiple tools. Start your free trial today and see how Atatus helps you deliver more stable, performant applications.
#1 Solution for Logs, Traces & Metrics
![]() APM
APM
![]() Kubernetes
Kubernetes
![]() Logs
Logs
![]() Synthetics
Synthetics
![]() RUM
RUM
![]() Serverless
Serverless
![]() Security
Security
![]() More
More


![New Relic vs Splunk - In-depth Comparison [2026]](/blog/content/images/size/w960/2024/10/Datadog-vs-sentry--19-.png)