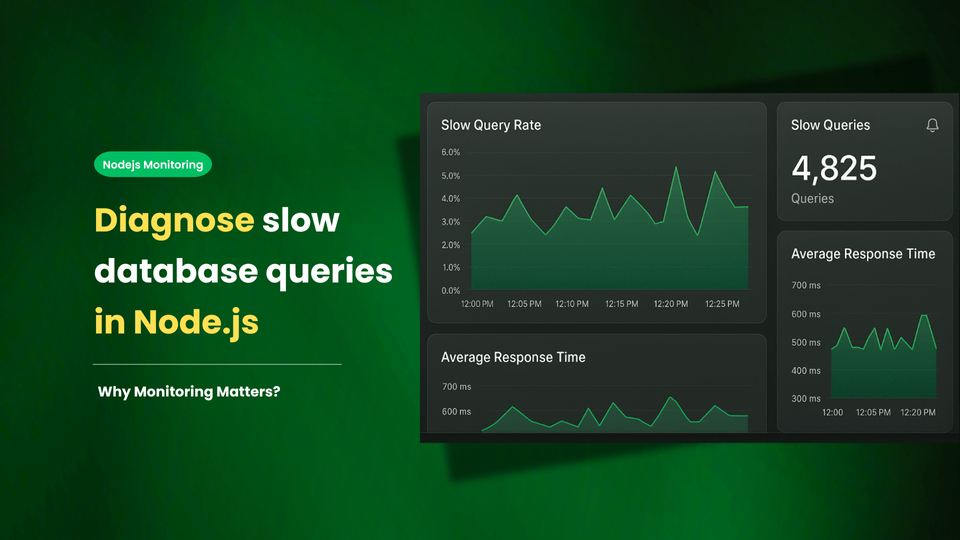
Diagnose slow database queries in Node.js: Why Monitoring is Essential?
Node.js is popular for building scalable applications because its non-blocking architecture can handle many requests at once. But when your app depends on a database, performance hinges on how efficiently queries run behind the scenes.
Even a single slow database query can block the Node.js event loop, causing delayed responses, frustrated users, and cascading performance issues. Too often, teams only notice these problems after customers experience lag or timeouts.
That’s why monitoring database queries is essential for identifying bottlenecks and keeping your Node.js applications running smoothly.
What’s in this guide?
- What is a slow query in Node.js?
- Why database queries slow down Node.js applications?
- Why queries go slow in real-world systems?
- Why logs and staging tests miss the problem?
- How monitoring changes query diagnosis?
- Key Metrics to Monitor for Node.js Queries
- How monitoring improves daily workflow?
- Real-world Examples of Query-related Issues
- Choosing the Right Monitoring Tool
- Atatus - The Best Choice for Node.js Applications
- Conclusion
- FAQs About Slow Queries in Node.js
What is a slow query in Node.js?
A slow query in Node.js is any database operation that takes longer than expected to complete, causing noticeable delays in application response time. Because Node.js runs on a single-threaded event loop, one poorly performing query can stall the entire process.
Slow queries typically show up as:
- Requests are taking seconds instead of milliseconds.
- Higher latency at the 95th or 99th percentile.
- A few queries consume most of the database execution time.
- User-facing slowness during peak load.
What counts as “slow” depends on your workload, but in most production systems:
- Queries over 100ms can be considered for optimization.
- Queries crossing 1s or more are almost always bottlenecks.
Understanding this baseline helps teams know when to investigate further and how to measure progress once optimization starts.
Start tracking slow queries in your Node.js app today with Atatus to pinpoint bottlenecks instantly
Request a demoWhy database queries slow down Node.js applications?
Node.js is built around a single-threaded event loop. This design makes it lightweight and fast for I/O-heavy applications. However, it also means long or slow operations block the event loop and reduce its ability to process new requests.
Database queries are asynchronous, but when a query takes too long, the request handler is stuck waiting. This results in a backlog of requests, increased latency, and a poor user experience.
Key reasons why this hurts Node.js apps more than others:
- Single-threaded design: one slow query can delay many requests.
- High concurrency: Node.js apps often handle thousands of connections; a small delay multiplies across users.
- Backpressure buildup: retries, timeouts, and slow responses cascade into other services.
Without visibility, teams often mistake these symptoms for CPU or infrastructure limits, when in fact the database is the bottleneck.
Why queries go slow in real-world systems?
Slow queries rarely come from a single reason. They usually emerge from a mix of schema design, ORM behavior, and production data patterns. Below are the most common causes:
- Missing indexes: Without proper indexes, databases scan entire tables to find data. This works fine in development with small datasets but falls apart when millions of rows exist in production.
- Complex joins and subqueries: Joining large tables or nesting queries can take significant time, especially if data is not structured for those access patterns.
- Excessive queries (the N+1 problem): Applications sometimes fetch data in loops, resulting in dozens of queries instead of one. In Node.js, this ties up the event loop with repeated calls.
- Fetching too much data: Retrieving every column or all rows instead of just what is needed wastes both database time and network bandwidth.
- Locking and contention: Long transactions hold locks and block other queries. When multiple requests compete for the same rows, delays can escalate quickly.
- Inefficient ORM usage: Abstractions provided by ORMs like Sequelize, Mongoose, or TypeORM can generate SQL that looks fine at first but scales poorly.
- Schema issues: Overly normalized data or poorly chosen data types lead to inefficient query plans and extra overhead.
Each of these issues can be fixed, but only once they are detected. This is where many teams struggle.
Keep your Node.js app fast by tracking every query in real time with Atatus
Sign up for freeWhy logs and staging tests miss the problem?
Most teams start with logs and query testing in staging environments. These methods help, but they fail under real-world conditions.
- Logs are incomplete: Developers log what they expect to see, but libraries and ORMs often generate queries silently. Logs also do not provide correlation between slow queries and the user-facing requests they affect.
- Staging environments don’t match production: Query performance depends heavily on data volume, indexes, and concurrency. A query that runs instantly in staging may crawl under real traffic.
- EXPLAIN plans are static: They reveal how a query runs in one instance, but not how it behaves under real load, with locking, or with many concurrent users.
In short: logs and tests help developers debug locally, but they do not tell SREs and DevOps teams why production users are waiting.
How monitoring changes query diagnosis?
Monitoring provides live visibility into database behavior under actual workloads. Instead of guessing or reconstructing from logs, teams can see exactly what happened when a request slowed down.
What monitoring gives you?
- Query-level details: Identify the exact SQL statement that was slow, along with its timing and frequency.
- Aggregated views: Similar queries are grouped, so patterns like N+1 queries are obvious.
- Lock and wait time analysis: Understand if contention or blocking is the root cause.
- Real-user performance: Monitor queries under real traffic and concurrency, not synthetic benchmark.
- Proactive alerts: Get notified when queries exceed thresholds before users complain.
This visibility cuts diagnosis time from hours to minutes.
Key Metrics to Monitor for Node.js Queries
Monitoring is only useful if you track the right signals. These are the most important metrics for Node.js database monitoring:
- Query execution time: Track average, 95th percentile, and 99th percentile latency.
- Number of queries per request: Detect N+1 or excessive queries.
- Query frequency: Identify queries that run thousands of times per minute.
- Rows returned: Spot queries retrieving unnecessary data.
- Connection pool usage: See if the app is exhausting available connections.
- Lock wait time: Detect contention from long-running transactions.
- Error and timeout rate: Identify failing queries or network bottlenecks.
For alerting, teams often watch:
- 95th percentile query time exceeding 500ms.
- Sudden spikes in query volume per request.
- Connection pool saturation beyond 80%.
These alerts, paired with traces, point engineers directly to the source of the slowdown.
How monitoring improves daily workflow?
Monitoring does more than highlight slow queries. It changes how teams work:
- Faster incident response: Instead of combing through logs, engineers see the problematic query in context.
- Shared visibility: Developers and SREs can look at the same traces, reducing blame and back-and-forth.
- Post-incident clarity: Retrospectives include actual query data, not guesswork.
- Preventive culture: Teams can track performance regressions as code ships and fix them before production pain grows.
- The biggest shift is cultural: performance becomes a shared responsibility. Monitoring gives teams the confidence to make this shift.
Real-world Examples of Query-related Issues
Here are real-world examples of slow query problems that monitoring helps solves:
Choosing the Right Monitoring Tool
Not all monitoring tools are created equal. When it comes to Node.js application monitoring, selecting the right tool is crucial for both performance insights and operational efficiency. Here are the key features to consider:
- Native Node.js & ORM Support: Integrates with drivers like MySQL, PostgreSQL, MongoDB, and ORMs such as Sequelize or TypeORM for accurate tracking without extra setup.
- Request-to-Query Correlation: Maps each request to its database queries, making it easier to identify which queries slow down specific endpoints.
- Query Fingerprinting: Groups similar queries to reduce dashboard noise and highlight patterns affecting multiple requests.
- Lightweight Agents: Collect metrics without adding noticeable overhead, keeping your app performant.
- Privacy Controls: Mask sensitive query data while still capturing performance patterns, ensuring compliance.
- Flexible Alerts: Integrates with Slack, email, PagerDuty, and other workflows for actionable notifications.
- Team-Based Pricing: Scales with team size rather than data volume for predictable costs.
A tool with these features provides technical depth and operational fit, helping teams pinpoint slow queries, optimize database interactions, and maintain a fast, reliable Node.js application.
Atatus - The Best Choice for Node.js Applications
Atatus is built for teams that need simple, powerful visibility into Node.js performance. Here’s why it stands out:
- Query-level visibility: See which queries are slow, how often they run, and how they affect requests.
- Full traces: Every query is tied to the endpoint and user request it belongs to.
- Real-time dashboards: Spot problems as they happen instead of after incidents.
- No heavy setup: Quick installation with support for common Node.js librarie.
- Actionable alerts: Notifications for slow queries, pool saturation, and timeouts.
- Team-friendly pricing: Costs scale with teams, not with data volume.
For DevOps teams, developers, and SREs, Atatus removes the guesswork and cuts diagnosis time. It helps teams avoid outages by surfacing the root cause before users feel the pain.
Conclusion
Slow database queries in Node.js are not just a technical issue. They stall event loops, frustrate users, increase costs, and keep engineers stuck in firefighting mode. Logs and staging tests cannot keep up with real-world traffic.
Monitoring is the only reliable way to find, understand, and fix these issues at scale. It provides live visibility, actionable metrics, and the shared truth your teams need to stay productive and confident.
Atatus gives you that visibility with minimal setup and clear insights. It helps you catch slow queries before they impact customers and provides the data to resolve them quickly.
Start your journey towards improved Nodejs application performance with Atatus
Sign up for freeFAQs About Slow Queries in Node.js
1) How do I know if a database query is slow in Node.js?
You can detect slow queries by monitoring request latency, checking database execution times, and using APM tools that trace requests. If your p95 or p99 latency spikes, slow queries are often the cause.
2) Can logs alone help me diagnose slow queries?
Logs can help, but they are incomplete. They don’t show the relationship between slow queries and user requests. Monitoring tools provide the end-to-end trace needed to diagnose issues quickly.
3) What are the most common causes of slow queries?
Slow queries usually come down to common bottlenecks:
- Missing indexes – queries that scan entire tables instead of indexed fields.
- Inefficient joins – combining large tables without proper keys.
- Fetching too much data – selecting all columns or rows instead of filtering.
- N+1 query pattern – running one query per record instead of batching.
- ORM overhead – frameworks generating inefficient SQL behind the scenes.
- Transaction locks – long-running queries that block others from executing.
4) How do you optimize queries in Node.js?
You can optimize queries in Node.js by:
- Adding proper indexes
- Reducing data fetched with selective queries
- Avoiding N+1 query patterns
- Rewriting inefficient joins
- Monitoring query execution times continuously
#1 Solution for Logs, Traces & Metrics
![]() APM
APM
![]() Kubernetes
Kubernetes
![]() Logs
Logs
![]() Synthetics
Synthetics
![]() RUM
RUM
![]() Serverless
Serverless
![]() Security
Security
![]() More
More

![What is Node.js Performance Monitoring? [A Complete Guide]](/blog/content/images/size/w960/2025/07/What-is-Node.js-Performance-Monitoring---A-Complete-Guide.png)